R E S E A R C H A R T I C L E
Open Access
Single-cell multiplexed cytokine profiling of
CD19 CAR-T cells reveals a diverse
landscape of polyfunctional
antigen-specific response
Qiong Xue
1,5*†, Emily Bettini
2†, Patrick Paczkowski
2, Colin Ng
2, Alaina Kaiser
2, Timothy McConnell
2, Olja Kodrasi
1,6,
Máire F. Quigley
1,7, James Heath
3, Rong Fan
4, Sean Mackay
2, Mark E. Dudley
1,8, Sadik H. Kassim
1,9and Jing Zhou
2*Abstract
Background:It remains challenging to characterize the functional attributes of chimeric antigen receptor
(CAR)-engineered T cell product targeting CD19 related to potency and immunotoxicity ex vivo, despite promising in vivo efficacy in patients with B cell malignancies.
Methods: We employed a single-cell, 16-plex cytokine microfluidics device and new analysis techniques to evaluate the functional profile of CD19 CAR-T cells upon antigen-specific stimulation. CAR-T cells were manufactured from human PBMCs transfected with the lentivirus encoding the CD19-BB-z transgene and expanded with CD3/CD28 coated beads. The enriched CAR-T cells were stimulated with CAR or control IgG beads, stained with anti-CD4 RPE and anti-CD8 Alexa Fluor 647 antibodies, and incubated for 16 h in a single-cell barcode chip (SCBC). Each SCBC contains ~12,000 microchambers, covered with a glass slide that was pre-patterned with a complete copy of a 16-plex antibody array. Protein secretions from single CAR-T cells were captured and subsequently analyzed using proprietary software and new visualization methods.
Results:We demonstrate a new method for single-cell profiling of CD19 CAR-T pre-infusion products prepared from 4 healthy donors. CAR-T single cells exhibited a marked heterogeneity of cytokine secretions and polyfunctional (2+ cytokine) subsets specific to anti-CAR bead stimulation. The breadth of responses includes anti-tumor effector (Granzyme B, IFN-γ, MIP-1α, TNF-α), stimulatory (GM-CSF, IL-2, IL-8), regulatory (IL-4, IL-13, IL-22), and inflammatory (IL-6, IL-17A) functions. Furthermore, we developed two new bioinformatics tools for more effective polyfunctional subset visualization and comparison between donors.
Conclusions:Single-cell, multiplexed, proteomic profiling of CD19 CAR-T product reveals a diverse landscape
of immune effector response of CD19 CAR-T cells to antigen-specific challenge, providing a new platform for capturing CAR-T product data for correlative analysis. Additionally, such high dimensional data requires new visualization methods to further define precise polyfunctional response differences in these products. The presented biomarker capture and analysis system provides a more sensitive and comprehensive functional assessment of CAR-T pre-infusion products and may provide insights into the safety and efficacy of CAR-T cell therapy.
Keywords:Single-cell proteomics, CD19 CAR-T cell product, Polyfunctionality, Microfluidic microdevice, Precision profiling
* Correspondence:[email protected];[email protected] †Equal contributors
1Novartis Pharmaceuticals, 64 Sidney Street, Cambridge, MA 02139, USA 2IsoPlexis Corporation, 35 NE Industrial Rd, Branford, CT 06405, USA
Full list of author information is available at the end of the article
Background
Adoptive immunotherapy is a novel treatment modality for human cancers [1, 2]. One such approach, CAR-T cell therapy, involves the use of viral vectors to genetically modify autologous T cells to express a chimeric antigen receptor (CAR) directed against a tumor antigen [2]. CD19 CAR-T, arguably the most successful CAR-T cell therapy to date in the clinic, involves genetically engineering autolo-gous T cells ex vivo to express CARs against a B-lineage antigen CD19, which is expressed on tumor cells such as diffuse large B-cell lymphoma (DLBCL) and B-cell precur-sor acute lymphocytic leukemia (B-ALL) [3–5]. While striking results with a high rate of complete remission (67%–90%) have been observed in clinical trials in adults and children with relapsed/refractory B-ALL [3, 5–8], encouraging, yet variable, results have been reported with other B-cell malignancies treated by CD19 CAR-T therapy. An overall response rate of 57% (4 complete responders and 4 partial responders out of 14 patients) was reported in a small trial on relapsed/refractory chronic lymphocytic leukemia (CLL) and a complete response rate of 57% (4 out of 7 patients) was reported in a phase I study with chemotherapy-refractory DLBCL [9]. These variable clinical responses across patients may result from many factors such as pre-conditioning regimen of patients, CAR-T cell administration procedure as well as T cell sources and manufacturing process. However, the key contributors to the variations are not fully identified [10, 11]. High-resolution single-cell analysis of functional attributes of CAR-T pre-infusion products may provide new insights into the variability of clinical responses and open up new avenues for the development of more efficacious yet safe CAR-T cell therapy.
In an in vitro system, the reorganization of tumor anti-gen by CAR, are followed by a wave of signals that comprise the secretion of cytolytic enzymes, stimulatory cytokines, and chemoattractive proteins. How these signals reflect CAR-T function in patient is minimally characterized and poorly understood. This is further compounded by the secretion of immunosuppressive cytokines that reduce the efficacy of treatment or pro-in-flammatory cytokines involved in immunotoxic side ef-fects such as cytokine release syndrome (CRS) [12]. Moreover, this signal, which varies between patients and differs in individual CAR-T cells, is difficult to control or standardize, highlighting a pressing need to systematical evaluate the ability of engineered CAR-T cell product to release these signals following an antigen-specific chal-lenge and to link this capability to clinical outcomes.
It is well accepted that T cells capable of co-producing multiple cytokines/chemokines at the single cell level, termed “polyfunctional” T cells, are the key effector cells contributing to the development of potent and durable cel-lular immunity against viral infection or cancer [13–16].
The same principle is expected to apply to engineered CAR-T cells in autologous cellular immunotherapy. Porter et al. showed that CD19 CAR-T-cells collected from CLL patients following treatment are indeed polyfunctional measured by 6-color ICS-FC [9]. Four patients exhibited complete remissions, and, for those patients, their CAR-T cells persist and retain polyfunctionality for up to 4 years post infusion [9]. This study highlighted the importance of polyfunctionality, for therapeutic efficacy of anti-tumor CAR-T cells. While most studies characterized single-cell cytokine production in CD19 CAR-T cells using intracellu-lar staining flow cytometry (ICS-FC) [17], the limited number of cytokine/chemokines measured per single cell undermines the capability to comprehensively assess CAR-T polyfunctionality.
A comprehensive assessment of CAR-T polyfunctionality has become possible with the development of a single-cell barcode chip (SCBC) microdevice that demonstrated simultaneous measurement of up to 42 cytokines secreted from single cells and thousands of single cells analyzed in parallel per device [18]. In the current study, we apply this microdevice technology to CD19 CAR-T cells to delineate the landscape of effector function capability in response to antigen-specific stimulation. We were able to load small quantities of CAR+ T cells onto the device and distinguish CD4 and CD8 cells using high content imaging cytometry. We then simultaneously measured 16 cytokines/chemo-kines from thousands of single CAR-T cells. Elevated cytokine/chemokine levels in response to antigen specific stimulation at the single-cell level were observed for cells generated from all 4 donors, albeit with significant donor-to-donor variation. Significant subsets of stimulated CAR-T cells exhibit high polyfunctionality with a dominant anti-tumor effector cytokine profile. New bioinformatics tools were developed to visualize polyfunctional T cell subsets and compare across donors. The analysis revealed distinct functional clusters from each donor and provided a land-scape of CD19 CAR-T cell effector functions upon antigen stimulation. The comprehensive single CAR-T cell analysis paves the way to understand the relationship between in vitro function profiles and therapeutic outcomes.
Methods
Fabrication of antibody barcode slides
The mixture was then injected into the mold using a syringe and the mold was cured in the oven at 80 °C for 1.5 h. After curing, the PDMS layer was removed from the mold and holes for the inlet and outlet ports were punched. Each flow-patterning PDMS chip measured 75 mm (length) × 25 mm (width) × 6 mm (height). The PDMS microchip contained 20 separate microchannels (20 μM width × 20μM depth) arranged in a serpentine pattern across the chip that can pattern up to 20 differ-ent solutions respectively. The PDMS microchip was then bound to a poly-L-lysine glass slide to form an anti-body flow pattern device. 2 μL of different capture antibodies (Additional file 1) were flowed into each microchannel through the PDMS chip for 3 h. The anti-bodies were immobilized on the glass slide by binding to the poly-L-lysine. After flow patterning, the PDMS was removed from the slide and the antibody barcode slide was blocked for 30 min in 3% BSA/PBS. The slide was then washed sequentially in PBS (Lonza), 50% PBS/DI water, DI water, DI water and dried for 30 s in a Labnet slide spinner (C1303-T). The slide was vacuum sealed and stored indefinitely at−20 °C prior to use.
Fabrication of microchamber array chips
The PDMS microchamber array chip was prepared using the microchamber array silicon master following the same steps as described above. The PDMS microcham-ber array chips were 25 mm (width) × 55 mm (length) × 4.75 mm (height). Each array contained 24 columns of 530 microchambers per column (totaling 12,720 micro-chambers per chip). Each microchamber measured 20μM (width) × 2060μM (length) × 20μM (depth) for a total volume of ~1.2 nL per chamber.
Generation of healthy CD8 T cells
Healthy PBMCs were isolated from whole blood (StemCell) using Ficoll-Paque Plus (GE Healthcare) density gradient centrifugation at 300 g for 20 min. The interphase containing PBMC was harvested and stimulated in complete X-VIVO 15 media (Lonza) at a cell density of 1 × 10⁷/mL with immo-bilized anti-CD3 antibody (10 μg/mL, eBioscience) and soluble anti CD28 antibody (4μg/mL, eBioscience) at 37 °C, 5% CO2for 48 h. The CD8 T cells then were enriched by
magnetic bead-conjugated anti-CD8 antibody (Miltenyi-Biotec) prior to SCBC assay and ICS assay.
ICS assay of healthy CD8 T cells
The enriched CD8 T cells were stimulated with PMA (50 ng/mL, Sigma-Aldrich) and Ionomycin (1 μg/mL, Sigma-Aldrich) at a density of 1 × 10⁶/mL in fresh complete X-VIVO 15 media at 37 °C, 5% CO2for 6 h with
brefeldin A (1μg/mL, eBioscience) the last 3 h. Cells were then fixed with 4% paraformaldehyde (Sigma-Aldrich), permeabilized with 0.5% saponin (Sigma-Aldrich), and
stained with PE-conjugated anti-IFN-γ /PE-CY7-conju-gated anti-TNF-α. The cells were acquired by S3e cell sorter (BioRad) and analyzed by Flowjo software v10 (TreeStar Inc.).
Generation of CD19 CAR-T cells
The CD19-BB-z transgene lentiviral vector was designed and produced as described before [3, 19, 20]. Apheresis of healthy donors (2 females and 2 males with age range 26– 51) was obtained from HemaCare. Methods of CAR-T cell preparation have been previously described [20–23]. Briefly, peripheral blood mononuclear cells (PBMCs) were isolated from the apheresis and activated with anti-CD3/ anti-CD28 monoclonal antibody-coated magnetic beads (Thermo Fisher) in a modified X-VIVO 15 media. Cells were transduced with a lentiviral vector encoding the CD19-BB-z transgene and ex vivo expanded in a closed system for 10 days. Cell concentration was monitored dur-ing the expansion process and fresh medium was added every 2–3 days. On the day of harvest, transduced CAR-T cells were isolated from the population using anti-PE microbeads (Miltenyi) following the manufactures’ in-struction. Briefly, cells were incubated with a PE conju-gated antibody specific for CARs on cell surface, followed by a second incubation with anti-PE microbeads. After wash, the cell-beads mixture was passed through a LS (Miltenyi) column in a MACS separator. Following an-other wash step, the CAR positive fraction was collected by plunging out the column-retaining cells and cryopre-served. The collected cells were analyzed using flow cytometry to confirm that >90% of the cells were CAR+. Before any assay, cryopreserved CAR-T cells were thawed and cultured overnight at a concentration of 1 × 10⁶cells/ mL in X-VIVO 15 media. Immediately prior to use, dead cells were removed from culture using a Dead Cell Re-moval Kit (Miltenyi) and LS Magnetic Column (Miltenyi).
Conjugation of Dynabeads for stimulation
The tosylactivated M-450 Dynabeads (Invitrogen) were conjugated with a CAR specific antibody following the manufacturers’ instructions. In short, 4E8 beads were incubated with 200 μg antibodies for 24 h. After exten-sive wash, the beads were aliquoted and stored at 4 °C until use. Beads conjugated with non-specific IgG were generated as the same time and used as negative control.
CAR-T cell population assays
plate was incubated with samples, antibody conjugate, substrate solution and stop solutions in sequential order. The plate was read using a SpectraMax M5 plate reader (Molecular Device). The multiplexing population assay was performed using a custom PDMS device. A custom 12-hole PDMS microwell slab (each hole at D = 1 cm) was placed on top of a 16-plex antibody barcode slide to form a multiplexing 12-well assay device. The two components were tightly clamped with screws using a custom polycarbonate plate clamping system. 50 μL of cell culture supernatant was added to each well and incubated for 1 h. Following incubation, the wells were washed 3 times with 1% BSA/PBS and then incubated with 50μL of detection antibody cocktail (1:200 dilution in 1% BSA/PBS, Additional file 1) for 1 h. The wells were then washed again 3 times with 1% BSA/PBS and incubated with 50μL of APC streptavidin (1:100 dilution in 1% BSA/PBS, BioLegend) solution for 30 min. After washing 5 times with 1% BSA/PBS, the slide was removed from the clamp. The slide was washed in a Coplin jar for 3 min at 125 rpm sequentially using PBS, 50% PBS/DI water, DI water, DI water sequentially. The slide was then dried for 30 s in a Labnet slide spinner (C1303-T), scanned with a GenePix 4400A micro-array scanner and analyzed using IsoPlexis’ propri-etary IsoSpeak software.
Preparation of cell suspension for SCBC assay
The healthy CD8 T cells from healthy PBMCs were sus-pended at a density of 1.25 × 10⁶/mL in fresh complete X-VIVO 15 media with the addition of PMA (50 ng/mL) and Ionomycin (1 μg/mL). CD19 CAR-T cells (1 × 10⁶ cells/mL) were mixed with beads at a 1:4 ratio. The mix-ture was plated into a single well of a 96-well plate and incubated at 37 °C for 6 h. Stimulated cells were then collected and incubated with anti-human CD4 RPE antibody (1:100 dilution, Thermo Fisher) and anti-human CD8a Alexa Fluor 647 antibody (1:100 dilution, BioLegend) at room temperature for 10 min. The cells were then spun at 300 g for 10 min and re-suspended in fresh media at a density of 1.25 × 10⁶cells/mL.
SCBC assay
The PDMS microchamber array was plasma treated for 2.5 min with a Plasma Etch PE-25 plasma cleaner and blocked in 3% BSA/PBS for 30 min. Immediately before the assay, the PDMS chamber was rinsed with media and blown dry using compressed air. It was then placed on a glass slide and secured into a custom clamping system. 30 μL of cell suspension was pipetted onto the microchamber array chip. The antibody barcode slide was put on top of the microchamber PDMS with the antibody side facing down. The whole system was clamped tightly in a custom clamping system. The system
was imaged immediately as described in Microchamber array imaging.Post imaging, the microchamber assembly was placed in a standard 5% CO2, incubator at 37 °C for
16 h. Following incubation, the microchamber system was dissembled in a 1% BSA/PBS bath and the antibody slide was removed and rinsed with 1% BSA/PBS. The slide was then incubated with 300 μL detection antibody cocktail (Additional file 1) for 45 min. Each detection antibody is at a concentration of 0.25μg/mL in 1% BSA/PBS solution. Following this step, the barcode slide was rinsed with 1% BSA/PBS and incubated with 300 μL APC streptavidin solution (1:100 dilution in 1% BSA/PBS, BioLegend) for 30 min. The slide was rinsed with 1% BSA/PBS again and then washed in Coplin jars sequentially using PBS, 50% PBS/DI water, DI water, DI water for 3 min at 125 rpm. The slides were dried for 30 s in a Labnet slide spinner (C1303-T) and scanned using a GenePix microarray scan-ner as described inAntibody barcode slide imaging.
Microchamber array imaging
The assembled microchamber system was imaged using a Zeiss Axio Observer.Z1 fluorescent microscope with a Hamamatsu Orca-Flash4.0 LT Digital CMOS camera (C11440-42 U) and an automatic stage. For each micro-chamber array, bright field images were taken to visualize the microchambers and fluorescent images were taken to visualize cells labeled with CD4 or CD8 antibodies. A set of 253 tiles (5X image) or 494 tiles (10X image) was taken for the entire array (54183uM x 24866uM). Using Zen2 Pro software, the tiles were exported as TIFF image files for analysis.
Antibody barcode slide imaging
A GenePix 4400A scanner (Molecular Devices) was used to scan the antibody barcode slides. Each slide was scanned using a GenePix Pro software (Molecular Devices) at two color channels, 488 (blue, PMT 350, Power 90) and 635 (red, PMT 600, Power 90). The image was then exported as a TIFF file for analysis.
Image processing and data analysis
images and feature detection in the brightfield image. Cell subsets (CD4/CD8) were further determined based on immunofluorescence. User verification was per-formed on a small subset (normally around 2–3% of the whole array) to validate the automatic results. The soft-ware analyzed the antibody barcode image to determine the location of each antibody lane, using Hough trans-forms and subsequent interpolation. The raw intensity value of each cytokine readout from each single-cell was extracted from the image region where the single cell microchamber overlaps the cytokine’s corresponding antibody lane. Zero-cell microchambers and their associ-ated protein signals were used to assess cytokine-specific background. A background threshold was computed per cytokine, defined as three standard deviations above the average zero-cell signal intensity. Signals with a signal-to-noise ratio (SNR) of at least 2 (relative to the back-ground threshold) were considered as true protein signals. If at least 20 single cells or 2% of all single cells (whichever quantity was larger) showed true protein signal for one specific cytokine, this cytokine was labeled as significantly secreted by the sample. Knowing the secretion profile of each single-cell, the frequency of all polyfunctional groups present in the sample were identi-fied. From these frequencies and the background-subtracted signal intensities, the polyfunctional strength of the sample, and the percent contribution from each cytokine group was found. PAT PCA transformations were performed as outlined in Additional file 2: Figure S3. All visualizations were automatically generated in Iso-Speak from the above data.
Results
Study design - highly multiplexed measurement of cytokine secretions from single CD19 CAR-T cells upon antigen-specific stimulation
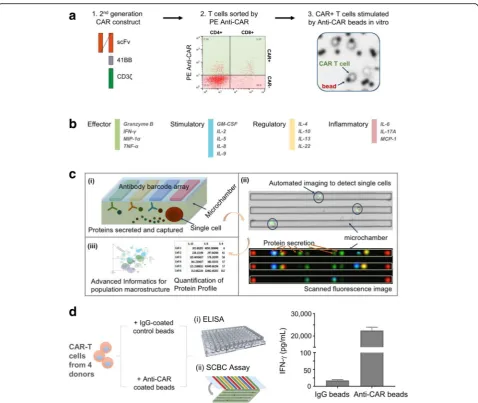
To capture the full spectrum of complex T cell functions within the heterogeneous CAR-T population, we ana-lyzed CAR-T cytokine production at the single cell level using a 16-plex panel. The 16-plex cytokine assay panel includes the key immune functions of T cells (e.g. ef-fector, stimulatory, regulatory and inflammatory) (Fig. 1b & Additional file 3) and has been validated at both a population level and a single-cell level (Additional files 4 and 5). CAR-T cells generated from 4 different healthy donors were analyzed for cytokine secretion at the single cell level. The enriched CAR+ T cells were stimulated with anti-CAR beads or control IgG beads, stained with anti-CD4-PE and anti-CD8-AF647 and loaded into SCBC microchips for single cell cytokine analysis (Fig. 1a). Each of SCBC microchip device is comprised of a polydimethyl siloxane (PDMS) microchamber layer and a glass slide (see schematic in Fig. 1c(i)). The supporting glass slide is surface patterned with a miniaturized 16-element
antibody microarray (Fig. 1c). The design of the SCBC permits optical microscopy inspection of the individual microchambers (Fig. 1c(ii)), including number of cells in each well and the cellular phenotypes (e.g., CD4+, CD8+, etc.) based on surface marker staining. The fluorescence based cytokine data is merged with the microscopy im-aging data to generate the final data set. The number of cells, the cell phenotype and the cytokine production are therefore specified for each microchamber. We further adopted and/or developed advanced informatics tools (in IsoPlexis’IsoSpeak software package) for not only statis-tical analysis of SCBC data sets but also the dissection of functional subsets (Fig. 1c(iii)). To evaluate the specificity of anti-CAR bead stimulation, CAR-T cells were stimu-lated with anti-CAR or IgG control beads in wells of 96-well plate for 24 h and the supernatant was analyzed by ELISA. Anti-CAR stimulation showed approximately 1000-fold increase of IFN-γ compared to control IgG beads stimulation (Fig. 1d), indicating the good specificity of in vitro anti-CAR bead stimulation. In addition, the increased cytokine secretion levels in CD19 CAR-T cells upon anti-CAR bead stimulation were observed across 4 donors compared to IgG control bead stimulation at a single-cell level, further demonstrating the stimulation specificity (Additional files 3 & 6).
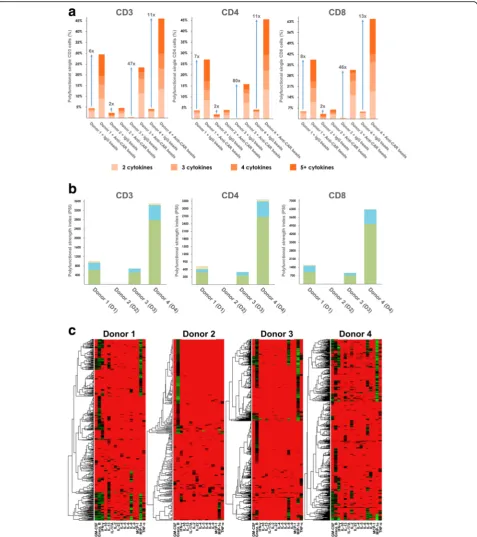
Increased polyfunctional heterogeneity of activated CD19 CAR-T cells dominated by an effector cytokine profile upon anti-CAR bead stimulation
in Fig. 2b further revealed inter-donor heterogeneity of polyfunctional CAR-T cells. While effector and stimulatory cytokines contribute the most to poly-functionality across all 4 donors, a small portion of regulatory and inflammatory cytokines were observed in donor 1 and donor 4. Furthermore, the observed regulatory and inflammatory response was mainly from the CD4+ T cells, consistent with the notion that both regulatory and helper T cells are subsets of CD4+ T cells, further proving the specificity of the
SCBC assay. The donor-to-donor variability in poly-functionality could be caused by a population-level shift of cytokine profiles, or the alteration of specific polyfunctional subpopulations. To better understand this variation, we first sought to use a conventional heatmap to visualize cytokine production from all sin-gle cells across four donors. The heat map data visualization in Fig. 2c gives a high-level indication that the analyzed single CAR-T cells exhibit signifi-cant differences in the combinations and intensities
(red = low, green = high) of secreted proteins. How-ever, it remains difficult to clearly visualize many functional subsets from heterogeneous CAR-T cells across donors.
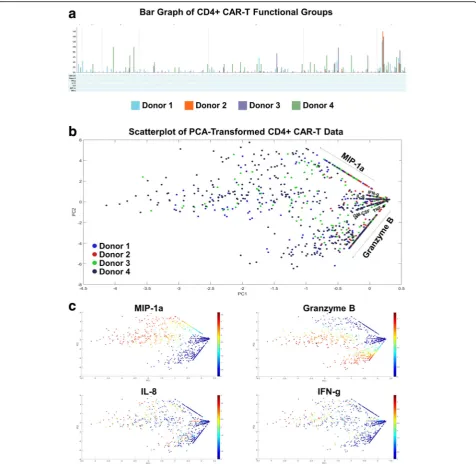
Limitations of conventional PCA and other standard visualizations in dissecting high-dimensional, single-cell, proteomic data of CAR-T cells
We further explore other standard bioinformatics tools in visualizing this high-dimensional data set. In this standard bar graph visualization of the functional groups secreted by the four donors’CD4+ CAR-T cells (Fig. 3a), the dimensionality of the data makes it cumbersome to see which are the major functional groups being secreted by each donor, as well as the largest fold differences across donors. An alternative approach to visualizing high-dimensional datasets is to first reduce the dimen-sionality of the data, while retaining as much of the original information as possible. PCA (principal compo-nent analysis) is a common dimensionality reduction technique which uses an orthogonal transformation to convert the original dataset of possibly correlated variables into a set of linearly uncorrelated principal components, where the number of components is smaller than the number of original variables. The trans-formation is defined in such a way that the first principal component has the largest possible variance (accounting for as much variability as possible within the dataset), followed by the second component, and so on. While reducing the dimensionality to two principal compo-nents may still result in some loss of information, the benefit is that the transformed data points can then be visualized on a two-dimensional scatterplot. Addition-ally, key differences within the transformed data should be magnified through this transformation. Figs. 3b-c dis-plays the results of applying PCA to the 4-donor CD4+ CAR-T secretion dataset. Each cell’s secretions (signal intensity of each cytokine) are log transformed prior to dimensionality reduction. Fig. 3b shows a scatter-plot of the transformed data color-coded by donor, while Fig. 3c shows the same data color-coded by some of the individual cytokines. The combination of these graphs does reveal additional information about donor response differences and expressed polyfunc-tional subsets, such as the lower overall polyfunction-ality of donor 2, or the higher Granzyme B + MIP-1α + polyfunctionality of donor 1. A similar pattern of cytokine secretions was seen in the CD8+ CAR-T cells of all 4 donors (Additional file 7). However, two key issues still exist with this visualization: (1) it is difficult to infer which high-dimensional cytokine sub-sets are driving the polyfunctionality of each sample, and (2) it is unclear what are the more granular poly-functional differences across the analyzed donor
samples. Other methods such as viSNE (Additional file 8) that map high-dimensional cytometry data onto two dimensions, yet conserve the high-dimensional structure of the data, improve the ability to distin-guish cell subpopulations [28, 29]. However, the poly-functional breakdown of the samples remains unclear when this visualization is used. In the context of polyfunctional T cell analysis, the routine practice has been to manually enumerate the major polyfunctional subsets by quantifying the cell count in each of the possible cytokine combinations, which serves well the ability to distinguish polyfunctional T cell subsets but loses the relationship between subsets or the hier-archical structure of the population. We hereby propose two alternative visualizations, polyfunctional heat map and polyfunctional activated topology prin-cipal component analysis (PAT PCA) which in tan-dem work to solve these problems.
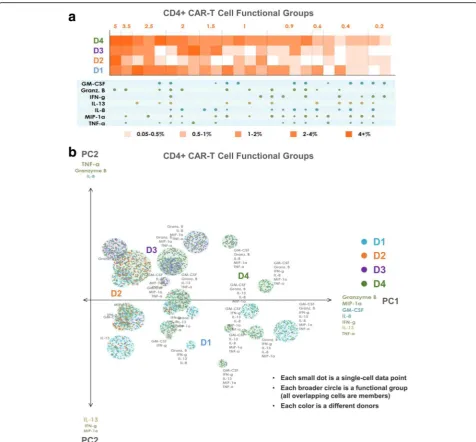
Polyfunctional heat map to highlight distinct polyfunctional T cell subsets and the heterogeneity within a cell population
CARs of donors 1 and 4, but not by the CARs of donor 2 or donor 3. Similarly, the 7-plex group containing GM-CSF, Granzyme B, IFN-γ, IL-8, IL-13, MIP-1α, and TNF-α is
unique to these two donors, revealing functional differences of these CAR cells relative to those of donors 2 and 3 at a high degree of granularity. Functional groups not containing
GM-CSF or IL-13 are expressed at similar frequencies by donor 3 as they are by donors 1 and 4. As seen in Fig. 5a, the CD8+ CAR cells similarly show donors 1 and 4 to be
significantly more polyfunctional than donors 2 and 3, and also uniquely secrete the 7-plex group containing GM-CSF, Granzyme B, IFN-γ, IL-8, IL-13, MIP-1α, and TNF-α. Donor
1 has a higher number of unique polyfunctional groups than donor 4, particularly groups not containing IL-8. The only polyfunctional groups secreted by all four donors contain Granzyme B, MIP-1αwith smaller amounts of IFN-γ.
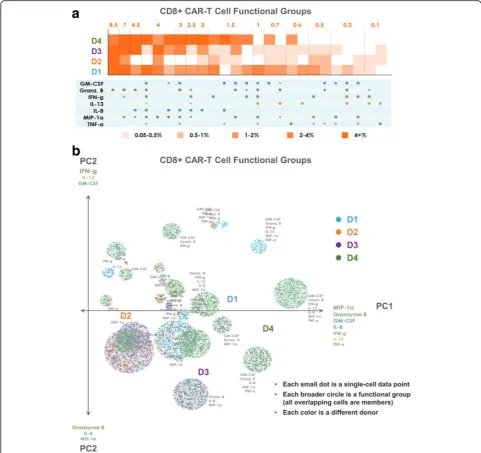
PAT PCA to further visualize distinct polyfunctional T cell subsets and a complex landscape of CD19-specific immune response
In addition to the heat map visualization, we propose a modified PCA visualization named PAT PCA illustrated in Additional file 2. We use this visualization to help reveal a complex landscape of polyfunctional subsets of CAR-T cells in response to antigen-specific stimulation across donors. Figs. 4b and 5b show PAT PCA visualiza-tions of the same single-cell-resolution CD4+/CD8+ CAR results as the heat maps in Figs. 4a and 5a, respect-ively. Similarly for the hierarchical clustering input, we apply PCA on a binarized dataset (0 = no secretion, 1 = secretion), to focus on visualizing combinatorial differences, rather than intensity differences. In the resulting scatterplot visualization, each color-coded dot represented a single-cell from one of the four donors, respectively, in which the larger color-coded circles rep-resented a unique polyfunctional subset. The colors of the subsets identified the sample where this subset was most frequent (i.e., largest as a percentage of the sample). The functional groups (columns) in the heat map are represented by a circle in the corresponding PAT PCA graph. The size of the circles corresponds to the frequency of the group; the number of cells (dots) within each group indicates how frequently the sample of the corresponding color secreted the group. The makeup of the two principal components PC1 and PC2 is indicated by the listed cytokines, with the composition of PC1 indicating the main drivers of polyfunctionality. In both graphs, PC1 is a combination of the seven dominant secretors of the anti-CAR stimulated cells: effector cytokines Granzyme B, MIP-1α, IFN-γ, and TNF-α; stimulatory cytokines GM-CSF and IL-8; and the regulatory cytokine IL-13. As a result, the highly-polyfunctional groups are farther along (on the right-side of ) this axis. PC2 differed between CD4 and CD8 cells. In the CD4 case, groups towards the top tend to have more Granzyme B, IL-8 and TNF-α, while groups near the bottom more often contain IL-13, IFN-γ and MIP-1α. In the CD8 case, groups near the top more commonly secreted IFN-γ, IL-13 and GM-CSF, while groups near the bottom more com-monly secreted Granzyme B, IL-8 and MIP-1α. Plotting the polyfunctional subsets in such a manner allows overall similarities and differences in the donor profiles to emerge. The lack of donor 2 (orange) subsets indicated the lower polyfunctionality of this sample, while the presence of numerous donor 1
(blue) and donor 4 (green) groups in the right area of the graph indicated the highly-polyfunctional makeup of these two samples. Donor 3 has fewer polyfunc-tional subsets mostly comprised of combinations of Granzyme B, MIP-1α, IL-8, and TNF-α but lacking IFN-γ, IL-13, and in the case of CD4+ cells, GM-CSF. Donor 4 largely spans the polyfunctional profiles of both donors 1 and 3, which can also be seen in the heat maps. Capturing the full polyfunctional landscape of each sample is critical to effectively analyzing this data, as well as identifying the major subsets contrib-uting to differences between samples/donors. The presented polyfunctional heat map and PAT PCA graphs are effective at achieving these objectives, both individually and together, and provide the first land-scape of effector function phenotypes of CD19 CAR-T cells in response to antigen-specific challenge.
Discussion
were further analyzed and visualized using newly developed bioinformatics tools, polyfunctional heat map and PAT PCA (Figs. 4 and 5). All together, we demonstrated that the SCBC platform represents a new platform that enables a comprehensive profiling of CAR-T cell cytokine/chemokine production and supports correlative analysis for biomarker discovery in pre-infusion CAR-T products.
Initial evidence suggests that polyfunctional CAR-T cells may serve as a useful biomarker for efficacy. Dynamic polyfunctionality analysis of adoptively transferred MART-1-specific TCR-engineered T cells showed that
TNF-α+IFN-γ+ polyfunctional T cell delayed tumor relapse [27]. Furthermore, a study comparing in vitro functions of CD19 CAR-T cells generated from different CAR struc-tures showed that polyfunctionality rather than cytotoxicity of the CAR-T cells was a better predictor of therapy effi-cacy in vivo [32]. The observation that persisting CAR-T cells in CLL complete responders remain polyfunctional 4 years after infusion suggests an association between poly-functional CAR-T cells with persisting response [9]. The significance of T cell polyfunctionality in product characterization as well as clinical biomarkers led us to bring this metric to the forefront of our data analysis and visualizations. We first quantitated the level of polyfunc-tionality using PSI analysis which results in a polyfunction-ality score for each donor (Fig. 2a and b). Overall, an increase in polyfunctionality of CAR-T cells in response to anti-CAR bead stimulation was observed in all four donors, with significant donor-to-donor heterogeneity (Fig. 2). CAR-T cells from donors 1 and 4 have the highest poly-functionality, whereas CAR-T cells from donor 2 have the least. The polyfunctionality was predominated by effector cytokine profiles, which is consistent with the high potency observed with CD19 CAR in previous clinical trials.
We then sought to breakdown the unique combinations of cytokine subsets secreted by a sample. The further analysis requires bioinformatics tools as the number of pos-sible subsets can increase by up to a factor of 2nwith the addition of n cytokines. On top of this, when analyzing differences across a set of donors or stimulation conditions, effectively highlighting the key polyfunctional differences is challenging. Previously developed single cell analysis bio-informatics tools, however, do not fit the purpose of poly-functional analysis, especially for the comparison between multiple donors [29, 33]. For example, conventional heatmap can indicate heterogeneity among single cells within one donor at a high level, but it cannot map functional subsets of different samples in the same space, therefore making multi-donor comparison very difficult (Fig. 2c). While conventional PCA and viSNE can map multiple donors in the same space, neither can identify polyfunctional subsets that drive the dif-ferentiations between donors at a high level of granularity (Fig. 3 and Additional file 8). To address this need, we devel-oped two informatics visualization tools, namely a
polyfunctional heat map and a PAT PCA scatterplot visualization, which are able to capture the full landscape of complex polyfunctional subsets within each donor, and iden-tify major subsets that are different between donors and the driving factors for these differences. For example, tional heatmap showed while all four donors have polyfunc-tional subsets secreting Granzyme B, MIP-1α and IFN-γ, only donor 1 and donor 4 have a highly polyfunctional sub-sets secreting GM-CSF, Granzyme B, IFN-γ, IL-8, IL-13, MIP-1α and TNF-α. PAT PCA visualization further reveals that the polyfunctional subsets of donor 3 are driven mainly by IL-8, Granzyme B, TNF-α (CD4) and MIP-1α (CD8) whereas those of donor 1 typically include IFN-γand IL-13. Overall, we saw a convincing increase in the clarity of poly-functional heatmaps and PAT PCA over other state of the art visualizations, demonstrating the overarching importance of developing visualizations that highlight polyfunctionality in sample characterization and differentiation. As with all novel, high dimensional data, one key challenge is how to ef-fectively use the data. Future studies will explore other extensions and optimizations to the presented polyfunction-ality visualizations with larger datasets.
The presented single cell analysis platform is spun out from previous academic prototype with rigid validations and significant upgrades [18]. The current data acquisition and analysis platform features: (1) measurements of true protein secretion from single cells residing in a nanowell, representing a more physiological environment than any other available single cell technology. (2) an automated ac-quisition process with data integrity and minimal user interference, and (3) an integrated bioinformatics suite for understanding and highlighting key differences in donor response (Fig. 1). The readout of the assay is fluoresce in-tensity of accumulated cytokines over the 16 h incubation time. Protein concentrations may be inferred using recom-binant protein standard curves that generated on a separ-ate or same chip [34]. Temporal protein secretions of single cells for time-point study can be measured by ana-lyzing a serial of chips. So far, the platform has been ap-plied on a broad range of studies, including cytokine paracrine signaling analysis, malignant cell characterization and vaccine evaluation in infectious disease [34–36]. Here, we extended the application to CAR-T analysis, demon-strating its capability to comprehensively characterize CAR-T cell pre-infusion products. Future studies on patient sample analysis, in combination with correlative studies with clinical responses will likely provide meaning-ful data for biomarker identification.
clinical responses. To alleviate the confounding effect of tumor cell variations across patients, a future experiment is to include single CAR-T cells with autologous tumor cells in the same microchamber to evaluate patient-specific CAR-T response. In fact, the presented SCBC system has been previously applied to the study of cell-cell interactions by including multiple cells in one microchamber [37, 38]. The fact that only a small number of cells (~ 1 × 10⁴ cells) are required for setting up one SCBC chip makes the presented technology especially suitable for CAR-T autologous tumor response studies. In addition, nanowell-based single cell technologies have been previously used to study cytotoxicity of single NK cell or CAR-T cell in response to target cells [39, 40]. By incorporating cell viability staining and mi-croscopy imaging, a single cell autologous cytotoxicity assay can be built into the SCBC system, enabling simultaneously measurement of cytotoxicity and cyto-kine/chemokine production from one single cell.
Conclusions
We have demonstrated how single-cell multiplexed proteomics is able to comprehensively characterize CD19 CAR-T cell product cytokine/chemokine profiles. Our single-cell analysis has, for the first time, revealed the multifunctional heterogeneity of CD19 CAR-T cell products by antigen-specific stimulation. Through the SCBC, we measured CAR-T cell secretion profiles across a panel of 16 key immune functions, and noted clear distinctions in the range of single-cell responses across each of four donors. We additionally developed new polyfunctional heat map and PAT PCA visualizations to deconvolute single-cell-level differences across donor responses, and to provide an in-depth understanding of the polyfunctional subsets driving each donor’s re-sponses. Although the result presented here are based on CAR-T cells from healthy donor materials, it illus-trates the necessity and provide a possible blueprint for guiding CAR-T product pre-infusion assessment. The ability to precisely dissect single-cell, polyfunctional heterogeneity supports a road map for correlative discoveries on the role of polyfunctional CAR-T cells in clinical responses and has the potential to greatly impact CAR-T therapy optimization.
Additional files
Additional file 1: Table S1.16-Plex SCBC Antibody Panel. (PDF 2103 kb)
Additional file 2: Figure S3.Overview of data transformations for PAT PCA. A: An illustrative example showing how raw single-cell data (signal intensities) from a single-cell multiplex cytokine assay are transformed. The polyfunctional group of each cell is found along with unique groups (encoded by a vector of 0 s and 1 s) and their frequencies. An adjusted frequency n, weighted by poly-functionality, is computed per group. Each vector is included n times and this resulting dataset is transformed using PCA. (PDF 2103 kb)
Additional file 3: Figure S1.CAR-specific stimulation induces multiple cytokine production at the single-cell level. Cytokine secretions of total CD3 T cells, CD4 T cells and CD8 T cells, all stimulated by anti-CAR beads, are shown across 4 donors and compared to the control secretion profile. The analyzed 16-plex panel includes 4 color-coded groups of cytokines: effector (green), stimulatory (blue), regulatory (yellow) and inflammatory (red). Low secretion percentages, as well as secretions with an average signal noise ratio (SNR) < 2 are labeled not significant (gray). (PDF 2103 kb)
Additional file 4: Figure S6.Validation of the antibodies in the 16-plex single-cell panel. (A) standard RFU/protein curve for the 16-plex panel. Antibody pairs from multiple manufacturers were tested for sensitivity with recombinant protein by titrating recombinant protein cocktails (5, 15.8, 50, 158, 500, 1580 and 5000 pg/mL) to produce a standard RFU/protein curve. (B) Antibody pairs were tested for specificity by spiking 1000 pg/mL protein standards for each antibody on the panel. Antibody pairs were then evaluated for cross reactivity within the panel. Antibodies were considered specific when the antibody pair had an SNR >10. (PDF 2103 kb)
Additional file 5: Figure S7. Validation of the 16-plex cytokine panel on the SCBC platform. (A) A representative signal distribution of Granzyme B,
IFN-γand TNF-αfrom single CD8 T cells at the SCBC platform. (B) A representative ICS data of IFN-γand TNF-αsecreting CD8 T cells. (C) A pooled comparison data of IFN-γand TNF-αsecreting CD8 T cells between SCBC and ICS. (D) The correlation of 16 protein secretion levels between single-cell averages from two independent experiments (x, y axes: % of cytokine-secreting single CD8 T cells). (E) A representative scatter plots of Granzyme B and IL-8 from individual experiments. (PDF 3044 kb)
Additional file 6: Figure S2.The level of cytokine secretion from single cells and populations upon anti-CAR bead stimulation of CD19 CAR-T cells. At both the single-cell level and bulk-level, an overall increase in the intensity of effector and stimulatory cytokine secretions was observed with anti-CAR bead stimulation (orange) compared to control IgG bead stimulation (blue). While bulk-level measurements only show an average intensity per cytokine of the entire cell sample, single-cell level measurements present a full distribution of cell-by-cell secretion intensities. Levels of upregulation are consistent between the bulk-level measurement and single-cell level measurement across donors, with donor 2 having very small increases compared to the other three donors at both levels. (PDF 2103 kb)
Additional file 7: Figure S4.Higher dimensional data is difficult to visualize concisely. (A) In this standard bar graph visualization of functional groups secreted by CD4+ CAR-T cells of four donors, it is cumbersome to see which are the major functional groups being secreted by each donor, and what are the biggest fold differences across donors. (B-C) Reducing the dimensionality of the dataset is a different approach to more effective and understandable visualizations. In this figure, PCA is applied to the 4-donor CAR-T secretion dataset. Each cell’s secretions (signal intensity of each cytokine) are log transformed prior to dimensionality reduction. (B) is color-coded by donor, while (C) is color-coded by some of the individual cytokines. The combination of these graphs reveals some information, such as the low overall polyfunctionality of donor 2, and the high Granzyme B+MIP-1a+ polyfunctionality of Donor 4. However, more detailed information about upregulated and/or distinct polyfunctional subsets is less clear. (PDF 2103 kb)
Additional file 8: Figure S5.viSNE visualization of CD4+ CAR-T data. viSNE is a visualization tool designed to map high-dimensional flow cytometry data onto two dimensions, while preserving the overall structure of the data. Similar to PCA, color can be used as a third dimension in the resulting visualization. In this figure, color is used to indicate (A) the donor sample of each single CD4+ CAR-T cell or (B) the intensity of individual cytokine secretions of each CD4+ CAR-T cell. Unlike PCA, which is a linear trans-formation, the benefit of visNE is its ability to preserve non-linear relationships across the data. One can infer that a subset of cells in each donor secrete only Granzyme B, that primarily donors 3 and 4 have cells secreting only TNF-a, and that donors 1 and 4 both have unique subsets of highly polyfunctional, Granzyme B + MIP-1a + IFN-g + secreting cells. However, additional donor differences and specific information about functional groups is fairly limited. A viSNE transform-ation of the CD8+ CAR-T data gives a similar graph. (PDF 2866 kb)
Abbreviations
DLBCL: Diffuse large B-cell lymphoma; ICS-FC: Intracellular staining flow cytometry; PAT PCA: Polyfunctional activation topology principal component analysis; PBMC: Peripheral blood mononuclear cell; PDMS: Polydimethyl siloxane; PSI: Polyfunctional strength index; SCBC: Single-cell barcode chip
Acknowledgements Not applicable.
Funding Not applicable.
Availability of data and materials
The data presented in this study is available upon reasonable request to the corresponding authors.
Authors’contributions
QX, OK, MFQ manufactured CD19 T cells; QX, EB, TM, JZ performed CAR-T cell culture, SCBC, flow cytemotry and ELISA experiemnts; CN, AK perpared and validated the 16-plex cytokine panel slides; QX, EB, SM, MED, SHK, JZ de-signed the project and experiments; QX, EB, PP, CB, AK, TM, JH, RF, SM, SHK, JZ analzyed the data and prepared figures. All authors read and approved the final manuscript.
Ethics approval and consent to participate
Peripheral blood mononuclear cells were obtained from HemaCare from consented healthy donors.
Consent for publication Not applicable.
Competing interests
J.R.H. & R.F are board members of IsoPlexis, which is a company seeking to commercialize the SCBC technology. Q.X., O.K., M.F.Q. are current employees of Novartis and have competing interests with Novartis. M.E.D., S.H.K. are former employees of Novartis. E.B., P.P., C.N., A.K., T.M., S.M., J.Z are employees of IsoPlexis and have competing interests with IsoPlexis.
Publisher’s Note
Springer Nature remains neutral with regard to jurisdictional claims in published maps and institutional affiliations.
Author details
1Novartis Pharmaceuticals, 64 Sidney Street, Cambridge, MA 02139, USA. 2
IsoPlexis Corporation, 35 NE Industrial Rd, Branford, CT 06405, USA.
3NanoSystems Biology Cancer Center, Division of Chemistry, California
Institute of Technology, Pasadena, CA 91125, USA.4Department of
Biomedical Engineering, Yale University, New Haven, CT 06520, USA.5Present
Address: Novartis Institute of BioMedical Research, 300 Technology Square, Cambridge, MA 02139, USA.6Present Address: Novartis Institute of
BioMedical Research, 64 Sidney street, Cambridge, MA 02139, USA.7Present
Address: Novartis Pharmaceuticals, 45 Sidney Street, Cambridge, MA 02139, USA.8Present Address: Adaptimmune, 351 Rouse Blvd, Philadelphia, PA 19112, USA.9Present Address: Mustang Bio, 95 Sawyer Road, Waltham, MA
02453, USA.
Received: 31 July 2017 Accepted: 16 October 2017
References
1. Restifo NP, Dudley ME, Rosenberg SA. Adoptive immunotherapy for cancer: harnessing the T cell response. Nat Rev Immunol. 2012;12:269–81. 2. June CH, et al. Engineered T cells for cancer therapy. Cancer Immunol
Immunother. 2014;63:969–75.
3. Grupp SA, et al. Chimeric antigen receptor-modified T cells for acute lymphoid leukemia. N Engl J Med. 2013;368:1509–18.
4. Kochenderfer JN, et al. Chemotherapy-refractory diffuse large B-cell lymphoma and indolent B-cell malignancies can be effectively treated with autologous T cells expressing an anti-CD19 chimeric antigen receptor. J Clin Oncol. 2015;33:540–9.
5. Lee DW, et al. T cells expressing CD19 chimeric antigen receptors for acute lymphoblastic leukaemia in children and young adults: a phase 1 dose-escalation trial. Lancet. 2015;385:517–28.
6. Davila ML, et al. Efficacy and toxicity management of 19-28z CAR T cell therapy in B cell acute lymphoblastic leukemia. Sci Transl Med. 2014;6:224ra225. 7. Brentjens RJ, et al. CD19-targeted T cells rapidly induce molecular
remissions in adults with chemotherapy-refractory acute lymphoblastic leukemia. Sci Transl Med. 2013;5:177ra138.
8. Maude SL, et al. Chimeric antigen receptor T cells for sustained remissions in leukemia. N Engl J Med. 2014;371:1507–17.
9. Porter DL, et al. Chimeric antigen receptor T cells persist and induce sustained remissions in relapsed refractory chronic lymphocytic leukemia. Sci Transl Med. 2015;7:303ra139.
10. Zhang T, et al. Efficiency of CD19 chimeric antigen receptor-modified T cells for treatment of B cell malignancies in phase I clinical trials: a meta-analysis. Oncotarget. 2015;6:33961–71.
11. Wang X, Riviere I. Clinical manufacturing of CAR T cells: foundation of a promising therapy. Mol Ther Oncolytics. 2016;3:16015.
12. Brudno JN, Kochenderfer JN. Toxicities of chimeric antigen receptor T cells: recognition and management. Blood. 2016;127:3321–30.
13. Almeida JR, et al. Superior control of HIV-1 replication by CD8+ T cells is reflected by their avidity, polyfunctionality, and clonal turnover. J Exp Med. 2007;204:2473–85.
14. Seder RA, Darrah PA, Roederer M. T-cell quality in memory and protection: implications for vaccine design. Nat Rev Immunol. 2008;8:247–58. 15. Ahmadzadeh M, et al. Tumor antigen-specific CD8 T cells infiltrating the
tumor express high levels of PD-1 and are functionally impaired. Blood. 2009;114:1537–44.
16. Baitsch L, et al. Exhaustion of tumor-specific CD8(+) T cells in metastases from melanoma patients. J Clin Invest. 2011;121:2350–60.
17. Lovelace P, Maecker HT. Multiparameter intracellular cytokine staining. Methods Mol Biol. 2011;699:165–78.
18. Lu Y, et al. Highly multiplexed profiling of single-cell effector functions reveals deep functional heterogeneity in response to pathogenic ligands. Proc Natl Acad Sci U S A. 2015;112:E607–15.
19. Milone MC, et al. Chimeric receptors containing CD137 signal transduction domains mediate enhanced survival of T cells and increased antileukemic efficacy in vivo. Mol Ther. 2009;17:1453–64.
20. Porter DL, Levine BL, Kalos M, Bagg A, June CH. Chimeric antigen receptor-modified T cells in chronic lymphoid leukemia. N Engl J Med. 2011;365:725–33. 21. Laport GG, et al. Adoptive transfer of costimulated T cells induces
lymphocytosis in patients with relapsed/refractory non-Hodgkin lymphoma following CD34+−selected hematopoietic cell transplantation. Blood. 2003; 102:2004–13.
22. Levine BL, et al. Adoptive transfer of costimulated CD4+ T cells induces expansion of peripheral T cells and decreased CCR5 expression in HIV infection. Nat Med. 2002;8:47–53.
23. Levine BL, et al. Gene transfer in humans using a conditionally replicating lentiviral vector. Proc Natl Acad Sci U S A. 2006;103:17372–7.
24. Samri A, et al. Polyfunctional HIV-specific T cells in post-treatment controllers. AIDS. 2016;30:2299–302.
25. Snyder LD, et al. Polyfunctional T-cell signatures to predict protection from cytomegalovirus after lung transplantation. Am J Respir Crit Care Med. 2016;193:78–85.
26. Franzese O, et al. Polyfunctional Melan-A-specific tumor-reactive CD8(+) T cells elicited by dacarbazine treatment before peptide-vaccination depends on AKT activation sustained by ICOS. Oncoimmunology. 2016;5:e1114203. 27. Ma C, et al. Multifunctional T-cell analyses to study response and
progression in adoptive cell transfer immunotherapy. Cancer Discov. 2013;3:418–29.
28. DiGiuseppe JA, Tadmor MD, Pe'er D. Detection of minimal residual disease in B lymphoblastic leukemia using viSNE. Cytometry B Clin Cytom. 2015;88:294–304. 29. Amir EA, Davis KL, et al. viSNE enables visualization of high dimensional
single-cell data and reveals phenotypic heterogeneity of leukemia. Nat Biotechnol. 2013;31:545–52.
30. Kassim SH. Toward an integrated model of product characterization for CAR-T cell therapy drug development efforts. Cell Gene Therapy Insights. 2017;3:227–37.
32. Long. A.H., et al.4-1BB costimulation ameliorates T cell exhaustion induced by tonic signaling of chimeric antigen receptors. Nat Med. 2015;21:581–90. 33. Anchang B, et al. Visualization and cellular hierarchy inference of single-cell
data using SPADE. Nat Protoc. 2016;11:1264–79.
34. Xue Q, et al. Analysis of single-cell cytokine secretion reveals a role for paracrine signaling in coordinating macrophage responses to TLR4 stimulation. Sci Signal. 2015;8:ra59.
35. Zhou J, et al. CD8+ T-cell mediated anti-malaria protection induced by malaria vaccines; assessment of hepatic CD8+ T cells by SCBC assay. Hum Vaccin Immunother. 2017;13:1625–9.
36. Kleppe M, et al. JAK-STAT pathway activation in malignant and nonmalignant cells contributes to MPN pathogenesis and therapeutic response. Cancer Discov. 2015;5:316–31.
37. Kravchenko-Balasha N, Wang J, Remacle F, Levine RD, Heath JR. Glioblastoma cellular architectures are predicted through the characterization of two-cell interactions. Proc Natl Acad Sci U S A. 2014;111:6521–6.
38. Wang J, et al. Quantitating cell-cell interaction functions with applications to glioblastoma multiforme cancer cells. Nano Lett. 2012;12:6101–6. 39. Yamanaka YJ, et al. Single-cell analysis of the dynamics and functional
outcomes of interactions between human natural killer cells and target cells. Integr Biol (Camb). 2012;4:1175–84.
40. Liadi I, et al. Individual motile CD4(+) T cells can participate in efficient multikilling through conjugation to multiple tumor cells. Cancer Immunol Res. 2015;3:473–82.
• We accept pre-submission inquiries
• Our selector tool helps you to find the most relevant journal
• We provide round the clock customer support
• Convenient online submission
• Thorough peer review
• Inclusion in PubMed and all major indexing services
• Maximum visibility for your research
Submit your manuscript at www.biomedcentral.com/submit