
R E V I E W
Open Access
Lightning detection on Venus: a critical
review
Ralph D. Lorenz
Abstract
Claimed detections and nondetections of lightning and related electromagnetic emissions on Venus are qualitatively contradictory. Here, motivated by the commencement of observations by the Akatsuki spacecraft and by studies of future missions, we critically review spacecraft and ground-based observations of the past 40 years, in an attempt to reconcile the discordant reports with a minimal number of assumptions. These include invoking alternative
interpretations of individual reports, guided by sensitivity thresholds, controls, and other objective benchmarks of observation integrity. The most compelling evidence is in fact the first, the very low frequency (VLF) radio emissions recorded beneath the clouds by all four of the Veneras 11–13 landers, and those data are re-examined closely, finding power-law amplitude characteristics and substantial differences between the different profiles. It is concluded that some kind of frequent electrical activity is supported by the preponderance of observations, but optical emissions are not consistent with terrestrial levels of activity. Venus’activity may, like Earth’s, have strong temporal and/or spatial variability, which coupled with the relatively short accumulated observation time for optical measurements, can lead to qualitative discrepancies between observation reports. We note a number of previously unconsidered observations and outline some considerations for future observations.
Keywords:Venus, Lightning, Electromagnetic emission, Observation
Introduction
As our sister planet Venus attracts particular interest among solar system objects, it is further important to recognize that many Earth-sized planets now being de-tected around other stars are as likely to be“Venus-like” as they are “Earth-like.” Lightning is an important process for several reasons (e.g. Rakov and Uman,2003). First, it is a striking phenomenon in its own right. Sec-ond, it may serve as a diagnostic of other processes, such as volcanism or convection. Third, lightning may be im-portant in atmospheric evolution and prebiotic evolu-tion, notably in fixing nitrogen which is an essential element in living things but is generally chemically in-accessible. Finally, lightning may be a hazard for vehicles exploring a planetary atmosphere.
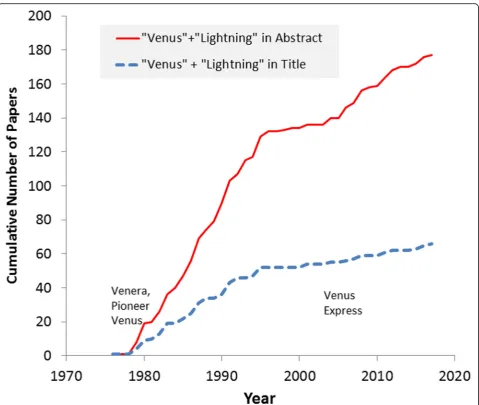
For these reasons, some effort has been devoted to de-tecting possible lightning on Venus, as indicated by the lit-erature on the topic (Fig. 1)—major stimuli to the topic have been the Venera and Pioneer Venus results around
1980 and the Venus Express results since 2007. Several previous surveys have reviewed planetary lightning gener-ally (Desch et al. 2003; Yair2012; Aplin 2013; Aplin and Fischer 2017). Reviews of Venus lightning specifically in-clude Williams et al. 1983, Russell 1991, and Hunten 1995, and the two notably comprehensive reviews in the Arizona Press “Venus” books now two decades old— Ksanfomality et al. 1983, Grebowsky et al. 1997. A comparatively recent Venus-specific review is given in Takahashi et al. (2008), who outlines the potential of new optical measurements on the Japanese Akatsuki Venus Climate Orbiter (Nakamura et al. 2007), which recently began operations at Venus after an extended journey (Nakamura et al.2014). It may be noted that lightning has been repeatedly observed at Jupiter and Saturn and is not in dispute, and firm nondetections are established at Titan. At Venus, however, there are many superficially conflicting positive and negative reports. This review attempts to assess these reports critically, to develop scenarios that seem most probable in so far as they are consistent with the preponderance of observations. Correspondence:[email protected]
Johns Hopkins Applied Physics Laboratory, 11100 Johns Hopkins Road, Laurel, MD 20723, USA
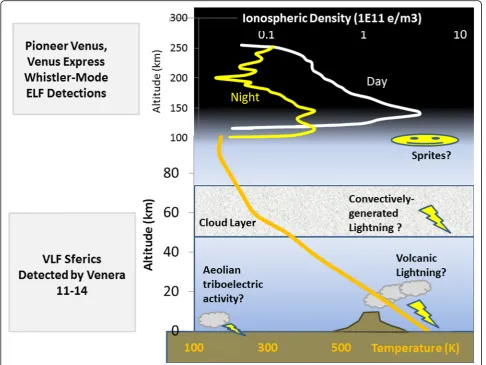
Broadly speaking, evidence for or against lightning on Venus may be classified in four general categories, which are shown schematically in Fig.2, against the profiles of electron density in the ionosphere and the temperature of the lower atmosphere. The main cloud layer lies be-tween about 50 and 75 km altitude.
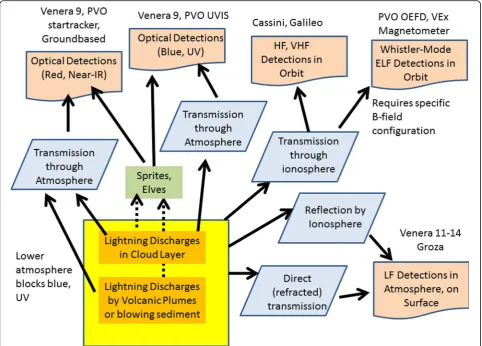
A key point in this review is that it is futile to recon-cile observations of claimed flash rates (or nondetection) without considering the robustness of the measurement (e.g., the quantification of false detection rate), the sig-nificance of the measurement (the area and duration of the observations), and the sensitivity (the magnitude of lightning discharge that would be detectable). Measure-ment sensitivity must also take into account the transfer of information from where the electrical discharge
occurs to the location of the measurement system: this propagation may be inefficient or even impossible (e.g., blue light from the lower atmosphere is absorbed before reaching space), or may be highly variable as in the case of whistler-mode plasma waves. This information propa-gation is summarized in Fig.3.
In this connection, it is interesting to consider that the detection footprints of the various techniques may have a counterintuitive trend—that higher-altitude surveys may sample a smaller area. Specifically, the extremely low frequency (ELF) (~ 100 Hz) whistler-mode electro-magnetic detections from orbit sample only an area con-nected to the spacecraft by appropriate ionospheric and magnetic field conditions and so may sense a range of only a couple of hundred kilometers from the subspacecraft
Fig. 1The growing corpus of scientific literature on the topic (Smithsonian-ADS refereed paper search 9/28/2017). Search keywords
point. However, very low frequency (VLF) (10–80 kHz) measurements by descent probes at low altitude may detect discharges at ranges of thousands of kilometers, due to ducted propagation by super-refraction in the lower atmosphere (Croft 1983) and/or by “skybounce”— reflection from the ionosphere (e.g., Simões et al.2008)— see also discussion in Ksanfomality et al. (1983). Similar VLF detectors are now used routinely by networks on Earth to map and track lightning activity over planetary-scale distances (see, e.g., Wood and Inan 2002 or the World-Wide Lightning Location Network WWLLN at https://webflash.ess.washington.edu).
A key challenge is in the interpretation of electrical or magnetic signatures claimed to be whistler-mode emis-sions from lightning discharges. For the Pioneer Venus electric field data at least, several alternative explana-tions were offered, and much of the 1980s literature is cluttered with this debate. In part, a difficulty is that
such observations somewhat transcend scientific discip-linary boundaries—atmospheric scientists are generally unfamiliar with plasma physics, and it is difficult for nonpartisan observers to gauge the robustness of differ-ent interpretations. What is clear, however, as we discuss later, is that such electromagnetic signatures are ob-served fairly consistently, and that lightning discharges are one possible origin.
A further point centers on the definition of“lightning.”It is only in the last couple of decades (long after the Venus lightning debate began in earnest with Pioneer Venus) that a fuller range of optical phenomena associated with atmos-pheric electrical discharges has been recognized on Earth, namely sprites, elves, blue jets, and other emissions. Given the different environment on Venus, it seems highly likely that not only are lightning bolts (if they occur in the con-ventional sense) possibly different in character, but these other types of luminous events may be present and have
Fig. 2Structure of the Venus atmosphere showing the ionosphere peaking between 100 and 150 km altitude (with daytime densities
exceeding 105cm−3) and the temperature profile with the main cloud layer around 60 km altitude. Possible sites of electro-optical activity
similar or different features compared with the Earth. For the purpose of this review, we consider “lightning” to be any optical emission associated with an electrical discharge, thus including ionosphere/mesosphere glows such as sprites as well as“conventional”lightning flashes.
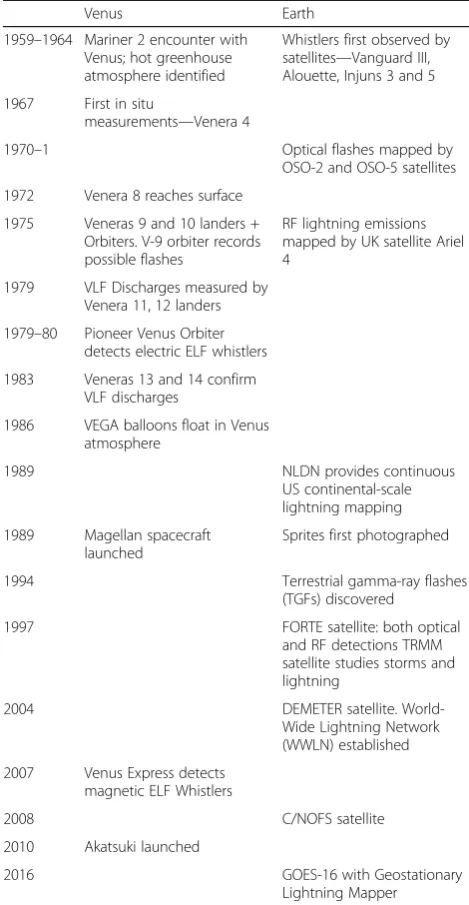
It is interesting to lay out the development of Venus lightning studies in parallel (see Table 1) with progress in studying lightning at Earth. In fact, many significant terrestrial developments have been made since the first observations of possible lightning on Venus—notably the development of terrestrial networks of radio systems able to provide real-time and essentially global surveil-lance of lightning activity. Indeed, not only have these developed from national-scale systems such as the US National Lightning Detection Network NLDN to the global WWLLN, but even an amateur network exists (“Blitzortung.org”) using simple VLF detectors linked to servers that locate strikes by time of arrival (see Fig.4).
More pertinents, perhaps, from an analogy standpoint are the observations of terrestrial lightning from space. Vanguard III, only the 12th satellite to reach the orbit and
only 2 years after Sputnik 1, carried a proton precession magnetometer, in which some VLF whistler-mode signals were detected (Cain et al.1961). Orbital measurements of whistlers were more robustly observed and directly attrib-uted to “fractional hop” whistler waves launched from near the sites of lightning discharges, by the Canadian sat-ellite Alouette (Barrington and Belrose 1963), and by the small US satellites Injuns 3 and 5 (see, e.g., Gurnett and O’Brien 1964). A global map of lightning is derived from the detection of VLF sferics measured in 1972 by the British satellite Ariel 4 (Bullough et al.1975).
Optical detections of lightning were made by photome-ters on the Orbiting Solar Observatory (OSO-B or OSO-2, Vorpahl et al. 1970) and then mapped in more detail by OSO-5 (Sparrow and Ney1971). These photometers were saturated by moonlight (and sunlight) and therefore were restricted to observations during the new moon. The field of view of these instruments was of the order of a few square degrees (a few × 104
km2), and in ~ 200 h of observation spread over 15 months, about 7000 lightning strokes were detected in about 1000 storms, revealing
Fig. 3A schematic of lightning sources and detection mechanisms, noting that detections rely on signal propagation mechanisms that may not
graphically the enhancement of lightning activity over land relative to the oceans at the same latitude. Surveillance by flash meters on US VELA satellites (installed to detect the optical emission from nuclear detonations) revealed a small population of particularly intense lightning discharges (Turman 1977) and later dedicated lightning sensors on the Defense Meteorological Support Program (DMSP) satellites gave additional information on the optical power distribution of lightning flashes overall (Turman1978; see also Christensen et al.1979).
Modern satellite sensors dedicated to lightning map-ping (e.g., the Lightning Imaging Sensor (LIS) on the
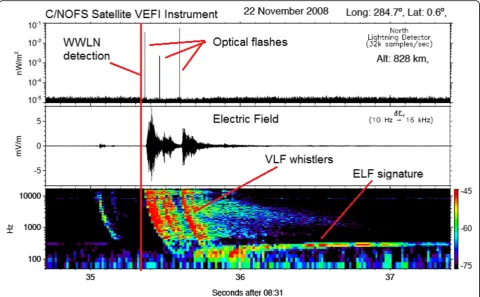
Tropical Rainfall Mapping Mission (TRMM), the Op-tical Transient Detector (OTD) (see, e.g., Finke 2009), and more recently, the global lightning imager on GOES-16 have yielded systematic observations of activ-ity, enabling correlation with geographical or convect-ive parameters. There have also been satellite missions dedicated to the study of lightning-related phenomena, notably the Fast On-orbit Rapid recording of Transient Events (FORTE) and Communications/Navigation Outage Forecasting System (C/NOFS), both of which carried optical flash detectors (photodiodes) as well as antennas to measure electromagnetic signatures. These observations (e.g., Fig. 5), and those from a related in-strument (Global Lightning and Sprite Measurements on Japanese Experiment Modules JEM-GLIMS on the International Space Station, e.g., Sato et al. 2015), have given us simultaneous views of different phenomena as-sociated with discharges, phenomena which have only been studied separately at Venus. There is also a powerful synergy between the ground-based networks and spacecraft sensors since they can perform intercali-brations to assess detection thresholds and efficiencies.
Venus observation review
In this section, we review pertinent details of the various Venus observations, arranged chronologically. The key parameters are summarized in Table2.
Veneras 11–14 lander electromagnetic observations Observations by the Veneras 11 and 12 probes, which des-cended to Venus’surface in December 1978, were the first strong report of lightning on Venus (Ksanfomality et al. 1979). Note that although the Venera 9 orbiter observations (see next section) were acquired earlier, their interpretation as lightning was not developed (Krasnopolsky1979; submit-ted November 10, 1979) until after Ksanfomality’s Venera 11/12 paper was published in the May/June 1979 issue of (originally submitted in February 1979).
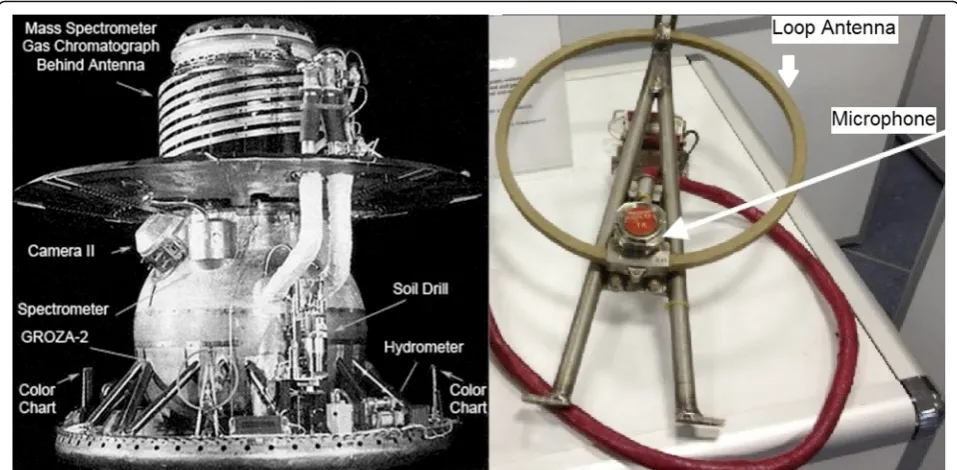
The Veneras 11 and 12 probes carried an instrument suite called“Groza”(thunderstorm—a clear indication of the purpose of the system) which comprised a magnetic field antenna (a loop) to detect sferics and a microphone to detect thunder. Signals in two wavebands (at 10 and 36 kHz) were recorded. Veneras 13 and 14 carried an improved instrument (Groza-2) which also included a seismometer, Fig.6.
The acoustic element of the instrument was not useful for detecting thunder during descent, in that, aeroacoustic noise of the air rushing past provided too strong a background for sensitive detection. On the surface, some lander-generated noise was identi-fied, and the background signal level was in fact used to estimate the wind speed on Veneras 11 and 12, but no thunder was detected.
Table 1Timeline of lightning studies. Venus dates correspond to relevant publications, rather than data acquisition, generally only a year or so earlier
Venus Earth
1959–1964 Mariner 2 encounter with Venus; hot greenhouse atmosphere identified
Whistlers first observed by satellites—Vanguard III, Alouette, Injuns 3 and 5
1967 First in situ
measurements—Venera 4
1970–1 Optical flashes mapped by
OSO-2 and OSO-5 satellites
1972 Venera 8 reaches surface
1975 Veneras 9 and 10 landers + Orbiters. V-9 orbiter records possible flashes
RF lightning emissions mapped by UK satellite Ariel 4
1979 VLF Discharges measured by Venera 11, 12 landers
1979–80 Pioneer Venus Orbiter detects electric ELF whistlers
1983 Veneras 13 and 14 confirm VLF discharges
1986 VEGA balloons float in Venus atmosphere
1989 NLDN provides continuous
US continental-scale lightning mapping
1989 Magellan spacecraft launched
Sprites first photographed
1994 Terrestrial gamma-ray flashes
(TGFs) discovered
1997 FORTE satellite: both optical
and RF detections TRMM satellite studies storms and lightning
2004 DEMETER satellite.
World-Wide Lightning Network (WWLN) established
2007 Venus Express detects magnetic ELF Whistlers
2008 C/NOFS satellite
2010 Akatsuki launched
2016 GOES-16 with Geostationary
The electromagnetic field sensor detected substantial activity, which showed a different vertical profile for each lander (suggesting that the signals were not arti-facts). Usually, these have been displayed together with scales adjusted; it is instructive here to show them on a common scale Fig.7.
Ksanfomality et al. (1979) and Ksanfomality (1980) claim that some of the detected bursts showed a periodicity com-mensurate with the slow rotation of the Venera 11 lander during the latter part of the descent, consistent with spin modulation due to the directionality of the antenna as it swept past a distant (i.e., of small extent in azimuth) source. However, this suggestion does not seem quite consistent with the measurements of the probe rotation from angular velocity sensors (~ 7°/s—see Fig. 4 of Karyagin et al.1980); the combination of this rate (50 s period) and the bi-lobed sensitivity pattern of the antenna should lead to a 25 s period modulation of a distant source, not the 40–80 s
modulation observed. Furthermore, inspection of the radi-ation pattern of the antenna (Fig. 10 of Ksanfomality et al. 1983) suggests that the sensitivity varies with azimuth by a factor of 2–3, yet the observed change in signal amplitude appears rather larger. Thus, an alternative interpretation advanced in the present review is that in fact the pseudo-periodic variations are bursts of the original emission (implying only one to four sources were being observed, each generating one or a few bursts), rather than spin modulation of a single continuous source.
On Venera 12, one electromagnetic burst was re-corded after landing. The burst (see Fig.10later in this article) lasted the entire observation window of 8 s, these windows being repeated at 3–4 min intervals. This sparse sampling only constrains the burst to have a dur-ation of between 8 and 360 s. No bursts were recorded on the surface by other landers (a total observation period of about 2 h.)
Fig. 4Map of lightning activity in a 2 h period, detected more or less globally (coverage in South America and Africa by this amateur network is
The near-continuous activity generally observed by the probes during most of the descent (the Venera 11 instance above notwithstanding) implies that if the activity is typic-ally in 5–70 s bursts, the observation (instrument plus sig-nal propagation characteristics) was sensitive enough to detect bursts from long enough distances that a sufficient number of sources was detectable at any moment to pre-vent gaps being observed between bursts. If we ignore for a moment that the probes were descending, we can con-sider each record as a time series. For Venera 11 (see, e.g., Fig.2. of Ksanfomality et al. 1983), the activity was moder-ate (~ 20 uVm−1Hz−0.5) between 0530 and 0545 h (60 to 30 km) and strong (~ 100 uVm−1Hz−0.5) from then until 0605 (15 km) then moderate to the surface. For Venera 12 (ibid, Fig. 3) some sporadic activity (with 1–2 min variations) was seen for the first 15 mins of descent, then essentially zero for the next 25 min, then moderate activity for the last 20 min of descent.
Considering the first part of Venera 11, if a single source causes ~ 5 bursts of ~ 30 s duration (as indicated in the high-resolution record 0606–0611 previously interpreted as spin modulation—Ksanfomality et al.1983; Fig.8), then
the continuous record seen 0546–0552 (ibid, Fig. 5) im-plies two or more sources within range, such that the bursts overlap.
Note that in addition to the averaged field strength (recorded with a 0.25 s time constant, and in some cases in the papers cited above plotted after averaging over 20 s periods), the radio system was also equipped with a pulse counter. This indicated (Ksanfomality et al. 1979) pulse rates (threshold not specified) from 1or 2 per second to 10 or 20 for part of Venera 11’s descent, and the text indi-cates even higher levels were seen. Pulse counter data is also presented in Ksanfomality et al. (1982) for Venera 14, with a threshold of some 200 μV/m/Hz0.5—at this quite high threshold, the rates were 0 to 2 pulses per 10 s above about 25 km, with some periods of 5–7 pulses per 10 s below that level.
The possibility of some artifact (e.g., noise generated by aerodynamic flutter during descent) does not appear to have been discussed in detail in the literature. However, a slow systematic (smooth) altitude dependence would be expected, as the vehicles’terminal velocity slowed as they reached the denser lower atmosphere—such a dependence
Fig. 5A single (multiple) lightning flash recorded by the C/NOFS satellite on Earth in multiple ways that have only separately been seen on Venus. Three
was not observed. Further, it is seen (e.g., Ksanfomality et al.1983, Fig.10) that the signals do not cease abruptly at impact but rather fall off within the last few hundred meters of descent, more consistent perhaps with terrain obscuration of signal propagation. (The possibility of near-surface atmospheric composition changes causing radio absorption cannot be completely excluded, how-ever). Finally, specifically to test whether charging of the vehicle itself could be responsible for the observed signals, a discharge current meter was installed on the Groza-2 experiments on Veneras 13 and 14 (see Ksanfomality et al. 1982)—those results do not appear to indicate any strong local contribution to the observed discharges but may be consistent with the presence of charged dust in the Venus lower atmosphere (Lorenz2018).
It is useful to put the Groza experiments in context with a similar investigation, the Lightning and Radio Emission Detector (LRD) on the Galileo Probe (e.g., Lanzerotti et al. 1992; Rinnert et al. 1989, 1998). It was noted that the noise background of this instrument was found to be higher in flight (due to the operation of a nearby radiometer instrument with an electric motor) than in laboratory/field tests.
It may also be noted that the LRD instrument detected between 10 and several hundred RF pulses per second throughout the descent (over 150,000 pulses total), whereas no optical lightning detections were claimed (the few hun-dred counted optical pulses being attributed to spin-modulated sunlight early in descent, or to cosmic rays—see
Rinnert et al. 1998). This underscores the comparative long-range ability of electromagnetic vs optical sensing (and makes the optical nondetection of the VEGA balloon at Venus perhaps unsurprising). The LRD used a ferrite coil antenna (i.e., sensing the magnetic component of the signal, like the Groza instruments) and counted pulses in narrow bands at 3, 15, and 90 kHz, with the lowest frequencies see-ing highest activity; sensed pulse amplitudes reached a few tens of nanotesla. The LRD detected appreciable azimuthal anisotropies (i.e., preferred source directions).
Terrestrial tests of the LRD showed that intensity fell off with increasing frequency approximately as f−2; such a strong fall-off was also seen at Jupiter (Rinnert et al. 1985). The Groza instrument at Venus found a spectral index varying between 0.5 and 2, typically 1. This fall-off seems consistent with an interpretation of the signals as due to electrical discharges. Note that the sometimes challenging units of electromagnetic observations have perhaps limited external scrutiny into these results—for example, even though a magnetic antenna was used, (Ksanfomality et al. 1979, Ksanfomality et al. 1983 here-after referred to as K83) expresses the Groza signals as electric field intensity—e.g., the 10 kHz signals on Venera 12 (K83 Fig. 3) reaching a value of ~ 15 μV/m/ Hz0.5 (recorded over a bandwidth of 1.6 kHz) or a peak field of 0.6 mV/m. For classic electromagnetic propagation in free space, the electric field E relates to the magnetic fieldBasE=cB, withcbeing the speed of light—note that this relation does not hold for the
Fig. 6The Venera 13 lander (left) with major systems noted (figure courtesy W. Huntress)—the GROZA-2 label points to the location of the loop antenna
whistler-mode propagation in a plasma), and so, this corresponds to 0.002 nT, or 5 × 10⁻⁵ nT/Hz0.5. The Galileo sensors at Jupiter, by contrast, recorded a power spectral density of up to 10−3nT2/Hz or ~ 1 × 10⁻⁶ nT/ Hz0.5 at a similar frequency (15 kHz), a significantly lower level than Venus. On the other hand, a handful of waveforms were recorded by Galileo, the largest having a peak amplitude of a couple of tens of nanotesla (Lanzerotti et al.1996; Rinnert et al.1998).
In many respects, the Groza records are among the rich-est datasets pertaining to possible Venus lightning. Their
presentation in various graphical forms in Ksanfomality et al. 1979 and 1983 is useful, but the examination with new statistical methods would benefit from access to ori-ginal digital data, which is unfortunately not publicly ac-cessible (sadly, also true of the Galileo LRD experiment).
Note that Ksanfomality’s papers (1982, 1983) describe anomalies encountered by the Pioneer Venus probes as circumstantial support for electrical activity. While at the time, the possibility of some kind of discharge had been considered one possible explanation for these anomalies (the failure of external temperature sensors
Fig. 7The electromagnetic field intensity (5 kHz bandwidth centered on 10 kHz) from Veneras 11–13 (Ksanfomality et al.1982,1983) averaged
on all four probes, at the same altitude of ~ 12 km) these anomalies have since been attributed to a failure of elec-trical insulation in the Venus environment at this alti-tude (e.g., Seiff 1995; Harland and Lorenz 2006) and so should not be considered as indicating electrical activity (although they do not exclude it either).
Venera 9 and 10 orbiter spectrometer
These observations, initially reported in Krasnopolsky (1979), are discussed at rather more length in Krasno-polsky (1983a, 1983b, 2006). As this UV-visible-NearIR spectrometer scanned over 10 s from 300 to 800 nm, ob-serving a 160 × 9 km patch of the Venus nightside, the re-corded light level saw several irregular jumps—seven such scans had these jumps. Interpreting this as a time series rather than a spectrum, there was a 70 s series of flashes, about two per second, each lasting about 250 ms, each of about 3 × 10⁷J of optical energy. Although claimed to be “similar to the duration of a flash on Earth,” these durations (much longer than the instrument response time of 5 ms) are puzzling. The observation was at 9° S around 7 pm local solar time; the “thunderstorm region” is described as being of 50,000 km2 area, presumably derived by mapping the instrument footprint migration during the 70 s.
One point to note is that in fact, this event was seen during the very first night observation of the instrument, perhaps when instrument anomalies would be more likely to occur. A further consideration is that while no localized Venus emission interpreted as lightning was recorded by the instrument on Venera 10, the light was unexpectedly measured off-disk and was interpreted as a dust trail from a comet Krasnopolsky and Krysko,1979. The presence of a dust trail (something no mission to Venus before or since has indicated) cannot be ruled out entirely but is at least superficially improbable. Instead, it is possible that both this observation and/or the Venera 9 “lightning” burst may have been caused by light reflected from some material (e.g., thermal blanket) released from the space-craft: a tumbling reflector could give quasiperiodic flashes with durations consistent with the 0.25 s durations ob-served. The star tracker on Magellan was spoofed by parti-cles shed from its that spacecraft’s thermal blankets when solar wind conditions led to surface charging (e.g., Harland and Lorenz 2005). It is also reported that the Venera 9 instrument temperatures increased from 20 to 60 °C, during its 2-month mission, a factor which de-graded the sensitivity of the spectrometer instrument (Krasnopolsky1983a).
When considered qualitatively,“Venera 9 saw lightning, but some aspects of the observation are puzzling.” A quantitative perspective, however, is much more illu-minating. An important quantity recently explained (Krasnopolsky, personal communication, June 2017) to the author of the present paper is the duration of subsequent nightside observations (for Veneras 9 and 10 combined) where no lightning features were observed, 50,000 s. Thus, one“burst”of 70 s of emission was seen in about 14 h of observation of an area ~ 1500km2, the activity being present ~ 0.1% of the time.
Krasnopolsky claims that the spikes are enveloped somewhat by the optical sensitivity of the instrument (i.e., fewer/weaker flashes at the ends of the passband, whereas electrical noise or cosmic rays might be expected to be uniform with time/wavelength), supporting an external optical origin of the signal. However, this is also fully consistent with the sunlight reflections-from-debris hy-pothesis suggested above. If the signal was really due to lightning, it imposes an altitude constraint for the optical emission (as noted by Krasnopolsky2006) in that the blue end of the spectrum at 20 km or below (i.e., volcanic lightning) would be attenuated severely by the atmos-phere, and thus, whatever light was observed by Venera 9 had to come from above the deep atmosphere. However, since lightning emission has a highly nonuniform line emission spectrum (e.g., Borucki et al. 1985, 1996), the somewhat uniform peak amplitudes observed by Venera 9 seems perhaps more consistent with periodically reflected sunlight.
Fig. 8Amplitude distribution of pulse heights (inset) recorded at a
Pioneer Venus electric field detector
The Pioneer Venus Orbiter was placed in December 1978 into an elliptical polar orbit around Venus with a 24 h period. It carried an electric field instrument which measured the power of electric field variations in four narrow wavebands. Taylor et al. (1979) and Scarf and Russell, 1983 reported that signals seen over nightside periapses, most prominently in the 100 Hz band, could be interpreted as whistler-mode emissions from lightning. These signals were“impulsive”in the sense of being short compared with the 0.5 s sampling interval and the 0.7 s decay time of the instrument. Because the spacecraft environment was noisy in sunlight, these signals could only be reliably detected at night, and they were detected only at low altitude (e.g., Scarf et al. 1980), which given the parameters of the orbit, meant low latitudes.
A variety of plasma phenomena can occur in space, and alternative explanations were offered for these sig-nals and an extensive debate in the literature ensued. We do not recapitulate the blow-by-blow debate here
but refer the reader to comprehensive reviews by Russell (1991) and Grebowsky et al. (1997) Fig.9.
For the present discussion, we may note that while all observations (electromagnetic or optical) may suffer noise or artifacts, there are features of the signals that are claimed to be consistent with a lightning origin, not-ably their altitude dependence.
Scarf et al. (1987) reported identifying 4240 bursts in the first 2124 orbits, at altitudes between 150 and 2900 km, in-dicated by them as a total observation period of 257 h. Then, whatever phenomenon a“burst”actually corresponds to—perhaps passage over a thunderstorm—there were about 15 per hour. Note that the “new” burst definition used by Scarf et al. (1987), counting short events distinctly, corresponds to a rate five times higher than that used previ-ously (assessing whether a signal existed in a 30 s window or not.) A more elaborate analysis was made by Ho et al. (1991) who attempted to deconvolve the response time of the instrument—in effect counting any 0.5 s window with measureable “extra” energy as an event—see Fig. 10. This yielded the rather high rate of ~ 0.14 events per second.
Fig. 9NASA artists impression of the Pioneer Venus orbiter. The Orbiter Electric Field Detector (OEFD) measures the potential between two wire
Although some claims of geographical association of whistler detections with elevated terrain (presumed to be volcanic) were made (e.g., Scarf et al.1987), sampling biases may not have been fully taken into account, and this correlation is now considered weak at best—one refutation is by Taylor Jr and Cloutier (1986).1
Considerably more robust, however, is the finding that activity appeared to be concentrated in the dusk-midnight sector, with much less in the dusk-midnight-dawn sector. Note that whereas on Earth, most convection oc-curs in the afternoon when solar heating is strong, on Venus convection may instead be driven by cloud-top
Fig. 10Several different Venus lightning detections plotted with arbitrary vertical scales, but on the same abscissa, showing the characteristic
cooling (e.g., Imamura et al. 2014) at night. This latter scenario would probably cause peak convective lightning activity in the dusk-midnight sector, as observed.
Pioneer Venus optical
Borucki et al. (1981, 1991) examined data from the star scanner on the Pioneer Venus Orbiter—an in-strument and data-mining analysis much like that of Sparrow and Ney (1971) at Earth. Borucki et al.’s nondetection of events (or rather a detection rate that did not exceed the false alarm background due to energetic particles) in fact derived from only 450 s of effective search time (Borucki et al. 1981; another 88 s, but covering a wider area, was added in further analysis, Borucki et al. 1991). The short observation period results from the fact that the ob-servations relied on lightning emissions not being observed directly but rather scattered into the de-tector as stray light—even the “ashen light” from the Venus nightside saturated the detector when ob-served directly. Despite this short observing time, the area-time product of a few × 107 km2s was enough to derive a useful upper limit on the flash rate of 1–4 × 10⁻⁷ flashes/km2/s.
Pioneer Venus ultraviolet spectrometer
An optical anomaly was noted (Huestis and Slanger 1993) in the analysis of data from the Pioneer Venus Orbiter ultraviolet spectrometer, whose primary pur-pose was to investigate the nightglow between 150 and 360 nm wavelength. In one observation (orbit 75), three successive scans were observed to have a strong emission (at wavelengths matching the N-O band sys-tem). These short-wavelength scans had an interval of 24 s, as the spacecraft spun with a 12 s period and short-wavelength (155–258 nm) and long-wavelength (258–360 nm) scans were interleaved. No anomalous brightness in the two intervening long-wavelength scans was observed. One could interpret this as a 72 s long event with only shortwave emission in nar-row bands, or perhaps just coincidence that the 3–5 major flashes (discarding those with only one or two photons—see their Fig. 9) over a 72 s period just hap-pened to occur during the shortwave scans. It should be noted that the “strong emission,” corresponding to 70 kR (kiloRayleighs—where oneR= 1010 photons/m2/s), was indicated by only about 60 photons in each scan, compared with a typical 30 photons due to the airglow.
Huestis and Slanger (1993) offered a meteor trail (900 km long!) as a possible explanation, considering this more plausible than a lightning or auroral origin. Their interpretation seems improbable but cannot be excluded. The observation seems incompatible with a direct
lightning origin (even though Borucki et al. (1996) con-clude that discharges in the Venus atmosphere would produce some UV light, it would be scattered or absorbed before reaching an orbiting detector if launched from the clouds.) The possibility, however, of it being due to upper atmosphere luminosity from elec-trical discharge (i.e., sprites, elves, etc.—phenomena which only became well-known in the 1990s, after this observation and analysis were completed) might bear re-examination. Indeed, Pérez-Invernón et al. (2016) present models of posssible mesospheric optical signa-tures of lightning (i.e., transient luminous events (TLEs, such as sprites and elves) but curiously do not cite the Huestis and Slanger work. They note that in addition to the green and red oxygen lines, nitrogen emission would occur in the UV and near-IR. As an example, a lightning discharge with a total released energy of 2 × 10¹⁰ J would launch 2 × 10²⁰ green photons and 3.7 × 10¹⁹ photons 120–280 nm, much of which would be in the PV UVS passband.
UV observations were made (lasting a few tens of minutes around periapsis) over the first 2 years; only this single anomaly was reported. Thus, this single “burst” of ~ 72 s was the only one in ~ 1 million sec-onds of observation.
Pioneer Venus gamma ray detector
The Pioneer Venus Orbiter in fact carried an instrument whose purpose was not to study Venus at all; the Orbiter Gamma-Ray Burst Detector (OGBD) was flown to help measure astrophysical gamma-ray bursts, by using time-of-arrival differences between it and other spacecraft in the solar system to triangulate the source direction. This instrument operated for some 14 years until 1993 when Pioneer Venus’ orbit decayed. It was only a year afterwards that terrestrial gamma-ray flashes (TGFs) associated with lightning on Earth were discovered Fishman et al. 1994.
on a future Venus orbiter (e.g., to measure sulphur in the clouds), a high-time-resolution capability would be desirable to detect possible lightning flashes.
VEGA balloon
The two VEGA balloons deposited into Venus’ atmos-phere in 1985 floated for ~ 48 h at an altitude of 50– 55 km. Each gondola was equipped with a photodiode light gauge, including an electronic high-pass filter to detect flashes. No flash detections were reported: Sagdeev et al. (1986) notes that the intermediate-brightness flash counter on VEGA 2 did increment once, indicating a possible flash, but the measurement is suspi-cious because it was made near the terminator (where varying cloud-top altitudes could cause strong changes in ambient illumination) and that the lower-level thresh-old counter should also have incremented but did not. The VEGA data have recently been restored and made available for the NASA Planetary Data System (PDS)— Lorenz et al. (2018); it may be noted that the VEGA-2 lander pressure-temperature profile therein is the only high-quality in situ atmospheric dataset that reaches all the way to the surface of Venus.
Although the observation period was relatively long, it may be noted that the observation was mostly in the midnight-dawn sector of the Venus day (on Earth, the period least likely to see lightning). Furthermore, the de-tection area would have been relatively small, only a few tens of kilometers across at most, i.e., area of ~ 1000 km2. The platform is pseudoLagrangian, being advected with the air mass. Thus, if one adopts the proposition that some air masses have lightning and some do not (e.g., due to moisture content), then the range of locations sampled is very small (in contrast, e.g., to an orbiter survey of similar duration). Thus, the nondetection is a rather weak constraint on lightning on Venus.
Galileo radio
Gurnett et al. (1991) reported the detection of nine elec-tric field impulses over a period of 53 min during the Galileo spacecraft’s Venus flyby in 1991 at about 4–5 RV
(Venus radii), i.e., a range of about 20,000 km. Although at the time, they reported that “lightning is the most likely source,” the lead on this investigation has in-formed us (Gurnett, personal communication, 23 May 2017) that he no longer believes lightning to be respon-sible, noting that impulsive signals could arise from (1) spacecraft electronics, (2) plasma waves, (3) dust im-pacts, (4) thermal stresses that cause discontinuous mechanical motions that are coupled to the antennas via microphonic effects, and (5) other unknown effects. Al-though control observations were carried out during two 1 h intervals (when no impulses were seen), these were well before the Venus flyby and well after the Venus
flyby. Notably, the high-voltage component of a plasma instrument (PLS) was active during the close approach period but was off during the control intervals. Thus, it is possible that the operation of the PLS high voltage unit close to Venus was responsible for the signals inter-preted at the time as lightning. It may also be noted that if the impulses really were due to lightning, the observed rate is much lower than would be observed for terres-trial lightning at a comparable radial distance.
Galileo optical
Belton et al. (1991) examined nightside images of Venus acquired by the Galileo spacecraft during its flyby en route to Jupiter. Ten images were devoted to this lightning search; however, since exposure times were less than a second, the nondetection is not a strong constraint.
Mt. Bigelow ground-based optical
Hansell et al. (1995) installed the CCD detector at the 153 cm telescope located on Mt. Bigelow, Arizona (more popularly known locally as the“61-inch.”), and searched for light flashes on the nightside of Venus. Their study carefully employed coronagraphic optics, using two masks designed in accordance with the specific geometry for each individual night of viewing. An occulting mask was used in the imaging plane, and a Lyot mask was used to block diffracted light by the edges and support structure of the secondary mirror. The CCD detector was operated at 18.8 frames/s for ∼30 pixel images of Venus. The observations were made at mainly 777.4 nm (i.e., in the near-infrared—an atomic oxygen line ex-pected from laboratory simulations of lightning dis-charge in a carbon dioxide atmosphere by Borucki et al. 1996); a few observations were made at 656.3 nm as a control. For eight nights in 1993, the total viewing time was 3 h at 777.4 nm and 45 min at 656.3 nm. The dusk side of Venus was facing Earth. Seven events met the stringent criteria (including the requirement that an event must be seen on more than one pixel) that the ex-perimenters used for isolating lightning flashes, as shown in Fig. 1. Six events were detected in the 777.4 nm line. The seventh occurred while observations were being made at 656.3 nm. The 777.4 nm flashes occur at a rate of 2.7 × 10⁻¹² flashes/km2/s and imply Venus lightning flashes with optical energies from 7 × 10⁷ to 2 × 10⁹ J.
light from a carbon emission line at 658 nm identified in laboratory experiments simulating lightning dis-charge in various planetary atmospheres (Borucki et al. 1985; Borucki et al.1996).
A remark on the flash duration is in order. Krasnopolsky’s (1979) detections—see earlier—were about 250 ms long, not typical of terrestrial flashes (as had been claimed). The Hansell et al. (1995) data ana-lysis procedure entailed subtracting a running average image (of the two frames before and the two frames after) from each image. Thus, if a flash were of 250 ms duration, it would have spanned all five frames, and the bias (average) image would contain just as much energy as the frame under study. In other words, the analysis procedure excluded long pulses of light. Note also that the analysis procedure excluded single-pixel events. The only events recorded, then, had an apparent span of many hundreds of kilometers, although the sources may have been rather smaller but blurred by the Earth’s at-mosphere (observations of Venus are necessarily made with Venus low in the sky and thus at large air masses, susceptible to seeing conditions). Note that some other phenomena do have durations of 250 ms (e.g., blue jets), and meteor fireballs or trails can have durations of the order of a second or longer (e.g., McAuliffe and Christou 2006).
Note that Hansell and colleagues repeated the experi-ment the following year (Hansell, personal communica-tion, 2010), although since this was a null result and the concluding part of work for a thesis (Hansell, University of Arizona, 1996), no journal publication was made. This experiment used a dichroic splitter so that both the 778 nm and hydrogen-alpha line would be observed sim-ultaneously. The same processing applied to the earlier imaging campaign failed to yield any detections at either wavelength, although it should be noted that the new ob-servation was made on the sunrise side of Venus’ dark disk (i.e., local solar times between about midnight and 6 a.m., where the electromagnetic results from Pioneer Venus seem to show a pronounced decrease in activity.)
Cassini radio
The Cassini flybys (Gurnett et al.2001) provided a much better search for lightning at Venus than was available from the Galileo flyby. The reasons are as follows. First, the flyby altitudes for Cassini, 284 and 598 km, were much closer than for Galileo, which would make the lightning signals stronger by a factor of 1600 to 10,000 in power. Second, be-cause Cassini had longer antennas, its sensitivity was better than for Galileo, by at least a factor of 10. Third, the inte-gration time constant of the Cassini receiver (1 ms for some of the observations) is much better suited to detect the very short impulses from lightning than the Galileo receiver, which had an integration time constant of about 100 ms.
Furthermore, the ability of the Cassini instrument to detect lightning was explicitly demonstrated during the Cassini-Earth flyby in August 1999, during which over 1000 impulses consistent with lightning were detected at radial distances inside 14 RE. That no impulses significantly above
the receiver noise level were detected during either of the Cassini-Venus flybys (total observing time of several hours while viewing essentially the entire planet) allows us to make the very strong statement that “lightning similar to terrestrial lightning did not exist at Venus during the two Cassini flybys.”Crudely, one might interpret the null result as indicating a flash rate lower than about one-thousandth of Earth’s. Of course, this does not rule out the possibility that episodes of terrestrial-like lightning could occur at Venus during other times, such as occurs for the very epi-sodic lightning at Saturn (intense lightning activity was ob-served in association with a large storm on that planet, around the equinox season in 2009, but relatively little ac-tivity has been detected by the 2004–2017 Cassini mission either optically or by radio before or since this one storm— see, e.g., Fischer et al.2011).
Venus Express magnetometer
The most persuasive recent evidence for lightning are the transient AC magnetic field pulses observed by Venus Express (Russell et al.2008a). Like other electro-magnetic evidence, these suffer from the ambiguity of hav-ing alternative explanations (spacecraft artifacts, plasma noise, etc.), but the recurrent nature of the signals (having been observed hundreds of times) and the fact that their polarization and detection appear consistent with whistler-mode ELF emissions lend some support to the claim that they have a lightning-like origin.
Specifically, they have been observed close to the peri-apsis of Venus Express (~ 250 km altitude; due to Venus Express’s orbit, this happens nearly over the north pole), when magnetic field lines are inclined in such a way as to link the spacecraft with Venus’atmosphere. The signals are detected at 64 Hz (the sample rate of the magnetom-eter is limited to 128 Hz) and have a typical amplitude of 0.1 nT, sometimes reaching 1.5 nT (Daniels et al.2012).
Hart et al. (2013) describe the bursts as lasting be-tween 6 s and up to a minute. Note, however, that the spacecraft is moving at almost 10 km/s, so in 1 min, the vehicle traverses about 600 km. If the range sensed by the whistler-mode observation is only a couple of hun-dred kilometers, then it may be that the upper bound on burst duration is truncated not by the intrinsic duration of bursts of activity but by the duration of the visibility window of a given source.
Russell et al. (2008b) note that in the first Venus year of operation, there were 12,223 s of useful data, during which 61 bursts were detected, i.e., one per 200 s. They assumed that the magnetic field permitted detection only 25% of the time. They also make the reasonable (but unsup-ported) assumption that the detection samples a region 200 km in radius (roughly the spacecraft altitude above the ionosphere) or 0.027% of the surface and extrapolate to a rate of 18/s globally.
Some care is needed in that different definitions of the event or “burst” have been used. Daniels et al. (2012) show magnetometer waveforms and hodograms and de-scribe the“components” as lasting around 100 ms (since the data are generated from heavily bandpass-filtered signals between 42 and 60 Hz, 100 ms corresponds to only a few“wiggles”of the signal) whereas Russell et al. (2007a) describe them as 0.2–0.5 s. They show the peak rate of bursts defined that way as ~ 0.0045 per second at 200–225 km altitude, whereas the “reduced” burst rate, defined as the number of 5 s intervals containing such a signal as 0.0014 per second—thus on average, when a 5 s burst occurs, it contains ~ 3 smaller pulses.
These rates, based on several years of operation, are a disconcerting order of magnitude less than the initial re-port of Russell et al. (2007a). That study used 37 orbits (days) of data selected when the background noise due to the spacecraft reaction wheels was particularly low, such that bursts with a peak-to-peak amplitude of 0.2 nT can be picked out. Reader attention is needed to note that the Daniels et al. (2011) counts of 0.2 nT are for 0.2 nT half amplitude—i.e., events double in amplitude compared with Russell et al. (2007a). Lightning events, like many other phenomena in nature, have highly skewed popula-tions, and any attempt to compare counts without taking the detection threshold into account is hopeless (see, e.g., Lorenz 2009 for a similar problem with dust devils). Daniels et al. (2011) break their counts up into several amplitude bins—> 0.4 nT events make up only 10% of the total of > 0.2 nT events, so one might similarly extrapolate that > 0.1 nT events are ten times more abundant, consist-ent with the Russell et al. (2007a) numbers. Russell et al. (2011) describe bursts as about 4 s long and having a rate of 0.05/s at peak. Thus, even considering obser-vations from a single instrument, the event rate may vary by a factor of ~ 40 (0.0014 to 0.05/s) depending on the threshold and time window considered! The same caution applies to optical detections—see Fig. 11 and associated discussion later.
Venus Express near-infrared
Moinelo et al. (2016) examined nighttime data from the visible (280–1100 nm) channel of the VIRTIS imaging spectrometer on Venus Express. Their search resulted in thousands of transient signal detections, but these could
all be explained by cosmic rays impinging on the de-tector, and analysis showed that the events were ran-domly distributed along the spectral dimension, rather than being associated with some expected line emission from Venus’atmosphere. The total observing time was ~ 50,000 s (Moinelo, personal communication, 2017).
Ground-based optical (II)
García Munõz et al. (2011) utilized narrowband fast im-aging of the Venus disk from an array of ground-based telescopes. The search targeted the oxygen emission line at 777 nm which should be a prominent line in lightning (as on Earth—most terrestrial spaceborne sensors use a filter to isolate this wavelength to improve the signal to noise). Two sites (Calar Alto and Observatorio del Teide) and three instruments (AstraLux, FastCam, and Wide FastCam) were used for observations during November 2010 to January 2011. The analysis of the night-side imaging of Venus showed no signal of optical emissions. It is likely that many other optical surveys with negative results also exist since nondetections tend not to be reported (e.g., an anonymous reviewer of this paper suggested that the late D. Sentman at University of Alaska made such observations but no formal publi-cation resulted).
Implications and discussion Synthesis of observations
In Tables 3 and 4, we review the evidence outlined in the previous section. While indeed the reports are not mutually consistent with a simple picture of Earth-like lightning, some conclusions can be drawn, most notably that some sort of atmospheric electricity effect is present but that it yields neither optical flashes nor VLF radio emissions observable from space in anything like the frequency that oc-curs for Earth.
In principle, it might be possible to aggregate the ob-servational constraints and apply them to models of lightning distribution (spatial, temporal, and amplitude) to test various hypotheses. For example, if lightning is exclusively due to volcanoes, sources will be geographic-ally fixed and will have no local time dependence (although various observation efficiencies, e.g., the iono-sphere, may have such dependence). However, the data at hand do not seem adequate to justify such an exer-cise—the Venera lander datasets are too brief, the Pion-eer Venus results already dismissed as equivocal, while the Venus Express magnetometer results are confined to near the north pole and are likely conditioned more by propagation conditions than by local time or geographic effects on their sources.
Table 3Summary of characteristics of Venus electrical activity
Property Estimate and
confidence
Support Comment
Rate of bursts 15/h
~ 1/min ~ 18/h
PV E-field bursts [30 s] (Scarf et al.1987) Venera 11 bursts 13–17 km
Venus Express bursts (see text)
Rate of pulses (during burst) ~ 0.14/s ~ 0.1–0.7/s 2–20/s
PV E-field pulses (Ho et al. 1990)
Venera 14 descent pulses (> 200μV/m/Hz0.5) Venera 11 descent pulses (unknown threshold)
Duration of burst events Well-determined: 5–100 s
•Venera 12 surface burst > 8 s, less than 3–6 min
•VEx magnetometer bursts 6 s to > 60 s
•Venera 9 burst 70 s
•PV E-field bursts
Overlaps between bursts on Veneras 11–14 descent do not constrain burst duration
Flash duration Unclear •Venera 9 claims ~ 250 ms (long for terrestrial lightning) but instrument response?
•Hansell ground-based detections < 100 ms (but 5-frame running mean bias subtraction reduces sensitivities to flashes > 50 ms, and discards transients > 250 ms altogether)
•Veneras 11–14 pulses 10–60/s, means up to ~ 8–50 ms long
Venus Express, Pioneer Venus ELF signatures longer than“flash”due to propagation delay, so no constraint (see Fig.5bottom panel)
Geographic distribution Global? •PV OEFD detections mostly mid-latitude (claimed association with highlands specifically was not substantiated by data, but not excluded either
•VEx MAG detections only made near north pole (low altitude required for observation)
•Venera lander detections made at low latitude, but long detection range gives little localization
Source region size < few hundred
kilometers •
Spin modulation of Venera 11 source
•PV, VEx cover ~ 600 km in 60 s
•Hansell flashes cover 3–15 pixels (2.2 arcsec pixels each ~ 600 km across)
Local time distribution Strongest observed in evening (18–24 h). But few dayside
observations
•Strongly indicated by distribution of PV OEFD and VEx MAG bursts
•Statistics of optical detections too poor to provide useful constraints
Evening cooling of cloud-tops drives convection?
Table 4Summary of hypotheses regarding Venus lightning
Scenario Support Comment/challenge Conclusion
There is no electrical activity on Venus
•Sensitive Cassini search yielded null result
•Various optical searches have yielded null results
•A priori theoretical difficulty of charge separation
•Requires alternative mechanisms (e.g., local plasma noise) for all orbital electromagnetic evidence (Pioneer OEFD, VEx
magnetometer)
•Also requires alternative mechanism for atmosphere/surface electromagnetic evidence (Veneras 11–14)
•Implies Venera 9 optical detection spurious (not improbable per the present paper)
•Implies ground-based optical detection spurious
Unlikely
Sporadic electrical discharges occur with characteristics different from Earth
•Consistent with electromagnetic signatures
•Occasional optical detections
•If optical signals are present at all, perhaps they are transient luminous events (TLE’s, i.e., sprites or similar)
•Cassini radio nondetection was“unlucky”—ionospheric conditions?
Not excluded
Frequent lightning similar to Earth •Venera 9 original
interpretation •
Sensitive Cassini search yielded null result, but detected ample activity at Earth with similar observation
•Orbital electromagnetic signatures imply lower rates
•Various optical searches have yielded null results or low flash rates
•A priori theoretical difficulty of charge separation
somewhat smaller aperture (which are quite abundant). Modern digital video cameras allow high frame rates suit-able for detecting transients, and the computer storage and processing hardware and software—demanding in the mid-1990s for this application—are easy to acquire. Not-ably, software to detect bright transients in planetary video sequences has been developed and made publicly available (e.g., http://pvol2.ehu.eus/psws/jovian_impacts/) and has been successful in detecting impact flashes on Jupiter and the moon (e.g., Hueso et al.2013).
Chemical evidence for lightning
On Earth, lightning was the principal mechanism of nitro-gen fixation prior to the evolution of nitronitro-gen-fixing bac-teria and the Haber process. It has been long noted (e.g., Krasnopolsky1983; Bar-Nun1980) that the abundance of NO or other nitrogen-bearing species could be profoundly influenced by lightning, and the observed abundance has been taken as at least circumstantial evidence for lightning. Krasnopolsky (2006) suggested an abundance of 5.5 ± 1.5 ppb below 60 km by ground-based telescopic observations and argued that this was consistent with a global flash rate is∼90 flashes/s for a flash energy∼109J (of course, the chemistry only constrains the product of flash rate and energy—larger but rarer flashes would yield the same production.). The production of NO by shock chemistry associated with meteors has not been evaluated but could conceivably reduce the apparent need for lightning to yield the observed NO abundance.
Lightning and volcanos
In many respects, the study of present-day volcanism on Venus has parallels with the study of lightning. While the past modification of the Venus surface by volcanism is indisputable, the detection of the present-day activity is not. Such detection would of course be a scientifically appealing discovery, and a number of claims have been made. However, the indirect evidence (of changes in the sulphur dioxide abundance in the atmosphere) has alter-native explanations. The claimed direct evidence of microwave (Bondarenko et al. 2010) and near-infrared (e.g., Shalygin et al. 2012) emission is subject in both cases to high false-positive susceptibility due to the background subtraction or modeling required to isolate a volcanic signature, and the claims are not widely con-sidered adequate evidence to assert discovery.
In fact, the investigations of lightning on Venus and of present-day volcanism have not only scientific and socio-logical similarities but also intersections. It is often pointed out that lightning discharges occur in the ash plumes of volcanos on Earth, and in fact, the lightning networks such as WWLN are now used to remotely monitor volcanic activity, as in the case of the 2015 eruption of the Chilean volcano Calbuco (Van Eaton et al.2016).
Some geographical associations of electric field signa-tures in Pioneer Venus data with regions on Venus were taken as circumstantial support of a volcanic lightning interpretation. However, the logic was in fact somewhat circular, and the associations were not statistically robust (e.g., Taylor Jr and Cloutier (1986). That said, such an association is not excluded either (e.g., Russell1991).
Observations on future missions able to locate the sources of electrical discharges without strong latitude, local solar time, or ionospheric propagation biases would be useful in assessing the possible association of lightning with highlands or volcanos specifically. Note, however, that a surface-fixed source of“lightning,” even associated with a surface feature interpreted to be vol-canic, is not a guarantee that active volcanism is occur-ring. A correlation could emerge in another way, for example, in that atmospheric motions that manifest near the Venus cloud tops are now known to occur in a surface-fixed reference frame, due to gravity waves ex-cited by topography (e.g., Fukuhara et al.2017).
Triboelectric discharges on Venus surface
It is striking that on only two occasions when small-scale surface changes could have been observed on Venus, namely in the roughly 1 h intervals between the successive image panoramas on each of the Veneras 13 and 14 landers, sediment transport was observed on one of these (Lorenz 2016). In contrast, typically one might (depending on location) need to wait for days or months to observe surface movement on Earth; similarly, only a few surface changes were observed on Mars by the Viking landers over several years.
It has been recognized that triboelectric charging may be an important effect on Titan (Lorenz2014; Mendez-Harper et al.2017) as well as Mars, in environments where the lack of surface electrical conductivity via liquid water prevents rapid charge leakage. In the dry high-pressure near-surface atmosphere of Venus, it will be even harder for the charge to leak away from triboelectrically charged sediments.
and Zimbelman2014), wind streaks are found over all lati-tudes and longilati-tudes.
Although we have little direct information on Venus’ near-surface winds, they are unlikely to be uniform— some places will be windier than others. Notably, slope winds due to diurnal heating will be strongest on large, steep slopes at low latitudes, and an evaluation (Dobrovolskis 1993) suggested two daily peaks in speed will occur, around 0600 and 1800 h local solar time (up-slope and down(up-slope respectively). Since sediment trans-port will be favored downhill, this predicted maximum in particle motion, and thus, triboelectric charging will occur in the evening, consistent with the apparent increase in observed electrical activity then compared with early morning. It should be underscored that the high pressure at Venus’ surface is a challenge to the prospect of dis-charges; however, in that, the breakdown field at these conditions is very high. In this respect, volcanic ash clouds may be more likely to yield discharges, since the charged dust in this case is lofted to a higher altitude where the breakdown field is lower.
Conclusions and recommendations for future surveys
This review reaches much the same conclusion as many before it, namely that more observational data are re-quired to make a robust assessment about atmospheric electrical activity on Venus. To date, the most compel-ling indications of some kind of persistent atmospheric electrical activity at Venus appear to be the VLF detec-tions by Veneras 11–14. The ELF emissions observed by Pioneer Venus, and perhaps more robustly by Venus Express, appear fully consistent with such electrical ac-tivity although they do have potential other explanations. As summarized in Table3, rates of activity seem broadly coherent among the quite different datasets.
Of the optical observations, the ground-based observa-tion by Hansell et al. (1995) appears the most significant in terms of robustness and area and time observed, al-though the very small number of flashes is challenging to interpret quantitatively. The Venera 9 observation has a number of aspects that make the interpretation diffi-cult and suggest a possible artifact. Circumstantially, the nondetection, or at least lack of reports of detected flashes, in a number of other datasets (Pioneer Venus star tracker, VEGA, Venus Express) indicates that flashes are not a prominently observable feature of Venus, al-though in some cases (Pioneer Venus, VEGA), the area and/or duration of the observation is small.
It is clear that a larger area-time product, desirably with a low optical energy detection threshold, is required to assert strong upper limits on, or to obtain secure sta-tistics of, what is likely to be a strongly spatio-temporally variable phenomenon. The present state of
the art of optical detections at Venus is somewhat simi-lar to the handful of orbits with a high detection thresh-old (totaling 4 h), as shown in the lower panel of Fig.11 for terrestrial data from the C/NOFS satellite—the inter-pretation of only a few flashes is challenging as any geo-graphical or temporal dependence is not statistically robust. It may be hoped that the Lightning and Airglow Camera (LAC) on Akatsuki may be operated for some time, yielding statistically useful numbers of detections. The rate of optical detections for an instrument at Earth viewing from about 1000 km altitude, and thus viewing about 1 million km2(e.g., FORTE, Kirkland et al. 2001) is of the order of 100–200 per hour. The eight initial LAC observations reported by Takahashi et al. (2018) cover a few million km2 for ~ 20 min, and thus, many detections would have been expected if the optical flashes comparable with terrestrial ones occurred at a terrestrial rate, given a total survey of 10~ 20 million km2-h. On the other hand, perhaps detectable Venus flashes may be as rare as terrestrial “superbolts” (~ 109J optical energy). Forty such flashes were seen (Turman 1977) in 2 months of long-distance observations, i.e., full-disk ~ 130 million km2, from the Vela satellites. Thus, the rate of these events is ~ 2 × 10⁻⁴ per million km2-h, and so, an instrument with observing opportunities like LAC (~ 20 min in each 10-day orbit) is unlikely to achieve a detection, even if in operation for a decade. The subtlety of planet-averaged lightning rates not representing the highly clustered (i.e., “conditional”) distribution of flashes (e.g., Fig.4) should be noted—it is not enough to stare with a very sensitive detector at only one place if that place does not see a storm. Thus, there remains high value in obtaining further LAC observa-tions. The question of irregular spatio-temporal sam-pling of an irregular spatio-temporal phenomenon such as lightning deserves further quantitative exploration, e. g., by Monte-Carlo simulations that can include, e.g., geographical, time of day, or other dependencies, but this is beyond the scope of the present review.
the triggering logic of an instrument like the LAC, or the exposure time of a camera, cannot be optimal for searching for lightning and for bolides simultaneously.
The superficially bland optical appearance of Venus and its interpretation as a uniform, unchanging atmosphere has given way to a much more variable perspective re-vealed in the near-infrared (for example by the Akatsuki 2-micron camera—see Fig.12); thus, it would not be sur-prising if the vertical motions required for charge separ-ation were as localized as they are on Earth. Not only might the diurnal distribution of lightning production be concentrated (e.g., dusk-midnight) but there may be a geographical preference (e.g., at volcanoes or downwind of large mountainous provinces that may produce uplift in gravity waves). There may also be a meteorological influ-ence on detection efficiency—e.g., lightning emissions may (as on Earth) be more easily detected at the edges of large convective storms, rather than at their center where the obscuring clouds may be thicker.
Above the ionosphere, surveys of whistler-mode signals from orbit have already been comparatively extensive, yield-ing results that remain broadly consistent from 1 year to the next, and between the Pioneer Venus and Venus Ex-press datasets. While further observations, e.g., from a low circular orbit, would have some value in refining geograph-ical and local time distributions, they are unlikely by them-selves to be any more persuasive to the broader community, or informative on the generation mechanism. A combin-ation of an ELF electrical/magnetic detection with another type (most obviously an optical sensor, but possibly gamma
ray, or even VHF radio) would be much more compelling (as performed on FORTE and C/NOFS at Earth—see, e.g., Fig. 5) and Suszcynsky et al. 2000. As noted by Russell (2011), a low circular polar orbit is desirable for radar mapping, and a modest lightning instrument would be a valuable but relatively inexpensive augmentation to a radar mapping mission. We may note that such combined optical and RF surveys of lighting (e.g., Light et al. 2001) at Earth have been performed on a rather small satellite platform (e.g., FORTE, 210 kg, flown in 1997).
Both the Pioneer Venus electric and the Venus Express magnetic whistler-mode observations have been made over ~ 10 years for each mission near periapsis (~tens of minutes during each 24 h orbit, or a duty cycle of ~ 2%). Thus, the total observing time is ~ 0.2 years. A radar map-per in a low circular orbit allowing continuous observation would require at least one Venus day (~ 0.7 years) and probably several to sweep through the full range of longi-tudes and relay the data. Thus, even allowing for lightning observations only at night, piggybacking a lightning pay-load on a mapping mission will yield a factor of several im-provements in observation duration for electromagnetic observations, with better geographical diversity, compared with prior surveys. An optical monitor on a low orbiter, with a ~ 25% duty cycle for night-time only operation, would yield a vastly longer observation time than has been possible to date (typically a few hours).
Below the ionosphere, a long-lived (months?) aerial platform like a balloon would be useful in having a much longer observation period than a surface probe, which will be limited to a few hours. The Venera results suggest that a simple instrument like Groza or the Galileo LRD (an instrument which even with the 1980s technology had a mass of 2.5 kg, a power demand of 3 W and an average data rate of only ~ 1 bit per sec-ond—Lanzerotti et al. 1992) would yield rich VLF data from an easily accommodated coil or loop antenna. A modern instrument, operating on a platform near the cloud tops (where temperatures and pressures are be-nign) could be implemented with a few hundred grams of hardware—it is basically an AM radio, and even only a week of operation would yield a dataset 100 times lar-ger than a probe descent like Venera. Optical detection on an airborne platform would likely have a much shorter range (tens of kilometers) due to atmospheric absorption and scattering but demands so little mass or power that a flash detector should probably be included anyway. A measure of the DC electric field would also be useful to assess fair weather electricity (e.g., the char-acter of the global electric circuit) and possible charging mechanisms; the vertical tether on a balloon is an obvi-ous platform on which to make a simple measurement.
The incremental value of further measurements on short-lived landers or probes is not obvious, unless
Fig. 12The deeper view into Venus’clouds afforded by near-infrared




![1,28-Di[(cholest-5-en-3 -yl)disulfanyl]-4,25-dioxo-3,8,](data:image/gif;base64,R0lGODlhAQABAIAAAP///wAAACH5BAEAAAAALAAAAAABAAEAAAICRAEAOw==)