International Journal of Science Technology
Management and Research
Available online at: www.ijstmr.com
IJSTMR
©
2017 | All Rights Reserved 1An Automatic Mass Detection System: A Review
Ms. Yugandhara .D. Patil 1 1
PG Student, Department of Electronics & Telecommunication Engineering, SES’s RCPIT, Shirpur
Prof. S. A. Patil 2 2
PG Professor, Department of Electronics & Telecommunication Engineering, SES’s RCPIT, Shirpur
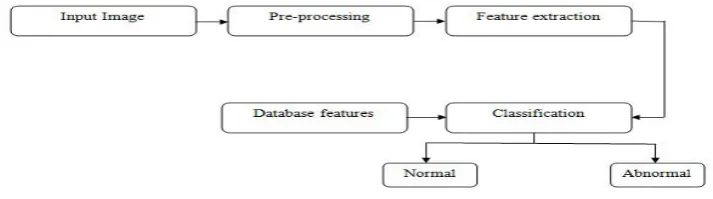
Abstract: Mammography is the best available examination for the detection of early detection of breast cancer. The most common breast abnormalities that may indicate breast cancer are masses and calcifications. This paper represent an algorithm which aims to assist the radiologist in identifying breast cancer at its earlier stages .It combines several image processing techniques like thresholding and segmentation techniques for detection of mass in mammograms .The algorithm is verified by using mammograms from mammographic image analysis society. This study represents Otsu segmentation method for foreground detection and gray level co-occurrence matrix method for feature extraction and PNN Classifier. Experiments were conducted on MIAS(Mammogram image analysis society) database.
Keywords: Probabilistic neural network, Mammographic mass detection, Otsu segmentation, gray level co-occurrence matrix.
I. INTRODUCTION
Breast cancer has been one of the most common forms of cancer in women. It is reported to be the second deadliest cancer among cancerous woman. CANCER refers to the uncontrolled multiplication of a group of cells in a particular location of the body. A group of rapidly dividing cells may form a lump, micro calcifications or architectural distortions which are usually referred to as tumors. Breast cancer is any form of malignant tumor which develops from breast cells. Breast cancers are traditionally known to be one of the major causes of death among women. Mortality rates due to breast cancer have been reducing due to better diagnostic facilities and effective treatments. One of the leading methods for diagnosing breast cancer is screening mammography. This method involves X-ray imaging of the breast. Screening mammography examinations are performed on asymptomatic women to detect early, clinically unsuspected breast cancer. The need for early detection of breast cancer is highlighted by the fact that incidence rates for breast cancer are one of the highest among all cancers according to the American Cancer Society which quotes a morbidity of 230 000 and a mortality of 40 000 according to the latest figures gathered for the American population.
Important signs to look for in the case of breast cancer are clusters of micro calcifications, masses, and architectural distortions. Following the results of screening mammography, a follow-up study is made for patients according to the level of suspicion of the abnormality. This stage is referred to as diagnostic mammography. Both screening mammography and diagnostic mammography are performed by radiologists who visually inspect the mammograms.
II. RELATEDWORK
Mammogram image has been in use for very long time and much research has been carried out by early researchers. They have used different types of algorithms for automatic computer aided diagnosis of MC(Micro calcification ) and mass.
IJSTMR
©
2017 | All Rights Reserved 2 Chen and Lee, used a multi-resolution wavelet analysis (MWA) and non-stationary Gaussian Markov random field (GMRF) technique for the detection of Mcs with high accuracy. The hierarchical multiresolution wavelet information in conjunction with the contextual information of the images extracted from GMRF provides an efficient technique for Mc detection. A Bayesian learning paradigm realized via the expectation-maximization (EM) algorithm was also introduced for edge detection or segmentation of mass regions recorded on the mammograms. The strength of the technique is in the effective utilization of the rich contextual information in the images considered.Wang and Karayiannis, in 1998, presented an approach for detecting microcalcifications in digital mammograms employing wavelet-based subband image decomposition. The Mcs appear in small clusters of few pixels with relatively high intensity compared with their neighboring pixels. These image features can be preserved by a detection system that employs a suitable image transform which can localize the signal characteristics in the original and the transform domain. Given that the Mcs correspond to high-frequency components of the image spectrum, detection of Mcs was achieved by decomposing the mammograms into different frequency subbands, suppressing the low-frequency subband, and, finally, reconstructing the mammogram from the subbands containing only high frequencies.
Ted Wang and Nicolas Karayiannis proposed , an approach for detecting Mcs in digital mammograms employing wavelet-based subband image decomposition. The Mcs appear in small clusters of few pixels with relatively high intensity compared with their neighboring pixels. These image features were preserved by a detection system that employs a suitable image transform which can localize the signal characteristics in the original and the transform domain. Given that the Mcs correspond to high-frequency components of the image spectrum, detection of Mcs was achieved by decomposing the mammograms into different frequency subbands, suppressing the low-frequency subband, and, finally, reconstructing the mammogram from the subbands containing only high frequencies.
In 1999, that breast cancer is one of the major causes of death among all cancers for middle-aged and older women, mainly in developed countries, and its incidence is rising was stated by Mossi and Albiol . Since the origin of this disease is not yet known, early detection is the best way to reduce the breast cancer mortality. Today, early detection is achieved by means of mammography. Radiologists look for certain signs and characteristics indicative of cancer when evaluating a mammogram. Among these signs is the presence of clustered Mcs. A Mc is a tiny calcium deposit that has accumulated in tissue in the breast, and it appears as a small bright spot on the mammogram. Due to a lot of mammograms, a radiologist must examine, there are many people developing computer-based systems to aid in the detection of the disease.
JongKookKim and Hyun Wook Park, in 1999, stated that Clustered Mcs on X-ray mammograms are an important sign for early detection of breast cancer. Texture analysis methods can be applied to detect clustered Mcs in digitized mammograms. Bruce and Adhami, 1999, specified multi-resolution analysis, specifically the discrete wavelet transform modulus maxima (mad max) method, was utilized for the extraction of mammographic mass shape features. These shape features were used in a classification system to classify masses as round, nodular, or satellite.
Raul Mata et al., in 2000, stated that the detection of clustered Mcs can aid radiologist to detect early breast cancer. Mcs exhibit some important characteristics, like its small size and high luminosity. So, a CAD method can be useful to avoid them being overlooked. In this paper, a multiresolution analysis was proposed by decomposing the image through a band-pass filter bank, so that each sub-band image become visible only the details at the given scale. Thereafter all the images will be combined with a final one in order to obtain an image that contains all the interest details at the scale where Mcs tend to appear. Once the image is obtained, it is necessary to determine which details col-respond with microcalcifications. Statistical analysis of the histogram permits to classify the susceptible zones of containing Mcs. Applying those statistics techniques over the whole image and representing the results in a 2-D map, clustered Mcs regions appear clearly distinguishable.
Lei Zheng and Andrew Chan, in 2001, stated that Cancerous tumor mass is one of the major types of breast cancer. When cancerous masses are embedded in and camouflaged by varying densities of parenchyma tissue structures, they are very difficult to be visually detected on mammograms. This paper presents an algorithm that combines several artificial intelligent techniques with the discrete wavelet transform (DWT) for detection of masses in mammograms.
IJSTMR
©
2017 | All Rights Reserved 3 cancer in the mammogram. The dogs-and-rabbits clustering algorithm was used to initiate the segmentation at the LL subband of a three-level DWT decomposition of the mammogram. A tree-type classification strategy was applied at the end to determine whether a given region is suspicious for cancer. The authors have verified the algorithm with 322 mammograms in the Mammographic Image Analysis Society Database. The verification results have shown that the proposed algorithm has a sensitivity of 97.3% and the number of false positive per image is 3.92.Bocchi et al., in 2004, stated that Micro calcifications are often early signs of breast cancer. However, detecting them is a difficult visual task and recognizing malignant lesions is a complex diagnostic problem. In recent years, several research groups have been working to develop computer-aided diagnosis (CAD) systems for X-ray mammography. In this paper, they have proposed a method to detect and classify micro calcifications.
MC clusters, particular attention is paid to the analysis of the spatial arrangement of detected lesions. A fractal model has been used to describe the mammographic image, thus, allowing the use of a matched filtering stage to enhance micro calcifications against the background. A region growing algorithm, coupled with a neural classifier, detects existing lesions. Subsequently, a second fractal model is used to analyze their spatial arrangement so that the presence of micro calcification clusters can be detected and classified.
Hernandez-Cisneros et al., in 2006, stated that breast cancer is one of the main causes of death in women and early diagnosis is an important means to reduce the mortality rate. The presence of Mc clusters are primary indicators of early stages of malignant types of breast cancer and its detection is important to prevent the disease.
Kuan-Yuei Li and Yu-Kun Huang, in 2006, stated that Clustered micro calcifications (MCs) in digitized mammograms has been widely recognized as an early sign of breast cancer in women. This work was devoted to developing a computer-aided diagnosis (CAD) system for
the detection of MCs in digital mammograms. Such a task actually involves two key issues: detection of suspicious MCs and recognition of true MCs. Accordingly, their approach was divided into two stages. At first, all suspicious MCs are preserved by thresholding a filtered mammogram via a wavelet filter according to the MPV (mean pixel value) of that image. Subsequently, Markov random field parameters based on the Derin–Elliott model are extracted from the neighborhood of every suspicious MCs as the primary texture features.
The literature shows different methods used for detecting MC in the mammogram. There is limited work done in implementing ANN algorithms for detecting MC. Hence, this thesis has implemented ANN algorithms for detecting MC. Researchers have developed many schemes for mammographic mass detection. recently proposed a system to examine mammograms for signs of tumor development without using previous mammograms as reference images. This system aged regions which had a 72% chance of developing a malignant mass by the time of the next screening.
III. DIFFERENT APPROACHES
A. Image Pre-processing
Demising and enhancement of mammograms are very important for both the manual inspection stage and for the computer-aided second reading stage. Preprocessing step is very necessary to improve the quality of the images and make the features extraction more reliable. To limit the region of search for suspicious detection, the breast region must be initially segmented from the image.
IJSTMR
©
2017 | All Rights Reserved 4B. Mammogram Segmentation
Image segmentation is one of the most fundamental and difficult problems in image analysis. Image segmentation is an important part in image processing. In computer vision, image segmentation is the process of partitioning an image into meaningful regions or objects. There are various applications of image segmentation like locate tumors or other pathologies, measure tissue volume, computer-guided surgery, treatment planning, study of anatomical structure, locate objects in satellite images and fingerprint recognition etc.
Image segmentation methods are categorized on the basis of two properties discontinuity and similarity. Based on this property image segmentation is categorized as Edged based segmentation and region based segmentation.
Thresholding is an important technique in image segmentation applications. The basic idea of thresholding is to select an optimal gray-level threshold value for separating objects of interest in an image from the background based on their gray-level distribution. While humans can easily differentiable an object from complex background and image thresholding is a difficult task to separate them. The gray-level histogram of an image is usually considered as efficient tools for development of image thresholding algorithms. Thresholding creates binary images from grey-level ones by turning all pixels below some threshold to zero and all pixels about that threshold to one. Otsu method is type of global thresholding in which it depend only gray value of the image. Otsu method was proposed by Scholar Otsu in 1979. Otsu method is global thresholding selection method, which is widely used because it is simple and effective.
C. Feature Extraction
After segmentation, some features are extracted to express the characteristics of the suspicious object region. Generally speaking, the intensity distribution of masses is an important characteristic for mass detection. Therefore, some pattern recognition methods use a gray-level co-occurrence matrix (GLCM) to extract characteristics. The idea behind GLCM is to describe textures by a matrix of pair gray-level appearing probabilities. Further, Haralick described fourteen statistics that can be calculated from a co-occurrence matrix with the intent of describing the texture of the image. The texture features are denied as follows: Entropy, Energy, Local homogeneous, Contrast, Intensity, Correlation, Inverse difference moment, Sum average, Sum of squares variance, Sum entropy, Difference entropy, Inertia, Cluster Shade, and Cluster Prominence .to figure out characteristic of a digital image able to numerically define its texture properties.
D. Classification
The PNN is trained with reference features set and desired output using new PNN command. Here, target 1 for normal, 2 for defect case is taken as the desired output. After the training, updated weighting factor and biases with other network parameters are stored to simulate with input features. At the classification stage, test image features are utilized to simulate with trained network model using the command. Finally, it returns the classified value as 1 or 2 based on that the decision will be taken as defect free metal or defective metal products.
CONCLUSION
Breast cancer is one of the major causes of death among women. Due to the wide range of features associated with breast abnormalities, some abnormalities may be missed or misinterpreted. There is also a number of false positive findings and therefore a lot of unnecessary biopsies. Computer-aided detection and diagnosis algorithms have been developed to help radiologists give an accurate diagnosis and to reduce the number of false positives. In this study typical steps in image processing algorithms have been extensively studied. The techniques in the field of computer-aided mammography include image preprocessing, image segmentation techniques, feature extraction, feature selection, classification techniques and features for mammograms. Further developments in each algorithm step are required to improve the overall performance of computer-aided detection and diagnosis algorithms. In image segmentation study, the overview of various segmentation methodologies applied for digital image processing is briefly explained. Texture analysis is a method to classify benign and malignant masses and to identify the micro-calcification in mammography. Finally, various texture analysis approaches for the detection of masses and micro-calcification in mammography have been discussed.
IJSTMR
©
2017 | All Rights Reserved 5REFERENCES
1. M. Heath, K. Bowyer, D. Kopans, R. Moore, and W. P. Kegelmeyer, " The digital database for screening mammography," in Proc. 5th Int. Workshop Digital Mammography, 2001, pp. 212-218
2. S. M. Astley, " Computer-based detection and prompting of mammographic abnormalities," Brit. J. Radiol., vol. 77, no. Suppl 2, pp. S194 " S200, 2004.
3. N. Elton, G. Tourassi, and A. Elmaghraby, " A concentric morphology model for the detection of masses in mammography," IEEE Trans. Med. Img., vol. 26, pp. 880-889, Jun. 2007
4. J. Grim, P. Somol, M. Haindl, and J. Danes, " Computer-aided evaluation of screening mammograms based on local texture models, " Trans. Img. Proc., vol. 18, pp. 765-773, Apr. 2009
5. M. Sami, R. Ward, J. Morgan-Parkes, and B. Palcic, " Image feature extraction in the last screening mammograms prior to detection of breast cancer," IEEE J. Sel. Topics Signal Process., vol. 3, no. 1, pp. 46-52, Feb. 2009
6. X. Gao, Y. Wang, X. Li, and D. Tao, " On combining morphological com- ponent analysis and concentric morphology model for mammographic mass detection, "IEEE Trans. Inf. Technol. Biomed., vol. 14, no. 2, pp. 266- 273, Mar. 2010
7. Shen-Chuan Tai, Zip-You Chen, andWei-TING Tsai " An Automatic Mass Detection System in Mammograms Based on Complex Texture Features", "IEEE Journal Of Biomedical and Health Informatics, Vol 18, No.2, march 2014.
8. S. H. Amroabadi, M. R. Ahmadzadeh, and A. Hekmatnia, "Mass detection in mammograms using GA-based PCA and Haralick feature selection," in Proc. 19th Iranian Conf. Electrical Engineering (ICEE), May 17–19, 2011,
9. K.-H. Ng, N. Jamal, and L. DeWerd, “Global quality control perspective for the physical and technical aspects of screen-film. Mammography image quality and radiation dose,” Radiation Protection Dosimetry, vol. 121, no. 4, pp. 445–451, 2006.
10. R. Mousa, Q. Munib, and A. Moussa, “Breast cancer diagnosis system based on wavelet analysis and fuzzy-neural,” Expert Systems With Applicat., vol. 28, pp. 713– 723, 2005.
11. A. K. Jain, R. P. W. Duin, and J. C. Mao, “Statistical pattern recognition: A review,” IEEE Trans. Pattern Anal. Machine Intell., vol. 22, no. 1, pp. 4–37, Jan 2000, 09/34.824819
12. R. Webb, Statistical Pattern Recognition, 2nd ed. New York, NY, USA: Wiley, 2002, 0470845147.
13. I. Christoyianni, A. Koutras, E. Dermatas, and G. Kokkinakis, "Computer-aided diagnosis of breast cancer in digitized mammograms," Computerized Med. Imag. Graphics, vol. 26, no. 5, pp. 309–319, Sep.–Oct. 2002, 10.1016/S0895-6111(02)00031-9, 0895-6111.
14. Nikhil R. Pal, Brojeshwar Bhowmick, Sanjaya K. Patel, Srimanta Pal and J. Das, “A multi-stage neural network aided system for detection of microcalcifications in digitized mammograms”, Neurocomputing, Vol. 71 pp. 2625– 2634, 2008.
15. Tsai N.C., Chen H.W. and Hsu S.L., “Computer-aided diagnosis for early-stage breast cancer by using Wavelet Transform”, Computerized Medical Imaging and Graphics, Vol. 35, pp. 1–8, 2011.
16. Wener BorgesSampaio, EdgarMoraesDiniz, Aristo fanes Correa Silva, Anselmo CardosodePaiva and MarceloGattass, "Detection of masses in mammogram images using CNN, geostatistic functions, and SVM", Computers in Biology and Medicine, Vol. 41, pp. 653– 664, 2011.
17. Stylianos D. Tzikopoulos, Michael E. Mavroforakis, Harris V. Georgiou, Nikos Dimitropoulos and Sergios Theodoridis, “A fully automated scheme for mammographic segmentation and classification based on breast density and asymmetry”, Computer Methods and Programs in Biomedicine, Vol. 102, pp. 47–63, 2011.