Exploring the Use of an Image-Based Approach to
Assessing Nutrition Behaviors
Brianna Routh Mary Jo Katras
Mary Marczak
University of Minnesota
Formative evaluation was conducted for the Personal Health Behaviors Overview (PHBO) survey to evaluate nutrition behaviors with image-based questions in low-income populations. Forty-nine low-income adults from nutrition education classes were invited to participate with n = 42 included in the analysis.
Participants completed the PHBO survey while an interviewer recorded observations. Upon completion, participants were asked questions regarding each PHBO survey item. Most participants completed the survey in an average of 4 minutes. The majority said the photographs of food made it easier to answer questions. Less than half indicated that the visuals depicting frequency made questions easier. While participant responses were aligned with the aims of the PHBO question being asked, some suggestions were offered for improvements of photographs. While this formative evaluation research indicates additional validation is necessary before use of these PHBO questions, the image-based simple question technique is a possible solution for efficient and effective nutrition assessments in low-income, limited literacy populations.
Keywords: nutrition assessment; visual aids; low-income population; photo; SNAP-Ed; nutrition evaluation; cognitive interview
Introduction and Background
When attempting to assess food and nutrient intake, researchers commonly use one or more of the following methods: (a) food records, (b) 24-hour recalls, and (c) food frequency
behaviors targeted by the program being delivered. To address these needs, the University of Minnesota Extension Center for Family Development conducted a formative evaluation using visual aids in a brief and easy to comprehend image-based Personal Health Behaviors Overview (PHBO) survey to assess selected eating behaviors in limited-resource populations.
The PHBO survey was designed to parallel existing SNAP-Ed evaluation tools, using a retrospective pre-post format and targeting key messages taught in the program. The PHBO survey was designed using photos and simple text to facilitate understanding, while still in a retrospective pre-post format to address the time and cost constraints of nutrition education classes. Participants were asked 12 questions about eating habits before and after completing the course. This innovative assessment technique uses simply worded statements, realistic
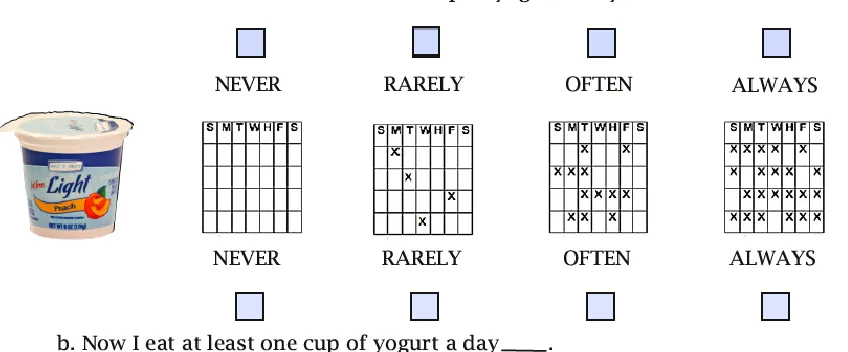
photographs (see Figure 1), and visual representations of frequency (see Figure 2) to assist participants in understanding the questions and selecting appropriate answers. The survey design was influenced by a format pioneered at the University of California Cooperative Extension (Townsend, Kaiser, Allen, Joy, & Murphy, 2003; Townsend, Sylva, Martin, Metz, & Wooten-Swanson, 2008a) to evaluate needed on-key messages taught in the SNAP-Ed program based on the 2010 Dietary Guidelines for Americans (U.S. Department of Agriculture [USDA] & U.S. Department of Health and Human Services [USDHHS], 2010). The survey was then tested using the technique of cognitive interviewing. Participants described how they interpreted each
question to provide an answer that would allow for further formative evaluation of the survey tool, individual questions, photos, and response-aiding visuals.
Figure 1 shows question 10 from the PHBO survey in the retrospective pre-post format with equivalency picture of an apple, carrots, and tomato to better inform participants on the 1-cup measuring cup size. Figure 2 shows question 4 from the PHBO survey with a photo visual of a 1-cup serving of yogurt and calendar-like frequency visuals to help interpret the frequency answer options.
Figure 2: Example of Visual Representation of Frequency from Personal Health Behaviors Overview Survey
The underlying premise of the PHBO is that pictures coupled with low-literacy level text can help facilitate a shared understanding of an idea or message in the Minnesota SNAP-Ed program. The University of California Cooperative Extension first conducted validity testing on 39 text-based Food Behavior Checklist (FBC) questions and found some statistically significant correlations between self-reported FBC intake and 24-hour recalls (r = 0.20-0.39) (Murphy, Kaiser, Townsend, & Allen, 2001). The FBC question, “How many servings of fruit do you eat each day?” correlated with blood serum carotenoid levels (r = 0.32) and servings of fruit intake in 24-hour recalls (r = 0.39) (Murphy et al., 2001), indicating the FBC yielded similar trends compared to validated dietary intake. From the 22 statistically significant questions, the 16-question pictorial FBC was developed to improve response accuracy in low-literacy populations by providing photos to accompany text questions regarding eating behaviors (Banna, Vera Becerra, Kaiser, & Townsend, 2010; Townsend et al., 2003, 2008a). The FBC did not, however, address retrospective frequency (current strategy used by MN SNAP-Ed evaluation system) or serving size, and it did not provide questions addressing all Minnesota SNAP-Ed key messages, such as whole grain consumption, calcium intake, and physical activity (Sylva, Townsend, Martin, & Metz, 2006; Townsend et al., 2005).
(Townsend et al., 2008a, 2008b). Minnesota SNAP-Ed again modified these two questions to address retrospective pre-post frequency by altering the wording in order to align with the
current evaluation strategy. The survey tool was offered only one time to increase response rates and decrease response shift bias, where participants respond based on what they think the
facilitator would like due to limited understanding of concepts on a pretest (Raidl et al., 2004). These revised questions were then piloted with over 14,000 Minnesota Extension health and nutrition class participants during the 2011 fiscal year. Based on observation data collected from educators facilitating the course, these questions could be administered quickly and showed retrospective incremental increases in fruit and vegetable intake, prompting further exploration of the use of picture-based nutrition questions.
The PHBO survey was developed to include additional pictorial questions addressing the 2010 Dietary Guidelines for Americans(USDA & USDHHS, 2010), such as increasing consumption of low-fat dairy, calcium-rich foods, whole grains, and fruits and vegetables; increasing physical activity; and increasing use of the nutrition facts panel when shopping. For formative evaluation, multiple questions were developed to assess Minnesota SNAP-Ed key messages. Questions on dairy fat content, food labels, fruits, and vegetables were modified from the pictorial FBC (Sylva et al., 2006; Townsend et al., 2005). Eight questions were modified from previously used
Minnesota SNAP-Ed evaluations or were written de novo based on commonly eaten foods that might address a key behavior on whole grain consumption, calcium intake, or physical activity. Although physical activity may not be considered in some nutrition assessments, it was included in this assessment as it relates to the Dietary Guidelines and SNAP-Ed key messages (USDA & USDHHS, 2010). All questions were modified into the retrospective pre-post survey format to provide simplified wording, multiple amount or frequency options, and realistic visuals. Figures 1 and 2 show the format used in this stage of development. The Flesch-Kincaid equation
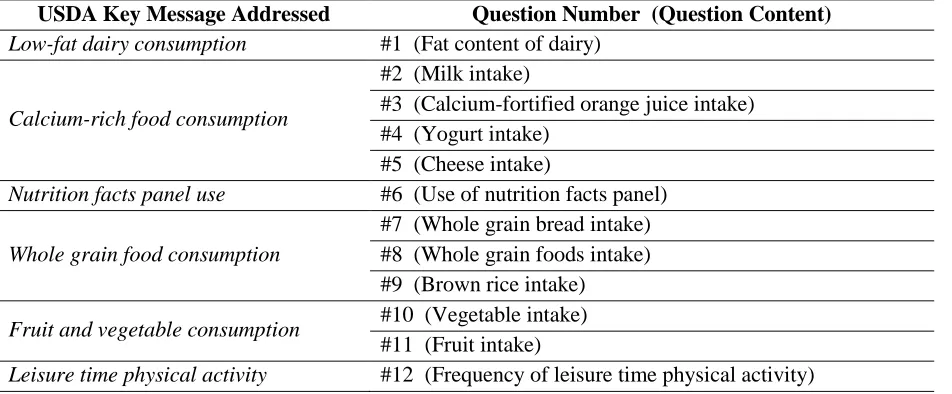
(Flesch, 1948) was used to determine reading level of each question. The questions averaged a third-grade reading level. One question on physical activity was at the eighth-grade level, while all other text was below the fifth-grade reading level. Table 1 illustrates not only the subject matter of each question but also the USDA key message it was intended to address.
Table 1. Personal Health Behaviors Overview of Question Content Related to USDA Messages
USDA Key Message Addressed Question Number (Question Content)
Low-fat dairy consumption #1 (Fat content of dairy)
Calcium-rich food consumption
#2 (Milk intake)
#3 (Calcium-fortified orange juice intake) #4 (Yogurt intake)
#5 (Cheese intake)
Nutrition facts panel use #6 (Use of nutrition facts panel)
Whole grain food consumption
#7 (Whole grain bread intake) #8 (Whole grain foods intake) #9 (Brown rice intake)
Fruit and vegetable consumption #10 (Vegetable intake)
#11 (Fruit intake)
Leisure time physical activity #12 (Frequency of leisure time physical activity)
Development of Questions
This article will explore the utility and viability of the developed PHBO survey for community nutrition education programs, such as SNAP-Ed, using cognitive interviews. In order to explore whether the photos and simple text used in the PHBO survey facilitate understanding and address some of the limitations of traditional tools, we explored the following questions:
Can the tool be completed quickly in a classroom setting?
Do SNAP-Ed participants understand the intended meaning of the questions, answers, and visuals in the tool?
Based on feedback of the survey, what changes to the survey would be necessary to make it more effective?
Methods
Recruitment
The aim was to recruit at least 40 adults participating in a Minnesota Extension SNAP-Ed
program. Five SNAP-Ed classes from four sites were selected for recruitment. The classes were selected in part to assure a diverse set of participants with respect to age, race, ethnicity, and population density. The classes included a Head Start parent class in rural Minnesota, an all-male and an all-feall-male substance abuse recovery class from an urban area, a senior living
they were familiar. They were told about the study and invited to participate; if they agreed, they met with an interviewer to give informed consent. Since they were in different programs and at different points of education, the response sample varied on knowledge of basic nutrition information. Participants received a $20 incentive for participating in the study, with inclusion criteria being all adults (18 or older) without language barriers.
In the senior living facility, the Head Start program, and the emergency food shelf, all participants in attendance on the recruitment day were invited to participate. The recovery classes were much larger in participant numbers and had rolling enrollment. To keep
recruitment even, with approximately 6 to 10 participants from each class, the course instructor invited all of those graduating during that class session to participate. Approximately 3 to 5 people graduated each session, and interviewers were present at two different sessions for both the male and female recovery classes.
Of the 49 adults invited to participate, 5 declined participation and 2 were excluded based on selection criteria (1 was under 18, and 1 had a language barrier). Forty-two participants completed the interview process and were included in the analysis.
Data Collection
Prior to data collection, all potential participants were given a written copy of consent including the purpose and use of this study. Interviewers reviewed the contents of the consent aloud to additionally ensure participant understanding, and participants signed if they consented to participate. Participants were instructed to complete the PHBO survey and ask any questions they may have while completing it. One of two trained Master of Public Health student interviewers was present to individually record and answer questions asked during the PHBO survey. The time it took participants to complete the survey was recorded to the nearest minute using a watch or laptop clock. Additionally, the interviewer observed participants individually taking the survey to determine if they were completing it in a linear or nonlinear format (i.e., skipping questions or referring back to previous questions may signal confusion or lack of clarity).
interviews typed participants’ responses into a Word document on a laptop computer during the interview.
Data Analysis
The data from the cognitive interviews were qualitatively analyzed via Richard Krueger’s
Classic Analysis Strategy to identify response themes (Krueger & Casey, 2008). Using an Excel document with individual responses to each cognitive interview question, responses were then grouped into these themes: (a) accuracy in understanding question intent, (b) suggested changes to improve wording or visuals, and (c) applicability of PHBO question content to their diet (Krueger & Casey, 2008). These themes were further grouped into potential revisions to the PHBO survey questions. All responses were coded by the primary investigator and an additional investigator not involved in data collection to strengthen the integrity of the coding process. Due to the relative simplicity of responses, there were no discrepancies in coding between the
primary and secondary coders.
Results
The self-reported demographics of participants in the cognitive interview process are listed in Table 2. The 42 interviews were included, with later interviews generating similar comments to earlier interviews and no new themes emerging. Ninety-eight percent of participants completed the 12 PHBO survey questions in a linear format in an average of 4 minutes (ranging from 2 to 10 minutes). Depending on the photograph, a majority of participants said the photographs of foods made it easier to answer questions. The only question where less than half (48%) of participants found the photographs helpful was on fortified orange juice. This was also a question where participants reported very low consumption and difficulty accurately describing what fortified meant, which potentially skewed the results. Some participants (42% for the calendar-like visual and 48% for the pie chart representation) thought that the frequency visuals made it easier to answer questions, with less than 10% indicating the frequency visuals made answering the question more difficult. Most of the participants were neutral about the helpfulness of the frequency pictures and stated they did not pay attention to them when answering the question. While, in general, participant responses were reflective of the aims of the PHBO question being asked and provided self-reflective responses about habits, they also offered many suggestions for improvements. Upon completing the survey, of the 18 participants who had closing overall comments on the PHBO survey, 17 had positive comments. One
Table 2. Demographics and Characteristics of Personal Health Behaviors Overview Cognitive Interviewees
Characteristics n %
Education
Less than High School Diploma 7 16.7
High School Diploma or Equivalent 15 35.7
Some College 13 30.9
Associate’s Degree 4 9.5
Bachelor’s Degree 2 4.8
Unknown 1 2.4
Sex
Female 30 71.4
Male 12 28.6
Ethnicity
Hispanic or Latino/a 3 7.1
Non Hispanic or Non Latino/a 39 92.9
Race
African American 11 26.2
Caucasian 24 57.1
Mixed Race 2 4.8
Other 2 4.8
Unknown 3 7.1
First Generation Immigrant
Yes 2 4.8
No 40 95.2
First Language English
Yes 41 97.6
No 1 2.4
Age
Average Age, years 41.0
Range, years 18-85
Table 3. Personal Health Behaviors Overview Question Content and Recommended Revision
Question
Content (#) Text Revision Photo Revision
Equivalent Revision
Additional
Questions Remove
Key Message: Low-fat Dairy Consumption
Fat content of dairy (#1)
Clarify if about milk or dairy
Change photo if
on milk only
Milk intake
(#2)
Photos on same
page
Calcium-fortified orange juice intake (#3)
Low intake of
“fortified”
Yogurt intake
(#4) Low intake
Cheese intake (#5) Different wording for “ounce” Different photo for ounce of cheese
Photos on same
page
Key Message: Nutrition Facts Panel
Use of nutrition
facts panel (#6)
Multiple needed on specifics
Key Message: Whole Grain Food Consumption
Whole grain bread intake (#7) Determine if definition of whole grain affects results Whole grain foods intake (#8) Determine if definition of whole grain affects results Include more types whole grains Brown rice
intake (#9) Low intake
Key Message: Fruit and Vegetable Consumption
Vegetable
intake (#10)
Include a measuring cup Test different questions Fruit intake (#11) Include a measuring cup Test different questions
Key Message: Leisure Time Physical Activity
Frequency of physical activity (#12)
One problem area was wording of some questions where participants stated they were confused on the topic, or their responses in the cognitive interview indicated lack of clarity because of the varied responses. Four participants suggested clarification as to whether they were supposed to respond only about milk or about the fat content of all dairy products in question 1 on the fat content of dairy. In the cognitive interview for PHBO question 9, participants were asked how they knew if something was whole wheat. Based on the diversity in responses, participants may not be accurately identifying whether they are consuming whole wheat products. One stated, “You can tell by the color, and the words on the package”; another stated, “I have been told to look at the label [and it should] not have enriched be part of the first few ingredients”; and yet another said, “The hulls have to be visible [in the product].”
Participants indicated that using different photographs or changing photograph content may be more helpful in clarifying the meaning of some of the difficult or misinterpreted questions. The picture of a cheese stick in question 5 about cheese intake confused a number of participants (n = 7) because they thought it looked like a stick of butter. They recommended changing the photo to improve the question.
Many of these comments were also related to the layout of the questions and food photographs to be used on that particular question. A variety of the questions were asking about specific
quantities of foods consumed with equivalency pictures offered to give participants multiple visuals to use when determining an answer. During the interview process, participants noted that it would have been more beneficial for the equivalency photos to be provided on the same page as the question to which they referred. One participant was not sure what the equivalency pictures of measuring cups filled with milk were supposed to be used to answer. The question was on the subsequent page to the pictures due to limited space in formatting. During the analysis process, researchers also found an inconsistency with the questions on fruit and vegetable intake and the equivalency photos. They included photos of one serving of an apple, carrots, and a tomato but did not include an example of a 1-cup measuring cup containing fruits and/or vegetables the way other questions with equivalency photos did.
determined their answers based on the number of times or meals where they ate fruits or vegetables, while others determined an answer based on the amount they prepared and ate.
Finally, the interviews also indicated some questions were not relevant to the current diets of the study participants. When asked how they came up with an answer to Question 3 on calcium-fortified orange juice intake, responses indicated that participants were reporting orange juice consumption, but they were not always aware of whether the orange juice was fortified. While some participants knew if their orange juice was fortified, under half of the participants (n = 17) stated the orange juice they purchase is fortified, while a number of participants (n = 7) stated they did not buy fortified orange juice. On question 4 and question 9, about yogurt and brown rice intake, respectively, there were no significant results, as most participants indicated they did not regularly or had never consumed these products.
Discussion
Based on the cognitive interview responses, participants reported liking this short, image-based survey and found it easy to complete. The short completion time and reported ease of
completion indicate that the PHBO survey or a similar tool could be completed quickly in an adult classroom setting. Although this study took a sample of the SNAP-Ed population, which includes low-income and anecdotally lower-literacy populations, literacy of participating individuals was not specifically assessed. Based on the National Assessment of Adult Literacy, three out of four food stamp or SNAP recipients perform in the lowest two literacy levels (Begin to Read, n.d.). While the lowest literacy SNAP recipients may have chosen not to attend SNAP-Ed classes or participate in the survey, the sample of SNAP-SNAP-Ed participants is likely to contain moderate- to low-literacy participants. Since participants were all able to complete the survey relatively quickly, it should be noted that participants were all likely able to read at least moderately well at a fifth-grade level as evidence by the reading level of the majority of the questions.
As this was a limited formative evaluation study, the PHBO survey would benefit from additional research and revision. The revisions of these questions should include further formative evaluation and validation and will likely produce more accurate responses from participants. To address the key USDA nutrition guidelines, additional questions on alternative products should be tested (i.e., fortified soy milk or fortified cereals to assess calcium or oatmeal to assess whole grains). Further testing is also needed to look at alternative methods for
frequency visuals to elicit a higher rate of use. Validation of survey results correlated to standard dietary assessment tools is needed, as well as a comparison of this style/format of assessment to similar types of assessment for specifically low-literacy populations. A wide variety of limited-resource Minnesotans was sampled in this study, but additional validation is needed. This would assure the usability, reliability, and cultural acceptance of the PHBO survey in other audiences. As very few picture-based dietary assessments have been tested or used, more testing is needed to ensure results are accurate. Specifically, more development is needed for these particular survey questions, but initial results show that this simple text- and visual-based assessment method could be a promising technique for further exploration.
Implications for Research and Practice
Findings from the cognitive interview development of the PHBO survey indicate that this
innovative image-based technique is a potentially viable way to improve participants’ acceptance and understanding of evaluation tools for community-based nutrition education efforts. With more research, the PHBO survey or similar image-based tools could be a quick and inexpensive strategy to assess specific dietary habits in limited-resource, limited-literacy populations. While not all results from the PHBO survey may be adopted in their current form, findings from this study will facilitate changes and adaptations, as these results indicate the use of photos and some graphics may improve survey understanding in this targeted population. Currently, the revised PHBO survey questions on fruits and vegetables are being retested for concurrent validity with other fruit and vegetable assessments, such as 24-hour dietary recalls.
More broadly, these findings have implications for community-based nutrition educators
References
Banna, J. C., Vera Becerra, L. E., Kaiser, L. L., & Townsend, M. S. (2010). Using qualitative methods to improve questionnaires for Spanish speakers: Assessing face validity of a Food Behavior Checklist. Journal of the American Dietetic Association, 110(1), 80–90. doi:10.1016/j.jada.2009.10.002
Begin to Read. (n.d.). Literacy statistics. WriteExpress Corporation. Retrieved from http://www.begintoread.com/research/literacystatistics.html
Flesch, R. (1948). A new readability yardstick. Journal of Applied Psychology, 32(3), 221–233. doi:10.1037/h0057532
Gibson, R. S. (2005). Principles of nutritional assessment (2nd ed.). New York, NY: Oxford University Press.
Krueger, R. A., & Casey, M. A. (2008). Focus groups: A practical guide for applied research (4th ed.). Thousand Oaks, CA: Sage Publications.
Murphy, S. P, Kaiser, L. L., Townsend, M. S., & Allen, L. H. (2001). Evaluation of validity of items for a Food Behavior Checklist. Journal of the American Dietetic Association, 101(7), 751–761. doi:10.1016/S0002-8223(01)00189-4
Nápoles-Springer, A. M., Santoyo-Olsson, J., O’Brien, H., & Stewart, A. L. (2006). Using cognitive interviews to develop surveys in diverse populations. Medical Care, 44(11), S21–S30. doi:10.1097/01.mlr.0000245425.65905.1d
Raidl, M., Johnson, S., Gardiner, K., Denham, M., Spain, K., Lanting, R., Jayo, C., Liddil, A., & Barron, K. (2004). Use retrospective surveys to obtain complete data sets and measure impact in Extension programs. Journal of Extension, 42(2), Article 2RIB2. Retrieved from http://www.joe.org/joe/2004april/rb2.php
Sylva, K., Townsend, M. S., Martin, A., & Metz, D. (2006) University of California Food Behavior Checklist. University of California Cooperative Extension. Retrieved from http://Townsendlab.ucdavis.edu
Townsend, M. S., Kaiser, L. L., Allen, L. H., Joy, A. B., & Murphy, S. P. (2003). Selecting items for a Food Behavior Checklist for a limited-resource audience. Journal of Nutrition Education and Behavior, 35(2), 69–82. doi:10.1016/S1499-4046(06)60043-2
Townsend, M. S., Sylva, K., Martin, A., Metz, D., & Wooten-Swanson, P. (2008a). Improving readability of an evaluation tool for low-income clients using visual information processing theories. Journal of Nutrition Education and Behavior, 40(3), 181–186. doi:10.1016/j.jneb.2007.06.011
Townsend, M. S., Sylva, K., Young, T., Davidson, C., Martin, A., & Nicholson, Y. (2008b). Meeting ‘MyPyramid’ guidelines with low-literate consumers: From servings to cups. Seventh Annual Conference of the International Society of Behavioral Nutrition & Physical Activity Program and Abstracts, G1B, 70.
U.S. Department of Agriculture (USDA) & U.S. Department of Health and Human Services (USDHHS). (2010). Dietary guidelines for Americans, 2010 (7th ed.). Washington, DC: U.S. Government Printing Office.
Brianna Routh, MPH, RD, spent 2 years as an Extension educator with the University of
Minnesota in the Center for Family Development. Routh led this research and dissemination as a part of her master’s thesis from the University of Minnesota College of Public Health. She is currently working on her Ph.D. in Human Development and Family Studies with Iowa State University.
Dr. Mary Jo Katras is an Associate Professor and Extension educator in the Center for Family Development with the University of Minnesota Extension. Her teaching, research, and outreach focuses on building healthy and strong families by examining the intersection between health, poverty, and financial capabilities at the individual, family, and community levels.
Dr. Mary Marczak directs the Applied Research and Evaluation unit at the University of Minnesota Extension Center for Family Development, where she has evaluated over 70 family and youth programs including national and statewide initiatives, as well as local programs run by small, nonprofit organizations. She holds a B.A. in Psychology and a Ph.D. in Family Studies and Human Development from the University of Arizona, Tucson.
Acknowledgements
Research for the Personal Health Behavior Overview was funded by the University of Minnesota Extension Service and a J. B. Hawley Student Research Award through the University of