Available Online at www.ijpret.com 391
INTERNATIONAL JOURNAL OF PURE AND
APPLIED RESEARCH IN ENGINEERING AND
TECHNOLOGY
A PATH FOR HORIZING YOUR INNOVATIVE WORK
A REVIEW ON “STUDY AND ANALYSIS OF HYPERSPECTRAL IMAGES”
S. S. MONDHE, DR. S. V. RODE
Department of Electronics and Telecommunication, Sipna College of Engineering & Technology, Amravati, India
Accepted Date: 15/03/2016; Published Date: 01/05/2016
\
Abstract: The project titled as “Study and Analysis of Hyperspectral Images” describes the acquisition
of information from the far object without coming it physical contact it is called Remote Sensing.
With help of remote sensing it possible to detect the object which made up of different material
having different chemical composition according to that they reflect, absorb & emit electromagnetic
radiation .we can obtain spectral signature if we use the energy of radiation as function of
wavelength it used to identify any material .The measurement & analysis of spectra it which obtained
under the subject of spectroscopy. The imaging technology & spectroscopy this two technique are
combine to cover large area to acquire detail information it known as imaging spectroscopy it also
called as hyperspectral remote sensing. This is the new technique to detect vegetation, minerals.
Keywords–Hyperspecral image Remote sensing, spectroscopy, spectra
Corresponding Author: S. S. MONDHE Access Online On:
www.ijpret.com
How to Cite This Article:
S. S. Mondhe, IJPRET, 2016; Volume 4 (9): 391-396
Available Online at www.ijpret.com 392
INTRODUCTION
In hyperspectral remote sensing hyper mean too many wavelength band .This image provide the spectral information due to this identify the unique material is possible In the hyperspectral images there is high correlation between band .The image provide more accurate information.
The aim of remote sensing is to extract the information from the object & present it in way that we easily analyzed it. The hyperspectral imagery& multispectral imagery are both powerful tool in the remote sensing sector .within the electromagnetic spectrum .all spectral band is not available for purpose of remote sensing. Hyperspectral data set will be compare of 100 to 200 spectral band have narrow bandwidth & multispectral data set which possess 5-10 band of larger bandwidth .The analysis of multispectral image depend upon shape,texture &spectral property in few wavelength band in which image is acquired so it is not possible to identify the unique material or any element in soil
For this purpose hyperspectral remote sensing is used which provide the spectral characteristic of the object .hyperspectral image are spectrally over determine due to that it is easy to identify & distinguish the object which is spatially similar looking but having spectral changes The hyperspectral remote sensing era began in 1970 .where AVIRIS was propose to NASA in 1983 .which on aircraft platform, where the first space born Hyperion sensor have 10 nm bandwidth & give the range of 400-2500 m
LITERATURE REVIEW
Available Online at www.ijpret.com 393 select for analyzed the relation between nutrient & soil spectral feature. The inversion model of nitrogen & organic matter established by linear regression. The result show that nitrogen & organic matter retrieve from remote sensing. [4] Lin Qiu proposed Soil macropore are important migration passage for water &air in soil. The proper amount of soil macropore in soil increase soil permeability, improve rhizosphere environment & increase water tension capacity, but excess of macropore waste in rainfall, irrigation & pollution of ground water. To understand the monitoring of water quality & mechanism of solution solute transportation. We need to know about spatial distribution of soil macropore. Measurement of soil pore is very difficult. So in this paper we study measurement of macropore by using dye tracing & image analysis (DTIA) with paddy soil from the Tai Lake region as case study. Brilliant blue solution is used as dye solution was poured into soil study area .after one days dyeing vertical solution were dug & photograph. The photograph is taken by digital camera process software ERDAS IMAGINES 9.0 is used for analysis. [5] Peng Lu proposed Soil characteristic are analyzed by using conventional method are very time consuming, expensive. Hence objective of paper to estimate soil organic carbon by using VIS-NIR spectroscopy & map SOC in bare soil hyperion reflectance data. [6] Qinhong Liao proposed the estimation of soil organic matter is very important in agriculture production but determination of soil organic matter is very costly & time consuming .recently hyperspectral diagnosis technique is used to measured soil organic matter. Because it’s rapid, non destructive characteristics. Four method are used to determined the fluvo-aquic soil organic matter in soil but R2 was only 0.09. As Nonel method the Discrete Cosine Transform as prefer on each of soil reflectance spectra .the estimation model had been effectively built by using spectra indices .this method is also used for estimation of soil nutrient such as nitrogen, phosphorus, potassium and other.
PROPOSED METHODOLOGY
Available Online at www.ijpret.com 394 identify smallest of band. There are two method feature selection & feature reduction by using data transformation.
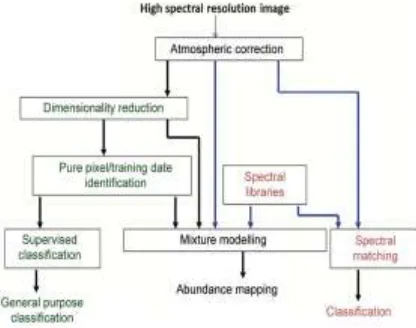
Figure 1:- Basic diagram of the proposed system for hyperspectral image analysis.
For the use of data which taken from the satellite & other platform .some extraction technique are needed .so classifier which transform continuous data into categorical class. The maximum likehood is classifier is generally used .The classification technology such as neural network, spectral mapper, support vector machine, linear &non linear spectral unimixing.
CONCLUSION
Hyperspectral imagery give opportunity to extract the information which is more detail than multispectral imagery. The availability of hyperspectral analysis tool is good & these tool are become easier to use .This paper give various method of hyper spectral image analysis .and different model for the atmospheric correction & various method for classification, feature selection, reduction. This project is found very advantages & convenient for hyper spectral image analysis
References
1. B. Krishna Mohan And Alok Porwal “Hyperspectral Image Processing And Analysis”
Hyperspectral Remote Sensing Current Science, Vol. 108, No. 5, 10 March 2015.
2. Edward M. Barnes, Kenneth A. Sudduth “Remote- and Ground-Based Sensor Techniques to
Available Online at www.ijpret.com 395
3. XUE Lianqinq LI Dan HUANG Shuo WU Chunlin “Spatial variability Analysis on Soil Nitrogen
and Phosphorus Experiment Based on Geostatisics” 2008 International Workshop on Education
Technology and Training & 2008 International Workshop on Geoscience and Remote Sensing .
4. Lin Qiu ,Xiaomin Chen “In situ measurement of soil macropores by dye tracing and image
analysis”.
5. Peng Lu, Zheng Niu, Linghao Li “Prediction of soil organic carbon by hyperspectral remote
sensing imagery” 2012 Third Global Congress on Intelligent Systems.
6. Qinhong Liao, Jihua Wang “Estimation of Fluvo-aquic Soil Organic Matter from
Hyperspectral Reflectance by Using Discrete Wavelet Transformation”.
7. J. B.Adams, M. O. Smith, and A. R. Gillespie. Remote geochemical analysis: Elemental and
mineralogical composition. In C. M. Pieters and P. A. J. Englert, editors, Imaging spectroscopy:
Interpretationbased on spectral mixture analysis, pages 145-166, Cambridge, 1993. Cambridge
University Press.
8. R. J. Adler, R. E. Feldman, and M. S. Taqqu. A Practical Guide to Heavy Tails: Statistical
Techniques and Applications. Birkhauser, Boston, 1998.
9. C. Chang, X. Zhao, M. Althouse, and J. Pan. Least squares subspace projection approach to
mixed pixel classification for hyperspectral images. IEEE Trans, on Geoscience and Remote
Sensing,36(3):898-912, May 1998.
10.W. H. Farrand and J. C. Harsanyi. Discrimination of poorly exposed lithologies in imaging
spectrometerdata. Journal of Geophysical Research, 100(E1):1565-1578, January 1995.
11.K. T. Fang, S. Kotz, and K. W. Ng. Symmetric Multivariate and Related Distributions.
Chapman and Hall, New York, 1990.
12.E. Conte, M. Lops, and G. Ricci. Asymptotically optimum radar detection in
compound-Gaussian clutter. IEEE Trans, on Aerospace and ElectronicSystems, 31(2):617-625, 1995.
13.W. Chen and I. S. Reed. Anew CFAR detection test for radar. Digital Signal Processing,
1(4):198-214,1991.
14.O. P. Cheremisin. Efficiency of an adaptive algorithm with regularization of the sample
Available Online at www.ijpret.com 396
15.Y Bresler. Maximum likelihood estimation of a linearly structured covariance with