doi:10.4236/jwarp.2009.14033 Published Online October 2009 (http://www.SciRP.org/journal/jwarp/).
Multi Objective Multireservoir Optimization
in Fuzzy Environment for River Sub Basin Development
and Management
D. G. REGULWAR1,*, P. Anand RAJ2 1
Department of Civil Engineering, Government College of Engineering, Aurangabad, India 2
Water & Environment Division, Department of Civil Engineering, National Institute of Technology, Warangal, India
E-mail: [email protected]
Received June 19, 2009; revised July 19, 2009; accepted July 22, 2009
Abstract
In this paper, a multi objective, multireservoir operation model is proposed using Genetic algorithm (GA) under fuzzy environment. A monthly Multi Objective Genetic Algorithm Fuzzy Optimization (MOGAFU-OPT) model for the present study is developed in ‘C’ Language. The GA parameters i.e. population size, number of generations, crossover probability, and mutation probability are decided based on optimized val-ues of fitness function. The GA operators adopted are stochastic remainder selection, one point crossover and binary mutation. Initially the model is run for maximization of irrigation releases. Then the model is run for maximization of hydropower production. These objectives are fuzzified by assuming a linear membership function. These fuzzified objectives are simultaneously maximized by defining level of satisfaction () and then maximizing it. This approach is applied to a multireservoir system in Godavari river sub basin in Ma-harashtra State, India. Problem is formulated with 4 reservoirs and a barrage. The optimal operation policy for maximization of irrigation releases, maximization of hydropower production and maximization of level of satisfaction is presented for existing demand in command area. This optimal operation policy so deter-mined is compared with the actual average operation policy for Jayakwadi Stage-I reservoir.
Keywords:Optimization, Multi Objective Analysis, Multireservoir, Genetic Algorithms, Fuzzy Logic,
Reservoir Operation
1. Introduction
In river basin studies, reservoir systems have their unique aspects and a variety of mechanisms are used in defining their operating rules [1]. Most of the water resources optimization problems involve conflicting objectives. The operation of a multi-purpose, multireservoir system consists of conflicting goals and requirements and con-sequently, several practical operating scenarios may exist. However, there are no standard operating rules, which are applicable to all situations. The successful manage-ment and operation of any reservoir system, therefore, lies in the ability to select the appropriate operating pol-icy from amongst the available set of policies. Yeh [2] reviewed reservoir management and operation models. Optimal coordination of the many facets of reservoir systems requires the assistance of computer modeling
tools to provide information for rational management and operational decisions. Labadie [3] has reviewed state- of-the-art in optimization of multi reservoir systems.
272 D. G. REGULWAR ET AL.
scenarios. Chang and Yang [9] have presented optimiz-ing the rule curves for multi-reservoir operations usoptimiz-ing a genetic algorithm and HEC-5. Srinivasa Raju and Nagesh Kumar [10] have discussed application of ge-netic algorithms for irrigation planning. GA was used to determine optimal cropping pattern for maximizing benefits for an irrigation project. Juran Ali Ahmed and Arup kumar Sarma [11] have demonstrated genetic algo-rithm model for finding the optimal operating policy of a multipurpose reservoir. Multireservoir operation plan-ning using hybrid GA and linear programming have been presented by Reis et al. [12].They have proposed a new
approach using GA and LP to determine operational de-cisions for reservoirs of a hydro system throughout a planning period, with the possibility of considering a variety of equally likely hydrologic sequences represent-ing inflows. Jothiprakash and Ganeshan Shanthi [13] have developed GA model and applied to Pechiparai reservoir in Tamil Nadu, India to derive the optimal op-erational strategies. The fundamental guidelines for GA to optimal reservoir dispatching have been presented by Chang Jian-Xia et al. [14]. They have concluded that
with three basic operators selection, crossover and muta-tion GA could search the optimum solumuta-tion or near-op-timal solution to a complex water resources problem. They have also considered alternative formulation schemes of GA. Reis et al. [15] have demonstrated a
hybrid method using GA and linear programming to de-termine operational decisions for a reservoir system over the optimization period. A multi-objective Evolutionary Algorithm (MOGA) to derive a set of optimal operation policies for a multipurpose reservoir system have been presented by Janga Reddy and Nagesh Kumar[16]. One of the main goals in multiobjective optimization was to find a set of well distributed optimal solutions along the pareto front.
Anand Raj [17] has presented multicriteria methods in river basin planning. ELECTRE-I and ELECTRE-II techniques were applied for water resources planning to Krishna river basin, India. Anand Raj and Nagesh kumar [18] have presented ranking of river basin alternatives using ELECTRE. Anand Raj and Nagesh kumar [19] have presented planning for sustainable development of a river basin using fuzzy logic. Simonovic [20] discussed tools for water management. He discussed the complex-ity of water resources domain and the complexcomplex-ity of the modeling tools in an environment characterized by con-tinuous rapid technological development. Bender and Simonovic [21] have presented a fuzzy compromise ap-proach to water resource systems planning under uncer-tainty. Panigrahi and Mujumdar [22] have developed fuzzy rule based model for the operation of a single pur-pose reservoir. The steps involved in the development of the model include construction of membership functions for the inflow, storage, demand and the release, formula-tion of fuzzy rules, implicaformula-tion and defuzzificaformula-tion. They
have applied this methodology to the Malaprabha irriga-tion reservoir in Karnataka, India. Nagesh Kumar et al.
[23] have presented optimal reservoir operation using fuzzy approach. Comparison of fuzzy and nonfuzzy op-timal reservoir operating policies have presented by Til-mant et al. [24]. Srinivasa Raju and Duckstein [25] have
presented multiobjective fuzzy linear programming for sustainable irrigation planning. This MOFLP model have been formulated for the evaluation of management strat-egy for the case study of Jayakwadi irrigation project, Maharashtra State, India. Regulwar and Anand Raj [26] have presented development of 3-D optimal surface for obtaining operation policies of a multireservoir in fuzzy environment using genetic algorithm.
With respect to the literature review, it can be said that multiobjective multireservoir optimization gives better operating policies for reservoirs under fuzzy environ-ment. Therefore this work is undertaken for presenting operating policies for a case study to utilize the water resource optimally and also to present maximized level of satisfaction and corresponding operating policy. Also the entire range of optimal operation policies, for differ-ent levels of satisfaction i.e., (ranging from 0 to 1), are determined.
2. System Description
The multireservoir system in Godavari river sub basin taken for present study consists of Jayakwadi project Stage-I across river Godavari, Jayakwadi project Stage-II across river Sindaphana, Yeldari project and Siddeshwar project across river Purna, and Vishnupuri barrage across river Godavari in Maharashtra state, India. The salient features of reservoirs are presented in Table 1. The sche-matic representation of the physical system is shown in Figure 1. The irrigation demand and inflow is presented in Table 2.
3. Model Development
The objective of the study is to develop optimal opera-tion policies for a multireservoir in a river sub basin. For this a monthly Multi Objective Genetic Algorithm Fuzzy Optimization (MOGAFUOPT) model is developed. The two objectives considered in this study are:
1. Maximization of irrigation releases (i.e., IR) 2. Maximization of hydro-power production (i.e., HP)
1,2,3,4 i ) IR ( Max Z
t it i
(1)...,12 1,2,3,.... t
) HP ( Max Z
t it i
(2)
Figure 1. Schematic representation of the physical system.
Table 1. Salient features of reservoirs.
Reservoirs
Sr. No. Salient Features Jayakwadi Stage-I (R1)
Jayakwadi Stage-II (R2)
Yeldari (R3)
Siddheshwar (R4)
Vishnupuri (R5)
1 River Godavari Sindaphana Purna Purna Godavari
2 State/Country Maharashtra State, India Maharashtra State, India Maharashtra State, India Maharashtra State, India Maharashtra State, India
3 Catchment Area (km2) 21750 3840 7330 7770 13870
4 Gross Storage (Mm3) 2909 453.64 934.44 250.85 83.85
5 Live Storage (Mm3) 2171 311.30 809.77 80.96 81.67
6 Installed Capacity for hydro-power generation (MW) 12.0 (Pumped storage plant) 2.25 (Canal power house) 15.0 -- --
[image:3.595.55.546.591.722.2]274 D. G. REGULWAR ET AL.
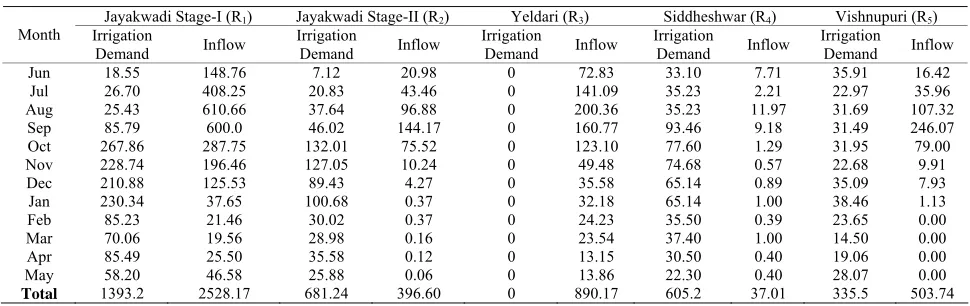
Table 2. Maximum irrigation demand and inflow in reservoirs in Mm3.
Jayakwadi Stage-I (R1) Jayakwadi Stage-II (R2) Yeldari (R3) Siddheshwar (R4) Vishnupuri (R5) Month Irrigation
Demand Inflow
Irrigation
Demand Inflow
Irrigation
Demand Inflow
Irrigation
Demand Inflow
Irrigation
Demand Inflow Jun 18.55 148.76 7.12 20.98 0 72.83 33.10 7.71 35.91 16.42
Jul 26.70 408.25 20.83 43.46 0 141.09 35.23 2.21 22.97 35.96
Aug 25.43 610.66 37.64 96.88 0 200.36 35.23 11.97 31.69 107.32
Sep 85.79 600.0 46.02 144.17 0 160.77 93.46 9.18 31.49 246.07
Oct 267.86 287.75 132.01 75.52 0 123.10 77.60 1.29 31.95 79.00
Nov 228.74 196.46 127.05 10.24 0 49.48 74.68 0.57 22.68 9.91
Dec 210.88 125.53 89.43 4.27 0 35.58 65.14 0.89 35.09 7.93
Jan 230.34 37.65 100.68 0.37 0 32.18 65.14 1.00 38.46 1.13
Feb 85.23 21.46 30.02 0.37 0 24.23 35.50 0.39 23.65 0.00
Mar 70.06 19.56 28.98 0.16 0 23.54 37.40 1.00 14.50 0.00
Apr 85.49 25.50 35.58 0.12 0 13.15 30.50 0.40 19.06 0.00
May 58.20 46.58 25.88 0.06 0 13.86 22.30 0.40 28.07 0.00
Total 1393.2 2528.17 681.24 396.60 0 890.17 605.2 37.01 335.5 503.74
taken for optimization. The fifth reservoir is considered as downstream control and is incorporated as a constraint in the model. These objectives are subjected to the fol-lowing constraints:
3.1. Turbine Release Constraints
The releases into turbines for power production, should be less than or equal to the flow through turbine capaci-ties for all the months. Also, power production in each month should be greater than or equal to the firm power. These constraints can be written as:
1,2,3,4 i
TCR(i) t)
HPR(i, (3)
....,12 1,2,3,.... FPR(i)
t)
HPR(i, t (4)
3.2. Irrigation Release Constraints
The irrigation releases should be less than or equal to the irrigation demand on all reservoirs for all the months and should be greater than or equal to the minimum irrigation demand (IDmin). Mathematically this constraint is given as:
...,12 1,2,3,.... 1,2,3,4 i t) (i, ID t) IR(i, t) (i,
IDmin max
t (5)
3.3. Reservoir Storage Constraints
The storage in the reservoirs should be less than or equal to the capacity of reservoir and greater than or equal to the dead storage for all months. Mathematically this con-straint is given as:
.,12 ... 1,2,3,.... 1,2,3,4 i (i) max S t) S(i, (i) min S t (6) 3.4. Hydrologic Continuity Constraints
These constraints relate to the turbine releases, irrigation releases, release for drinking and industrial water supply which is taken as a constant, reservoir storage, inflows into the reservoirs, Losses from the reservoirs for all months. The hydrologic continuity constraints for all the reservoirs is stated as:
,12 ... 1,2,3,.... t t) (4, t e 0 A t) SPILL(4, t) WSR(4, t) IR(4, t) HPR(3, 4 α t) SPILL(3, 3 α t) IN(4, t) t))S(4, (4, t a (1 1) t t))S(4, (4, t a (1 ) 4 (R Reservoir 4) (10) t) HPR(2, 5 α DSIN(t) t) SPILL(4, * 3 C t) SPILL(2, * 2 C t) SPILL(1, * 1 C DSR(t) ) 5 (R Reservoir 5) (11) S(i,13) S(i,1) 12 ..., 1,2,3,.... t (12)
The transition loss for pumping turbine releases back into the reservoir for R1, feeder canal release (FCR) from
R1 to R2, Spills from R3 to R4, turbine releases (HPR)
from R3 to reach to R4, turbine releases from R2 to reach
R5, Spills from R1 to reach to R5, Spills from R2 to reach
to R5, Spills from R4 to reach to R5 is taken as 10 % in
the model. Water supply releases is taken as constant for reservoir R1 as 31.63 Mm3, 3.55 Mm3 for R2, and 2 Mm3
for R3 and R4 for all months.
4. Results and Discussions
For developing optimal operating policies for a multire-servoir in a river sub basin a monthly MOGAFUOPT model is developed. By using MOGAFUOPT, the irriga-tion releases, hydropower producirriga-tion and level of satis-faction () is maximized. For this the GA operators used are stochastic remainder selection, one point crossover and binary mutation. For selection of population size, crossover probability, mutation probability and optimal generations, a thorough sensitivity analysis is carried out. The system performance is estimated by taking crossover probability between 0.7 to 1.0 with a increment of 0.05 and mutation probabilities between 0.3 to 0.001 with a decrement of 0.1 up to 0.01 and then the decrement is taken as 0.001. The population size is varied from 20 to 150 and generation from 20 to 500. Based on the system performance the optimal population size and optimal number of generations are 130 and 500 respectively. When one of the objectives: Z1 (irrigation releases) is
maximized, giving no preference to second objective: Z2
(h dropower production), the comparison shows that for
crossover probability 0.7 and mutation probability 0.1, the maximization (i.e., maximum value of Z1: Z1+) is
achieved. The variation of maximized irrigation releases with respect to different mutation probabilities for se-lected crossover probability is shown in Figure 2. When Z2 is maximized, giving no preference to Z1, the
com-parison shows that for crossover probability 0.9 and mu-tation probability 0.1, the maximization (i.e., maximum value of Z2: Z2+) is achieved. The variation of maximized
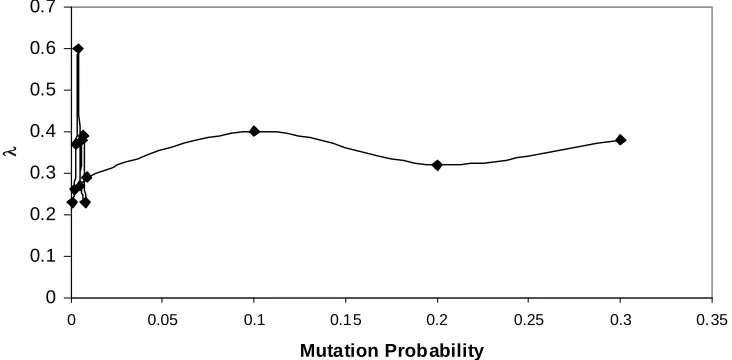
hydropower production with respect to different muta-tion probabilities for selected crossover probability is shown in Figure 3. In fuzzy optimization model, when
(level of satisfaction) is maximized, the comparison shows that for crossover probability 1.0 and mutation probability 0.004, the maximization (i.e., maximization of both the objectives simultaneously) is achieved. The variation of maximized (level of satisfaction) with re-spect to different mutation probabilities for selected crossover probability is shown in Figure 4.
y
The MOGAFUOPT model is developed for multireser-voir system as shown in Figure 1 with the objectives 1) to maximize irrigation releases and 2) to maximize hydro-power production. The best and worst values for both the objectives i.e., Z1 for irrigation releases (Z1+ and Z1-) and
Z2 for hydropower production (Z2+ and Z2-) are determined
by considering one objective at a time, ignoring the other. When Z1 is maximized, the corresponding value of Z2 is
considered to be the worst and vice versa. These values are given in Table 3. These objectives are fuzzified by considering linear membership function. The membership functions for irrigation releases and hydropower produc-tion are presented in Equaproduc-tions 13 and 14 respectively.
36 . 2218 Z 1 2218.36 Z 1807.97 ) 97 . 1807 36 . 2218 ( ) 97 . 1807
(Z Z 1807.97 0 (x) 1 1 1 1 Z1
(13)
3 . 117394536 Z 1 3 . 117394536 Z 85591654.2 ) 2 . 85591654 3 . 117394536 ( ) 2 . 85591654 (Z 85591654.2 Z 0 (x) 2 2 2 2 Z2
276 D. G. REGULWAR ET AL.
2080 2100 2120 2140 2160 2180 2200 2220 2240
0 0.0 5 0.1 0. 15 0.2 0. 25 0.3
M utation Probability
Ir
ri
g
a
ti
o
n
R
e
lea
s
es (
M
m
3 )
[image:6.595.114.469.84.250.2]0.35
[image:6.595.119.478.293.466.2]Figure 2. Variation of irrigation releases corresponding to mutation probability for crossover probability 0.7.
Figure 3. Variation of hydropower production corresponding to mutation probability for crossover probability 0.9.
Figure 4. Variation of corresponding to mutation probability for crossover probability 1.0.
0 0.1 0.2 0.3 0.4 0.5 0.6 7
0 0.05 0.1 0.15 0.2 0.25 0.3 0.35
Mutation Probability
[image:6.595.109.475.511.691.2]Table 3. Best and worst values for objective functions.
Objective Function
(Maximization) Best value Z+ Worst value Z
-Irrigation releases (Z1) Mm3 2218.36 1807.97
Hydro-power production (Z2) mwh 117394.5 85591.7
and run the model again to obtain respective solution. For this purpose, the whole range of operation policies with satisfaction levels ranging from 0 to 1, for both the objectives, are determined. These policies are presented in Table 4.
The comparison between existing operation policy and optimized operation policy is prepared for Jaykwadi stage-I reservoir (R1). The results of MOGAFUOPT
shows that the annual maximized irrigation releases for Jayakwadi stage-I reservoir (R1) is 1166.20 Mm3. The
annual maximum irrigation demand for this reservoir is 1393.2 Mm3 as per data presented in Table 2. The
his-torical outflow data of reservoir R1 for 30 years is
ana-lyzed and monthly average outflow for irrigation releases is worked out. Average of 30 years outflow data is taken and it works out to be 1295.6 Mm3. The comparison of
average existing operation policy and optimized opera-tion policy derived by GA under fuzzy environment is promising. The historic data of existing operation policy for other reservoirs is not obtained. Hence comparison is presented for Jaykwadi stage-I reservoir (R1) in Figure 7.
These fuzzified objectives are simultaneously maxi-mized by defining level of satisfaction () and then maximizing it. The (Maximum level of satisfaction) was found to be 0.60. The irrigation releases (Z1*) and
hydropower produced (Z2*) corresponding to maximum
level of satisfaction are 2054.22 Mm3 and 104755.5 mwh
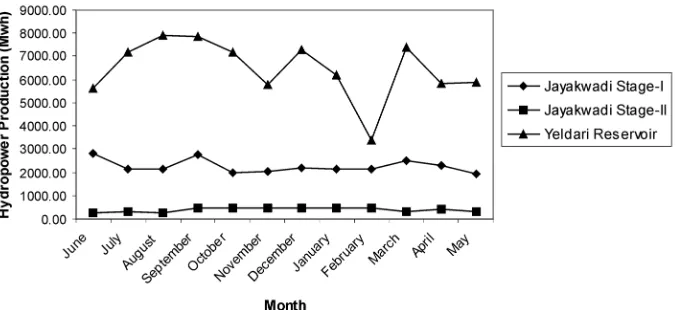
respectively. Monthly optimized irrigation releases from reservoirs are shown graphically in Figure 5. Monthly optimized hydropower production from reservoirs is pre-sented in Figure 6.
[image:7.595.135.469.345.509.2]Decision maker may adopt value as it is or he may demand different value. For this, can be changed for both the objectives as per preferences of decision maker
Figure 5. Monthly optimized irrigation releases from reservoirs.
[image:7.595.131.470.542.697.2]278 D. G. REGULWAR ET AL.
Figure 7. Comparision of irrigaion releases for jayakwadi stage-I project.
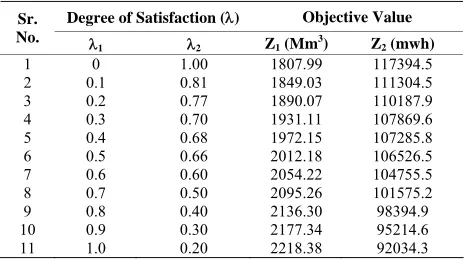
Table 4. Solutions of MOGAFUOPT for Different Values of .
Degree of Satisfaction () Objective Value
Sr.
No.
1 2 Z1 (Mm3) Z2 (mwh)
1 0 1.00 1807.99 117394.5
2 0.1 0.81 1849.03 111304.5
3 0.2 0.77 1890.07 110187.9
4 0.3 0.70 1931.11 107869.6
5 0.4 0.68 1972.15 107285.8
6 0.5 0.66 2012.18 106526.5
7 0.6 0.60 2054.22 104755.5
8 0.7 0.50 2095.26 101575.2
9 0.8 0.40 2136.30 98394.9
10 0.9 0.30 2177.34 95214.6
11 1.0 0.20 2218.38 92034.3
5. Summary and Conclusion
Multiobjective, multireservoir optimization in fuzzy environment by using GA is explored in this study. A multireservoir system in Godavari river sub basin in Maharashtra State, India is considered. A MOGAFU-OPT model is developed and applied to the case study. The objective function of the GA model was set to maximize irrigation releases, hydropower production and level of satisfaction (). The sensitivity analysis for deciding crossover probability, mutation probabil-ity, population size and number of generations are presented in the result for this case study. By adopting these GA parameters, irrigation releases, hydropower production and level of satisfaction are maximized and results are presented. The maximum level of satisfac-tion (*) achieved by maximizing both the objectives
simultaneously is 0.60. The corresponding irrigation releases and hydropower production are 2054.22 Mm3
and 104755.5 mwh respectively. The whole range of operation policies with satisfaction levels ranging from 0 to 1 for both the objectives are determined. Monthly optimized irrigation releases and hydropower
produc-tion from reservoirs are presented. The comparison of average existing operation policy and optimized opera-tion policy derived by GA under fuzzy environment is promising. The application of proposed MOGAFUOPT model can be extended to the other river basins with little modifications taking physical features and the constraints of the basin into consideration. This study shows that MOGAFUOPT model has significant po-tential in application to multiobjective, multireservoir system in a river basin.
6. Acknowledgement
The authors are thankful to Command Area Development Authority, Aurangabad, Maharashtra State, India for providing necessary data for the analysis. The authors also thank the Kanpur Genetic Algorithm Laboratory for providing source code of GA.
7
. References
[1] R. A. Wurbs, “Modelling and analysis of reservoir system operation,” NJ: Prentice Hall PTR, Prentice-Hall Inc., 1996.
[2] W. W-G. Yeh, “Reservoir management and operations models: A state-of-the-art review,” Water Resour. Res., Vol. 21, No. 12, pp. 1797–1818, 1985.
[3] J. W. Labadie, “Optimal operation of multireservoir sys-tems: State-of-the-art review,” J. Water Resour. Plan. and Manage., Vol. 130, No. 2, pp. 93–111, 2004.
[4] J. H. Holland, “Adaptation in natural and artificial sys-tems,” University of Michiyan Press annarbov, Cam-bridge Mass, 1975.
[5] D. E. Goldberg, “Genetic algorithms in search, optimiza-tion and machine learning,” Addison-Wesley Publishing Co., Inc., Reading MA, 1989.
[image:8.595.56.288.305.435.2][7] R. Wardlaw and M. Sharif, “Evaluation of genetic algo-rithm for optimal reservoir system operation,” J. Water Resour. Plan. and Manage., Vol. 125, No. 1, pp. 25–33, 1999.
[8] M. Sharif and R. Wardlaw, “Multireservoir systems op-timization using genetic algorithms: Case study,” J. Compu. in Civil Engrg., Vol. 14, No. 4, pp. 255–263, 2000.
[9] L. C. Chang and C. C. Yang, “Optimizing the rule curves for multi-reservoir operations using a genetic algorithm and HEC-5,” J. Hydrosci. and Hydra. Engrg., Vol. 20, No. 1, pp. 59–75, 2002.
[10] K. Srinivasa Raju and D. Nagesh Kumar, “Irrigation planning using genetic algorithms,” Water Resour. Man-age., Vol. 18, pp. 163–176, 2004.
[11] J. A. Ahmed and A. K. Sarma, “Genetic algorithm for optimal operating policy of a multipurpose reservoir,” Water Resour. Manag., Vol. 19, pp. 145–161, 2005. [12] L. F. R. Reis, G. A. Walters, D. E. Savic, and F. H.
Chaudhry, “Multi-reservoir operation planning using hy-brid genetic algorithm and linear programming (GA-LP): An alternative stochastic approach,” Water Resour. Manag., Vol. 19, pp. 831–848, 2005.
[13] V. Jothiprakash and Ganesan Shanthi, “Single reservoir operating policies using genetic algorithm,” Water Re-sour. Manag., Vol. 20, pp. 917–929, 2006.
[14] J. X. Chang, G. Huang, and Y. M. Wang, “Genetic algo-rithms for optimal reservoir dispatching,” Water Resour. Manag., Vol. 19, pp. 321–331, 2005.
[15] L. F. R. Reis, F. T. Bessler, G. A. Walters, and D. Savic, “Water supply reservoir operation by combined genetic algorithm-linear programming (GA-LP) approach,” Wa-ter Resour. Manag., Vol. 20, pp. 227–255, 2006. [16] M. Janga Reddy, and D. Nagesh Kumar, “Optimal
reser-voir operation using multi-objective evolutionary algo-rithm,” Water Resour. Manag., Vol. 20, pp. 861–878, 2006.
[17] P. Anand Raj, “Multicriteria methods in river basin plan-ning-A case study,” Water Sci. and Techno., Vol. 31, No. 8, pp. 261–272, 1995.
[18] P. Anand Raj and D. Nagesh Kumar, “Ranking of river basin alternatives using ELECTRE,” J. Hydrol. Sci., Vol. 41, No. 5, pp. 697–713, 1996.
[19] P. Anand Raj, and D. Nagesh Kumar, “Planning for sus-tainable development of a river basin using fuzzy logic,” in Proce. of Int. Conf. on Civil Engrg. for Sustainable Development, Roorkee, India, pp. 173–182, 1997. [20] S. P. Simonovic, “Tools for water management: One
view of the future,” Water International, IWRA, Vol. 25, No. 1, pp. 76–88, 2000.
[21] M. J. Bender and S. P. Simonovic, “A fuzzy compromise approach to water resource systems planning under un-certainty,” Fuzzy Sets and Systems, Vol. 115, pp. 35–44, 2000.
[22] D. P. Panigrahi and P. P. Mujumdar, “Reservoir operation modeling with fuzzy logic,” Water Resour. Manag., Vol. 14, pp. 89–109, 2000.
[23] D. Nagesh Kumar, D. S. V. Prasad, and K. Srinivasa Raju, “Optimal reservoir operation using fuzzy approach,” in Proce. of Int. Conf. on Civil Engrg., Banglore, India, In-terline Publishing, pp. 377–384, 2001.
[24] A. Tilmant, M. Vanclooster, L. Duckstein, and E. Per-soons, “Comparision of fuzzy and nonfuzzy optimal res-ervoir operating policies,” J. Water Resour. Plan. and Manage., Vol. 128, No. 6, pp. 390–398, 2002.
[25] K. Srinivasa Raju and L. Duckstein, “Multiobjective fuzzy linear programming for sustainable irrigation plan-ning: An Indian case study,” Soft Computing, Vol. 7, pp. 412–418, 2003.
280 D. G. REGULWAR ET AL.
Appendix: notation
The following symbols are used in this paper
DSR (t) =Downstream requirement during month t; DSIN (t) = Downstream inflow during month t;
FCR(i,t) = Feeder Canal Releases during month t from reservoirs i; FPR(i) = Flow for firm power release from reservoirs i;
IDmax(i,t) =Maximum irrigation demand during month t from reservoirs i;
IDmin (i,t) =Minimum irrigation requirement during month t from reservoirs i;
IN(i,t) =Monthly inflow into the reservoir during month t from reservoirs i; SPILL(i,t) =Spills during month t from reservoirs i;
HP(i,t) =Hydropower produced during month t from reservoir i; IR(i,t) =Irrigation releases during month t from reservoirs i;
HPR(i,t) =Releases for hydropower production in month t from reservoirs i; WSR(i,t) =Water supply releases during month t from reservoirs i;
S(i,t) =Storage in the reservoir during month t from reservoirs i; Smin(i) =Minimum storage capacity for ith reservoir;
Smax(i) =Maximum storage capacity for ith reservoir;
T1, T2, T3 =Turbines for reservoirs R1, R2 and R3;
TCR(i) =Flow for maximum capacity of turbine from reservoirs i; (x)
i
=Membership function;
=Level of satisfaction;
* =Maximum degree of overall satisfaction; 1 =Level of satisfaction for irrigation releases; 2 =Level of satisfaction for hydropower produced; 1, 2, 3, 4, 5 =Constants; and