www.wjpls.org 172 Hameeda et al. World Journal of Pharmaceutical and Life Sciences
A NEW SEPARATION TECHNIQUE FOR METHOD DEVELOPMENT AND
VALIDATION OF ALOGLIPTIN AND PIOGLITAZONE IN ITS PURE AND
PHARMACEUTICAL DOSAGE FORM BY RP-HPLC METHOD
Hameeda Begum*, Dr. R. Vani and Dr. D. Rama Krishna
Department of Pharmaceutical Analysis, Shadan Women’s College of Pharmacy, Hyderabad.
Article Received on 20/09/2019 Article Revised on 10/10/2019 Article Accepted on 30/10/2019
INTRODUCTION
Alogliptin,2-({6-[(3R)-3-aminopiperidin-1-yl]-3-methyl-2,4-dioxo-1,2,3,4-tetrahydropyrimidin-1-yl}methyl) benzonitrile is a selective, orally-bioavailable inhibitor of enzymatic activity of dipeptidyl peptidase-4 (DPP-4). Chemically, alogliptin is prepared as a benzoate salt and exists predominantly as the R-enantiomer (>99%). It undergoes little or no chiral conversion in vivo to the (S)-enantiomer. FDA approved January 25, 2013. Alogliptin inhibits dipeptidyl peptidase 4 (DPP-4), which normally degrades the incretins glucose-dependent insulinotropic polypeptide (GIP) and glucagon like peptide 1 (GLP-1). The inhibition of DPP-4 increases the amount of active plasma incretins which helps with glycemic control. GIP and GLP-1 stimulate glucose dependent secretion of insulin in pancreatic beta cells. GLP-1 has the additional effects of suppressing glucose dependent glucagon secretion, inducing satiety, reducing food intake, and reducing gastric emptying.
Fig. 1: Chemical Structure of Alogliptin, 2-({6-[(3R)- 3-aminopiperidin-1-yl]-3-methyl-2,4-dioxo-1,2,3,4-tetrahydropyrimidin-1-yl}methyl)benzonitrile
Pioglitazone, 5-({4-[2-(5-ethylpyridin-2-yl)ethoxy] phenyl} methyl)-1,3-thiazolidine-2,4-dione is a medication belonging to the thiazolidinedione class of drugs that are used as adjuncts to diet, exercise, and other diabetes medications to manage type 2 diabetes mellitus. The thiazolidinedione class of medications exerts its pharmacological effect primarily by promoting insulin sensitivity and the improved uptake of blood glucose. Following entry into fat cell nuclei, pioglitazone selectively binds to the Peroxisome
Proliferator-World Journal of Pharmaceutical and Life Sciences
WJPLS
www.wjpls.org
SJIF Impact Factor: 6.129*Corresponding Author: Hameeda Begum
Department of Pharmaceutical Analysis, Shadan Women’s College of Pharmacy, Hyderabad.
ABSTRACT
A short selective, precise, accurate and sensitive for the estimation of Alogliptin and Pioglitazone was done by RP-HPLC. The estimation of Alogliptin and Pioglitazone was done by RP-RP-HPLC. The assay of Alogliptin and Pioglitazone was performed with tablets and the % assay was found to be 99.93 and 99.95 which shows that the method is useful for routine analysis. The linearity of Alogliptin and Pioglitazone was found to be linear with a correlation coefficient of 0.999 and 0.999, which shows that the method is capable of producing good sensitivity. The acceptance criteria of precision is RSD should be not more than 2.0% and the method show precision 0.6 and 0.8 for Alogliptin and Pioglitazone which shows that the method is precise. The acceptance criteria of intermediate precision is RSD should be not more than 2.0% and the method show precision 0.6 and 0.6 for Alogliptin and Pioglitazone which shows that the method is repeatable when performed in different days also.
Activated Receptor Gamma (PPARγ). PPARs are ligand-activated transcription factors that are involved in the expression of more than 100 genes, and affect numerous metabolic processes, notably lipid and glucose homeostasis. PPARγ in particular is abundantly expressed in lipid cells (adipocytes), where it plays a central role in lipid production and regulation of lipid metabolism.
Fig.2 Chemical Structure of Pioglitazone,
5-({4-[2-(5-ethylpyridin-2-yl) ethoxy] phenyl}
methyl)-1,3-thiazolidine -2, 4-dione
Experimental
Optimized chromatographic conditions
Instrument used : Waters HPLC with auto sampler and UV detector. Temperature : Ambient
Column : Inertsil ODS (150 x 4.6, 5µm) Buffer : phosphate buffer
pH : 3.0
Mobile phase : 70% buffer 30% Acetonitrile Flow rate : 1 ml per min
Wavelength : 248 nm Injection volume : 20 l Run time : 15 min.
Preparation of Buffer and Mobile Phase Preparation of pH3 phosphate buffer
Accurately weigh and transfer 3.5gms of potassium di hydrogen orthopjosphate dissolved in 1000 ml of HPLC water Ph was adjusted up to 3.0. Final solution was filtered through 0.44 m Membrane filter and sonicate it for 10 mins.
Preparation of mobile phase
Accurately measured 700 ml (70%) of above buffer and 300 ml (30%) of Acetonitrile HPLC were mixed and degassed in an ultrasonic water bath for 10 minutes and then filtered through 0.45 µ filter under vacuum filtration.
Diluent Preparation
The Mobile phase was used as the diluent.
Preparation Of The Alogliptin& Pioglitazone
Standard & Sample Solution Standard Solution Preparation
Accurately weigh and transfer 25 mg of Alogliptin and 60 mg of Pioglitazone working standard into a 100 ml
and sonicate to dissolve it completely and make volume up to the mark with the same solvent. (Stock solution).
Further pipette 1.5 ml of the above stock solutions into a 10ml volumetric flask and dilute up to the mark with diluent.
Sample Solution Preparation
Accurately weigh 10 tablets crush in mortor and pestle and transfer equivalent to 25 mg of Alogliptin and 60 mg Pioglitazone sample into a 100 mL clean dry volumetric flask add about 7 mL of Diluent and sonicate it up to 15 mins to dissolve it completely and make volume up to the mark with the same solvent. Then it is Filtered through 0.45 micron Injection filter. (Stock solution).
Further pipette 1.5ml of Alogliptin and Pioglitazone from the above stock solution into a 10ml volumetric flask and dilute up to the mark with diluent.
Procedure
Inject 20 l of the standard, sample into the chromatographic system and measure the areas for Alogliptin and Pioglitazone peaks and calculate the %Assay by using the formulae.
RESULTS AND DISCUSSIONS
Validation
Fig. 3: Standard Chromatogram of Alogliptin and Pioglitazone.
Table 1: Results of system suitability parameters.
S.No. Name RT(min) Area (µV sec) Height (µV) USP resolution USP tailing USP plate count
1 Alogliptin 4.974 463731 34151 1.29 3122.36 2 Pioglitazone 6.006 373273 23654 2.69 1.22 3422.48
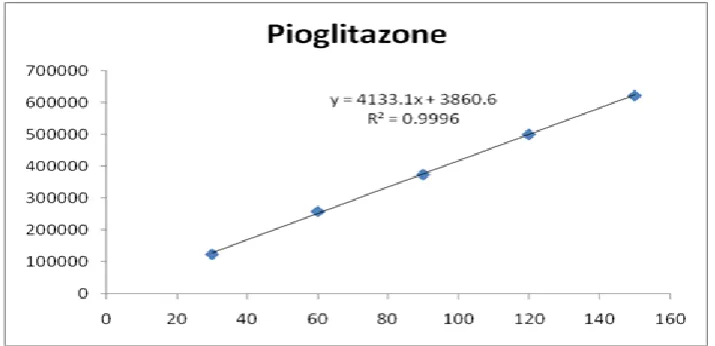
Table 2: Results of Linearity of Alogliptin and Pioglitazone.
S. No. Alogliptin Pioglitazone
Concentration (µg/ml) Area Concentration (µg/ml) Area
1 12.5 163126 30 123687
2 25 324879 60 258151
3 37.5 484999 90 374272
4 50 622089 120 500737
5 62.5 774838 150 622363
Figure 5: Calibration graph for Pioglitazone.
Table 3. Results of Precision for Alogliptin.
Injection Area
Injection-1 469199 Injection-2 466480 Injection-3 463505 Injection-4 465113 Injection-5 463129 Injection-6 460972
Average 464733.0
Standard Deviation 2876.4
%RSD 0.6
Table 4: Results of Precision for Pioglitazone.
Injection Area
Injection-1 378542 Injection-2 370422 Injection-3 377395 Injection-4 375692 Injection-5 375700 Injection-6 372893
Average 375107.3
Standard Deviation 2985.9
%RSD 0.8
Table 5: Accuracy (recovery) data for Alogliptin.
%Concentration
(at specification Level) Area
Amount Added (mg)
Amount Found
(mg) % Recovery Mean Recovery
50% 233775.3 12.5 12.53 100.28
99.60 100% 462242.7 25 24.78 99.14
150% 695121.3 37.5 37.27 99.39
Table 6: Accuracy (recovery) data for Pioglitazone.
%Concentration
(at specification Level) Area
Amount Added (mg)
Amount Found
(mg) % Recovery Mean Recovery
50% 188250.7 30 30.06 100.19
100.15 100% 374491 60 59.79 99.66
Table 7: Results of LOD.
Drug name Baseline noise (µV) Signal obtained (µV) S/N ratio
Alogliptin 43 132 3.07
Pioglitazone 43 127 2.95
Table 8: Results of LOQ.
Drug name Baseline noise (µV) Signal obtained (µV) S/N ratio
Alogliptin 43 434 10.09
Pioglitazone 43 427 9.93
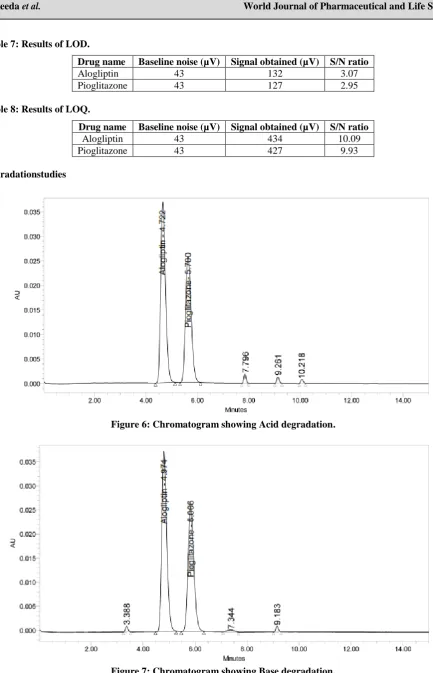
Degradationstudies
Figure 6: Chromatogram showing Acid degradation.
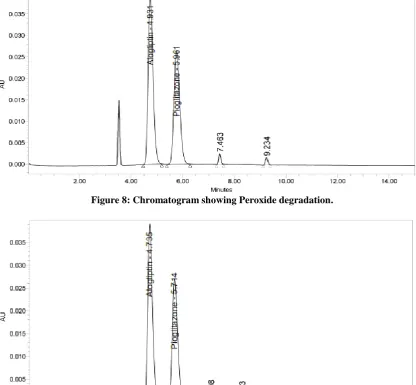
Figure 8: Chromatogram showing Peroxide degradation.
Table 9: Results for Stability of Alogliptin andPioglitazone.
Sample Name Alogliptin Pioglitazone
Area % Degraded Area % Degraded
Standard 465326.7 375025.0
Acid 446578 4.03 359788 4.06
Base 453567 2.53 362545 3.33
Peroxide 439786 5.49 343876 8.31
Thermal 448788 3.55 349675 6.76
Photo 437675 5.94 351989 6.14
Table 10: Results of Assay for Alogliptin and Pioglitazone.
Label Claim (mg) % Assay
Alogliptin 12.5 99.93
Pioglitazone 30 99.95
SUMMARY AND CONCLUSION
The estimation of Alogliptin and Pioglitazone was done by RP-HPLC.
The assay of Alogliptin and Pioglitazone was performed with tablets and the % assay was found to be 99.93 and 99.95 which shows that the method is useful for routine analysis.
The linearity of Alogliptin and Pioglitazone was found to be linear with a correlation coefficient of 0.999 and 0.999, which shows that the method is capable of producing good sensitivity.
The acceptance criteria of precision is RSD should be not more than 2.0% and the method show precision 0.6 and 0.8 for Alogliptin and Pioglitazone which shows that the method is precise.
The acceptance criteria of intermediate precision is RSD should be not more than 2.0% and the method show precision 0.6 and 0.6 for Alogliptin and Pioglitazone which shows that the method is repeatable when performed in different days also.
The accuracy limit is the percentage recovery should be in the range of 97.0% - 103.0%. The total recovery was found to be 99.60% and 100.15% for Alogliptin and Pioglitazone. The validation of developed method shows that the accuracy is well within the limit, which shows that the method is capable of showing good accuracy and reproducibility.
The acceptance criteria for LOD and LOQ are 3 and 10. The LOD and LOQ for Alogliptin was found to be 3.07 and 10.09 and LOD and LOQ for Pioglitazone was found to be 2.95 and 9.93.
The robustness limit for mobile phase variation and flow rate variation are well within the limit, the % degradation results are in limits. Which shows that the method is having good system suitability and precision under given set of conditions.
BIBLIOGRAPHY
1. Gurudeep Chatwal and Sham Anand, Instrumental methods of chemical analysis. Himalaya publishers, 7th edition, 1992; 2: 624-2.639.
2. Skoog et al., Principles of Instrumental Analysis. Barkhanath publishers, 8th edition, 973-995.
3. Hobart.H.Willard et al., Instrumental methods of analysis, CBS Publications and Distributors, New Delhi, 1st edition, 1986; 529-563.
4. Sethi P.D., Quantitative analysis of Drugs & Pharmaceuticals. CBS publishers and distributors, New Delhi, 3rd edition, 2001; 1-120.
5. Janeyulu.Y & Marayyah, Quality Assurance & Quality Management in Pharmaceutical Industry. Pharma book publishers, Hyd, edition, 2005; 78-108.
6. Vogel’s Text book of quantitative chemical analysis. Published by Dorling Kindersley pvt.ltd. 6th edition, 289-304.
7. Lloyd R. Snyder et al., practical HPLC method development. John Wiley & sons publishers, 2nd edition, 350-400.
8. Knevel A.M. &.Digengl F.E, Jenkins Quantitative Pharmaceutical Chemistry, Mc Graw Hill Book Co. 9. Daniel W.Armstrong, Bonded Phase material for
Chromatographic separations, 1985, U.S.Patent, 4539399.
![Fig. 1: Chemical Structure of Alogliptin, 2-({6-[(3R)- 3-aminopiperidin-1-yl]-3-methyl-2,4-dioxo-1,2,3,4-tetrahydropyrimidin-1-yl}methyl)benzonitrile](https://thumb-us.123doks.com/thumbv2/123dok_us/9789808.1964646/1.595.328.520.434.593/chemical-structure-alogliptin-aminopiperidin-methyl-tetrahydropyrimidin-methyl-benzonitrile.webp)