RESEARCH ARTICLE
Bovine milk microbiome: a more complex
issue than expected
Suvi Taponen
1*, David McGuinness
2, Heidi Hiitiö
1, Heli Simojoki
1, Ruth Zadoks
3and Satu Pyörälä
1Abstract
The aim of this study was to analyze bacterial profiles of bovine mastitic milk samples and samples from healthy quar-ters using Next Generation Sequencing of amplicons from 16S rRNA genes and to compare results with microbiologi-cal results by PCR assays of the same samples. A total of 49 samples were collected from one single dairy herd during the same day. The samples were divided in two sample sets, which were used in this study. The DNA extraction as well as the library preparation and sequencing of these two sets were performed separately, and results of the two data-sets were then compared. The vast majority of genera detected appeared with low read numbers and/or in only a few
samples. Results of PCR and microbiome analyses of samples infected with major pathogens Staphylococcus aureus or
Streptococcus uberis were consistent as these genera also covered the majority of reads detected in the microbiome analysis. Analysis of alpha diversity revealed a much higher species richness in set 1 than in set 2. The dominating bacterial genera with the highest read numbers clearly differed between datasets, especially in PCR negative sam-ples and samsam-ples positive for minor pathogens. In addition to this, linear discriminant analysis (LDA) was conducted
between the two sets to identify significantly different genera/family level microbes. The genus Methylobacterium was
much more common in set 2 compared to set 1, and genus Streptococcus more common in set 1. Our results indicate
amplification of contaminating bacteria in excess in samples with no or minor amounts of pathogen DNA in dataset 2. There is a need for critical assessment of results of milk microbiome analyses.
© The Author(s) 2019. This article is distributed under the terms of the Creative Commons Attribution 4.0 International License (http://creat iveco mmons .org/licen ses/by/4.0/), which permits unrestricted use, distribution, and reproduction in any medium, provided you give appropriate credit to the original author(s) and the source, provide a link to the Creative Commons license, and indicate if changes were made. The Creative Commons Public Domain Dedication waiver (http://creat iveco mmons .org/ publi cdoma in/zero/1.0/) applies to the data made available in this article, unless otherwise stated.
Introduction
Inflammation of the mammary gland, mastitis, is most commonly caused by intramammary infection (IMI) derived from bacteria. Approximately 140 bacterial spe-cies have been isolated by conventional culture in milk samples taken from infected bovine mammary quar-ters [1]. The most common pathogen genera isolated in mastitic milk samples are staphylococci, enterobacteria and streptococci, which cause the great majority of IMIs [2–4]. Udder pathogens have traditionally been divided into major and minor pathogens, based on the severity of the disease they are able to cause [1]. During the past decade, culture-independent DNA-based methods have been introduced, which are now commercially available in many countries for field mastitis diagnostics [3, 5, 6]. PCR test results, which often include more species than
detected in conventional culturing, have inspired dis-cussion about the clinical relevance of the target species reported [5, 7].
A healthy mammary gland has been considered to be a sterile environment, in particular in pre-pubertal animals with intact teats before colostrogenesis and initiation of milk secretion [8]. Around the first parturition and after start of milking, the mammary gland becomes a func-tionally open system with a direct connection to the envi-ronment. Presence of a natural community of microbes within the mammary gland, the microbiota, has been hypothesized [9, 10]. The collective genetic composition of the microbiota is usually referred to as the microbiome [11]. The mammary gland microbiome and the microbi-ome of the milk can be considered to be highly similar, where the origin of microbes in the milk could be from the upper parts of the mammary gland, but it is very likely that many of these microbes migrate from extra-mammary sites and the environment [10]. In cows, milk sampling is simple compared with humans or many other
Open Access
*Correspondence: [email protected]
1 Department of Production Animal Medicine, Faculty of Veterinary Medicine, University of Helsinki, Helsinki, Finland
animal species [12, 13]. Aseptic sampling is the recom-mended method to collect bovine milk samples but it can never ensure that milk samples are completely free from contaminating microbes [7, 14, 15].
The advent of high-throughput sequencing platforms has led to studies investigating microbial communi-ties in a broad range of different biological ecosystems, including bovine milk [9]. The most common approach to explore the milk microbiome and its dynamics is sequencing of the 16S rRNA gene, which has been applied in studies on bovine mastitis [16–18]. The para-digm of IMI as an infection caused by one or maximally two microbial species has been challenged by recent studies on bovine mastitis. Along with the new microbi-ome data, a new hypothesis on possible “dysbiosis” of the mammary gland has been introduced as a predisposing factor for IMI and mastitis [9, 10]. Microbiota consisting of a wide selection of genera with a great microbial diver-sity have been found to be present in milk from quarters with mastitis [16–18]. Mastitic quarters have demon-strated a higher bacterial load than healthy quarters [19]. Most microbes reported are completely new in the phy-logeny of mastitis causing microbial agents. Furthermore, the milk microbiome in bovine mammary quarters free from intramammary infection and inflammation, with a low milk somatic cell count, has been even more diverse than that seen in quarters with clinical mastitis [17, 18]. The possible clinical significance of these findings in the milk microbiome remains completely open.
In milk samples taken from quarters with pathogen-specific IMI, sequences of bacterial genera and species present in the microbiome have in general corresponded to those detected by culture [16, 17]. Some common udder pathogens such as Escherichia coli, Klebsiella spp. and Streptococcus uberis have been the single most prevalent microorganism in the microbiome [16]. In milk samples from IMIs due to Trueperella pyogenes,
Strepto-coccus dysgalactiae, and Staphylococcus aureus as
diag-nosed by culture, sequences of the same pathogens have been among the most common also in the milk micro-biome [16]. Metagenomic profiling has also previously been applied to study the possible impacts of antimicro-bial treatment on milk microbiota [19–22].
Culture-independent profiling of bacterial communi-ties in the bovine mammary gland represent an approach which, while it provides a considerable amount of new information, also requires critical assessment [23, 24]. The methodologies used are very sensitive and prone to contamination or other pitfalls during sampling, sample handling and all processing steps of the analysis [25, 26]. Biological conclusions on the results of microbiome anal-yses must always be done with caution.
The aim of this study was to analyze the composition of bacterial communities in bovine mastitic milk samples using Next Generation Sequencing of amplicons from 16S rRNA gene and compare the microbiomes with con-ventional culture and PCR assay results from the same samples. Milk samples from healthy mammary quarters with no inflammatory reaction, from the same cows were also included. Samples were processed separately in two datasets and the results were compared.
Materials and methods Milk samples
The sampling was carried out in Estonia during 1 day in June 2013 on a large dairy herd with 700 dairy cows. They were kept in tie stalls with concrete floors and straw bed-ding, and had an average milk production of 9650 kg. The herd belonged to the practice area of the Large Animal Clinic of the Estonian University of Life Sciences. The experiment was approved by the Commission of Ani-mal Trials at the Estonian Ministry of Agriculture (No 7.2–11/1). The sampling procedure is reported in detail by Hiitiö et al. [7]. In brief, cows to be sampled were pre-selected based on composite milk SCC > 200 000 cells/ mL in the previous DHI samples. Extremely dirty or nervous cows were excluded to avoid excessive risk of sample contamination. On the sampling day, milk CMT was performed from each quarter and cows with a CMT score ≥ 3 on a scale of 1 to 5 in at least one quarter were included in the study. In addition, healthy quarters with a CMT score 1 of the same cows were sampled.
Before sampling, the udder and the teats were cleaned with a moist towel. The teat end of the sampled quarter was wiped with cotton moistened in 70% ethanol until visibly clean and 10 mL of milk was collected in a plastic milk vial (Linkoputki 16 × 100 mm, Plastone, Mekalasi, Finland) without preservatives. The sampler wore dis-posable gloves. The samples were cooled immediately and transported in cooler boxes to the laboratory of the Department of Production Animal Medicine (Faculty of Veterinary Medicine, University of Helsinki) within 8 h and thereafter stored in a refrigerator at 6 °C. The follow-ing day, milk from all samples was aseptically drawn into 2.5-mL aliquots (Vacuette Tube Z, 4 mL) and stored at −20 °C for PCR analysis. Remaining aliquots were stored in similar manner for later DNA extraction for microbi-ome analysis.
Conventional bacteriological culturing
after 18 to 24 h and after 48 h and colonies identified according to standard procedures [27].
Milk NAGase activity determination
Milk NAGase activity was measured by a fluoro-optical method using an in-house microplate modification devel-oped by Mattila and Sandholm [28] and further modified by Hovinen et al. [29]. NAGase activity was expressed as picomoles of 4-MU/min per microliter of milk at 25 °C. Inter-assay and intra-assay coefficients of variation for NAGase activity were 4.9 and 3.9%, respectively. The ref-erence value for normal milk NAGase activity is 0.1–1.04 [29].
Real‑time PCR
Frozen samples were thawed and analyzed within a month from the sampling, using real-time PCR in the laboratory of Thermo Fisher Scientific Ltd. (Van-taa, Finland). PathoProof Complete-16 kit was used, which contained oligonucleotides for the staphylococ-cal β-lactamase gene (blaZ) and for microbial species or groups of species: Corynebacterium bovis,
Enterococ-cus faecalis and Enterococcus faecium, Escherichia coli,
Klebsiella oxytoca and Klebsiella pneumoniae,
Myco-plasma bovis, Mycoplasma spp., Prototheca spp., Serratia
marcescens, Staphylococcus aureus, Staphylococcus spp.,
Streptococcus agalactiae, Streptococcus dysgalactiae,
Streptococcus uberis, Trueperella pyogenes and
Pepton-iphilus indolicus, and yeasts.
DNA extraction
For practical reasons, the DNA extraction and microbi-ome analysis of the milk samples collected at the same day were performed in two parts. In the first part (data-set 1), 25 samples were analyzed, and in the second part (dataset 2) 24 samples. One sample was included in both datasets and could be used as an internal control of the microbiome analysis. The samples for microbiome anal-ysis were selected based on PCR results: samples posi-tive for major and minor udder pathogens in PCR were selected, as well as samples negative in PCR. Exclu-sion criteria were ≥ 3 pathogens, yeast or algae (
Pro-totheca) in the sample. The best samples in this respect
were included in the first dataset. In the second dataset, three samples with yeast, two with Prototheca algae and two ≥ 3 pathogens [Staph. aureus, non-aureus staphylo-cocci (NAS) and C. bovis] were included to get enough samples. The DNA content of the samples varied but samples were not selected based on DNA extraction results.
The extraction of DNA from milk samples of both datasets was performed by the same experienced labora-tory technician in the same laboralabora-tory in a laminar flow
cabinet using PowerFood™ Microbial DNA Isolation Kit (MoBio Laboratories, Qiagen, Carlsbad, CA, USA). Set 1 DNA was extracted in November 2014 and set 2 DNA in January 2016. The amount of milk, per sample, used in DNA extraction was 1.8 mL, except for some sam-ples, which did not contain enough milk. In these cases the remaining volume was used. The DNA concentration and purity were measured using a NanoDrop 2000 equip-ment (Thermo Fisher Scientific, Waltham, MA, USA). The DNA concentration, ng/μL, was measured at 260 nm and the purity was assessed using the 260 nm/280 nm and 260 nm/230 nm wavelength ratios.
Microbiome analysis
Generation of 16S amplicon libraries
Extracted DNA samples were quantified using the High Sensitivity DNA Qubit system (ThermoFisher, Paisley, UK). 16S libraries encompassing the V3 and V4 regions were generated by Glasgow Polyomics. Both sample sets were processed by the same technician and used the same reagents at different times. In brief, the V3 and V4 regions of bacterial 16S were amplified using Kapa HiFi Hotstart readymix (2×) (Kapa Biosystems, Wilmington, MA, USA) with the addition of primers specific for the V3 and V4 regions of 16S (based on the standard Illumina 16S primers), which contain an overlap sequence making the primers compatible with the Nextera XT indexing reagents (Illumina, San Diego, CA, USA). Samples were then amplified using a 5 min 95 °C hotstart followed by 26 cycles of 95 °C for 30 s and 60 °C for 1 min with a final elongation step of 60 °C for 5 min.
The resulting amplicons were purified using bead extraction (SPRI select beads, Beckman Coulter, Brea, CA, USA), using 0.9× beads followed by 80% ethanol washes and resuspension in 20 μL of 10 mM Tris buffer. The amplicons were quantified using the High Sensitiv-ity DNA Qubit system and profiles were obtained from an Agilent 2100 Bioanalyser using High Sensitivity DNA reagents (Agilent, Santa Clara, CA, USA).
Samples were then standardized to 10 ng per reaction and amplified in the presence of Nextera XT v2 indexes using Kapa Hifi Hotstart readymix (2×) for 8 cycles. The resulting indexed libraries were then purified and quality controlled as before.
Sequencing
The libraries were combined in equimolar ratios and sequenced on a MiSeq (Illumina, San Diego, CA, USA) instrument using a paired end, 2 × 300 bp, sequencing run. Samples were sequenced with an average of 50 000 reads per sample.
(Ambion™, AM9932, Thermo Fisher Scientific) instead of a DNA sample] through the whole analysis in con-junction with the samples. Water only samples were treated identically to samples. The resultant libraries were extremely low, this was significantly lower than samples by more than one order of magnitude. These libraries were not deemed suitable for sequencing due to the extremely low concentrations.
Analysis
FastQ files were quality filtered and trimmed using cut-adapt [30] with a minimum length of 250 bp per read and a minimum quality score of 25. Paired end reads were combined using Pandaseq [31], which were then combined into a single Fasta file using the QIIME pack-age [32]. Further processing and analysis was com-pleted using the QIIME wrapper and its packaged software: taxonomic classification was carried out using UCLUST [33] and alignment against the Greengenes database (gg13) [34] using the PyNAST algorithm [35]. Taxonomy was assigned [36–38], and alpha rarefaction and beta diversity analyzed [39]. Taxonomy bar charts were generated [40, 41]. Samples were analyzed as individual samples and as groups. Bar charts and clad-ograms representing the biomarkers discovered using LDA analysis were generated with LefSe [42].
Results
Alpha diversity in datasets
In total, 16S rRNA gene sequences (reads) of 751 bacte-rial genera were detected with at least one read in one sample in either or both of the datasets, 700 in dataset 1 and 660 in dataset 2. When rare sequences with < 5 reads in the total of 25 (dataset 1) or 24 (dataset 2) sam-ples were excluded, the number of genera in datasets 1 and 2 were 589 and 542, respectively. The number of genera with an average > 200 reads per sample was 45 and 25 in dataset 1 and 2, and the number of gen-era with median read number > 200 reads per sample 19 and 9 in datasets 1 and 2, respectively. Thus, most genera appeared with low read numbers and/or in few samples. The average total read number per sample was 98 711 in dataset 1 and 63 657 in dataset 2. The median of total read number per sample was 76 729 in dataset 1 and 68 364 in dataset 2.
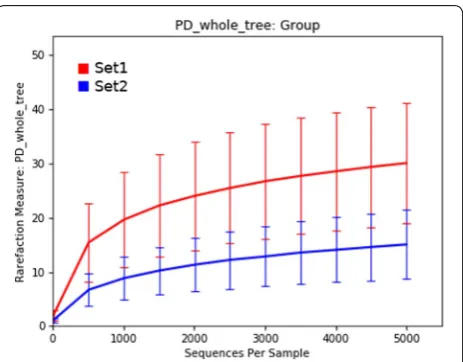
Analysis of the alpha diversity using whole tree phylo-genetic diversity (PD_whole_tree) revealed distinct dif-ferences in the species richness between the two datasets, with dataset 1 demonstrating much higher species rich-ness than dataset 2 even at very low sub-sampling levels (Figure 1).
The most common genera
In dataset 1, the genera detected with highest average read numbers per sample were Staphylococcus (average 30 534 reads/sample, 30.9% of all reads), Streptococcus (average 10 432 reads, 10.6% of all reads),
Corynebac-terium (average 9303 reads, 9.4% of all reads) and
Lac-tococcus (average 4402 reads, 4.5% of all reads). The
high average read number of Lactococcus was caused by one single sample with high Lactococcus read number. In dataset 2, the corresponding genera were
Methylo-bacterium (average 63 657 reads/sample, 50.2% of all
reads), Staphylococcus (average 17 574 reads, 13.9% of all reads), Corynebacterium (average 15 482 reads, 12.2% of all reads) and Calothrix (average 10 430 reads, 8.2% of all reads). The high read number for Calothrix was due to one sample PCR positive for Prototheca, where it covered 94% of the total reads. When look-ing at medians per sample, the most common genera in dataset 1 were Blautia (median read number 2437),
Sphingobacterium (median 1977), Treponema (median
1780) and Clostridium (median 1231), and in dataset 2
Methylobacterium (median 36 776), Corynebacterium
(median 2307), Blautia (median 649) and Staphylococ-cus (median 487). The distinct differences between the average and median suggest that Staphylococcus and
Streptococcus present a high average per sample due to
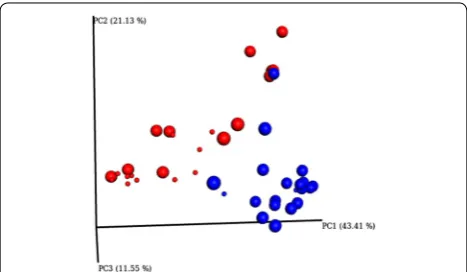
a small number of samples with overwhelming abun-dance of these genera, indicative of an active infection. Despite significant differences between infected and non-infected quarters (p = 0.009) the largest differences observed were seen in the separation of dataset 1 and dataset 2. This is demonstrated by PcoA analysis which clearly defines two groups (dataset 1 and dataset 2)
whilst the separation of infected vs non-infected is not very distinct through this analysis (Figure 2).
Relation between Ct values and read numbers
When the Ct value of the PCR analysis was low indicat-ing a high amount of pathogen DNA, the read number of the corresponding pathogen was high and the reads of that bacterial genus/species covered the majority of the total and relative amount of reads. Respectively, when the Ct value was high indicating low amount of pathogen DNA, the read number of the corresponding pathogen was smaller and the reads of that bacterial genus/spe-cies covered a smaller proportion of the total amount of reads. This relationship was seen in association with both major and minor pathogens and demonstrates the con-sensus between the two methodologies.
Samples PCR positive for major udder pathogens
All samples positive for major pathogens in the PCR assay were also positive according to the conventional culture, also all negative samples were negative in both assays. Six samples PCR positive for minor pathogens with rather high Ct values did not harbor bacterial growth in the cul-ture. PCR assay is used as the reference microbiological test in this study.
Staphylococcus aureus
In dataset 1 three samples were PCR positive for Staph.
aureus. In PCR the cycle threshold (Ct) values for Staph.
aureus in these samples were relatively low, < 30.0 (26.2–
28.9) indicating a moderate level of Staph. aureus DNA. Two of the samples were also PCR positive for NAS and one for C. bovis. The samples had a high amount, 90 550,
175 062, and 213 389, of Staphylococcus reads, which covered 96%, 97% and 93% of the total amounts of reads in these samples. Of the 11 PCR negative samples, in 10 samples Staphylococcus reads covered 0.16% to 1.62% of the total amount of reads in these samples, and in one sample 9.68%. In this and one other sample the PCR Ct values of Staphylococcus spp. were > 37.0 but < 40.0, indi-cating a low amount of Staphylococcus DNA. At species level, reads of Staph. aureus covered 88%, 89% and 92% of all Staphylococcus reads. Other Staphylococcus spe-cies with > 100 reads up to 298 reads were Staph.
agne-tis, Staph. chromogenes, Staph. devriesei, Staph. fleurettii,
Staph. gallinarum, Staph. intermedius, Staph.
pseudolug-dunens and Staph. xylosus. In the PCR negative
sam-ples, Staph. aureus reads covered 0 to 0.83% of the total amount of reads. The sample PCR positive for C. bovis in addition to Staph. aureus had 2816 Corynebacterium reads (1% of all reads). The C. bovis reads covered only 19% (426 reads) of all Corynebacterium reads. Other
Corynebacterium species with > 100 up to 582 reads were
C. efficiens, C. halotolerans, C. hansenii, C. marinum, and
C. xerosis. The read numbers of all other genera in these
three samples were low.
In dataset 2 only one sample was PCR positive for
Staph. aureus (Ct value 26.0). This sample was PCR
positive also for NAS and C. bovis (Ct 28.4). The level
of Staphylococcus reads was high, 370 539, and covered
96% of the total amount of reads in this sample. In the PCR negative samples Staphylococcus reads covered 0.11 to 1.28% of the total amount of reads. At species level, reads of Staph. aureus covered 99% of the total amount
of Staphylococcus reads. Other Staphylococcus species
with > 100 reads up to 455 reads were Staph. agnetis,
Staph. chromogenes, Staph. devriesei, Staph. epidermidis,
Staph. fleurettii, Staph. haemolyticus, Staph. intermedius,
and Staph. pseudolugdunens. The amount of
Corynebac-terium reads was 8154, 2% of the total amount of reads.
At species level, 61% of Corynebacterium reads belonged
to C. bovis. Another highly abundant species was C.
halo-tolerans, 18%.
Streptococcus uberis
Only one sample in dataset 1 was PCR positive for Strep.
uberis with a Ct value 22.8 indicating a large amount of
Strep. uberis DNA. The total Streptococcus read number
of this sample was 179 331 reads, which covered 96% of the total amount of reads. The next common genera
Blautia, Sphingobacterium, Treponema,
Staphylococ-cus and Bacteroides were represented with ≤ 554 reads. At species level, 95% of Streptococcus reads belonged to
Strep. uberis. The next common Streptococcus species
were Strep. orisratti (4%) and Strep. bovis (1%). Figure 2 3D Emperor PcoA plot demonstrating set variance and
In dataset 2, similarly only one sample was PCR posi-tive for Strep. uberis, but with a Ct value 34.9 indicating a low amount of Strep. uberis DNA. The number of
Strep-tococcus reads was 1037, 11% of the total amount of reads
in this sample. At species level, 97% of Streptococcus reads belonged to Strep. uberis. In this sample the genus
Methylobacterium had the highest read number which
covered 60% of the total amount of reads. All other gen-era were represented with low read numbers only.
Samples PCR positive for minor udder pathogens Non‑aureus staphylococci
In dataset 1, four samples were PCR positive for NAS only. The amount of Staphylococcus reads in these sam-ples were 190 208, 19 331, 9225 and 1419, which covered 95%, 35%, 5% and 2%, respectively, of the total amount of reads in these samples. In the PCR negative samples, only a low percentage of the total amount of reads was
Staphylococcus (see above). The PCR positive sample
for NAS with the highest Staphylococcus read number also demonstrated higher Staphylococcus DNA levels by PCR compared to the other three samples (Ct values 23.1 vs. 27.8, 28.7 and 34.6). In the sample with the low-est Ct value and highlow-est amount of Staphylococcus reads,
Staph. xylosus covered 90% of the Staphylococcus reads.
The other samples lacked a dominating Staphylococcus species and the species with highest read numbers were
S. arlettae, S. chromogenes, S. cohnii, S. fleurettii, S.
galli-narum, S. massiliensis, S. nepalensis, S.
pseudolugdunen-sis, S. sciuri and S. xylosus (in alphabetic order). The next
common genera in these samples were Treponema,
Strep-tococcus and Sphingobacterium.
In dataset 2, six samples were PCR positive for NAS only. The Ct values were all > 30.0: 31.2 to 36.6, indicat-ing a low amount of Staphylococcus DNA. The number
of Staphylococcus reads varied from 61 to 4160 and the
proportion of Staphylococcus reads of all reads from 0.2 to 6.3%. The Staphylococcus species with > 100 up to 902 reads in one or more samples were Staph. aureus, Staph.
equorum, Staph. haemolyticus, Staph. massiliensis, Staph.
sciuri and Staph. xylosus. The most common genera in
these samples were Methylobacterium, Helcococcus and
Corynebacterium.
Corynebacterium
In dataset 1, one sample was PCR positive for C. bovis alone with a Ct value 29.9. The number of Corynebacte-rium reads in this sample was 86 420, which covered 53% of the total amount of reads, 164 205. C. bovis covered 44% of Corynebacterium reads, C. halotolerans 42%, and the rest was covered by diverse Corynebacterium species. This sample had 38 249 Streptococcus reads, 23% of the total amount of reads. Two samples were PCR positive
for C. bovis and NAS. The Ct values for Corynebacterium
were 28.4 and 29.7 and the read numbers of
Corynebac-terium 121 371 and 4888, respectively. The proportions
of Corynebacterium reads in these two samples were 49%
and 11%, and proportions of Staphylococcus reads 15% and 2%, respectively.
In dataset 2, three samples were PCR positive for C.
bovis alone with Ct values 27.8, 29.1 and 30.3, and read
number 83 936, 9160 and 98 948, respectively. In these samples Corynebacterium reads covered 31%, 19% and 34% of the total amounts of reads, respectively. Addi-tionally, two samples were PCR positive for C. bovis and NAS, one sample for C. bovis and yeast, and one sample
for C. bovis, NAS and yeast. The Ct values for all
patho-gens in these samples were ≥ 30.0. The average number
of Corynebacterium reads in all 7 C. bovis PCR positive
samples was 39 905, the proportion of Corynebacterium reads varied from 7 to 49%. C. bovis covered 50% to 73% of all Corynebacterium reads, and the next most common species was C. halotolerans 14% to 30%. The proportion
of Methylobacterium reads in these samples varied from
42 to 67%. The proportion of Staphylococcus reads in the NAS positive samples varied from 1 to 11%.
Samples from healthy quarters
In dataset 1, four samples had a negative PCR result and a milk NAGase enzyme activity < 1, indicating a healthy quarter without inflammation. The genera with highest average and median read numbers (average/median) with the proportion of the total amount of reads (%) are listed in alphabetic order: Alicyclobacillus 2389/2328 (2.55%),
Bacteroides 2212/2684 (2.36%), Blautia 5064/4461
(5.40%), Bradyrhizobium 3095/2821 (3.30%), Clostridium 2690/2640 (2.87%), Corynebacterium 2525/1082 (2.69%),
Oscillospira 2018/1164 (2.15%), Sphingobacterium
2856/3233 (3.05%), Streptococcus 3970/3836 (4.24%), and
Treponema 2006/1702 (2.14%). Some genera had high
average read numbers caused by one single sample but lower medians and are not listed here.
In dataset 2, two samples had a negative PCR result and a milk NAGase enzyme activity < 1. The genus
Methylo-bacterium covered 93% of reads of these samples. The
next most common genera in both samples were Blautia with an average of 1035 reads (0.39% of all reads),
Rumi-nococcus (627, 0.24%), Corynebacterium (1406, 0.54%)
and Clostridium (497, 0.19%).
In dataset 1 six samples and in dataset 2 three samples were PCR negative but had milk NAGase values > 1 and were consequently not classified as samples from healthy quarters. One sample in dataset 1 was PCR positive for
Mycoplasma spp. with a Ct value 36.5. The microbiome
Differences between datasets 1 and 2
The results of the microbiome analyses of datasets 1 and 2 are distinctly different, as the bacterial gen-era with the highest read numbers in datasets 1 and 2, especially in PCR negative samples and samples PCR positive for minor pathogens, are very different. One sample, culture and PCR positive for Enterococcus
fae-calis/faecium with a Ct value 28.6 was included in both
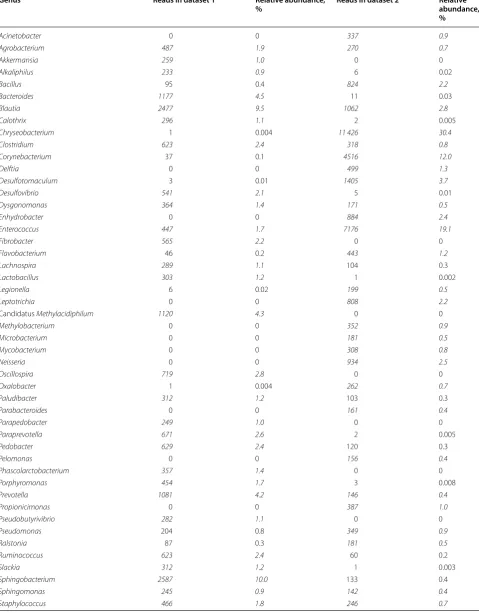
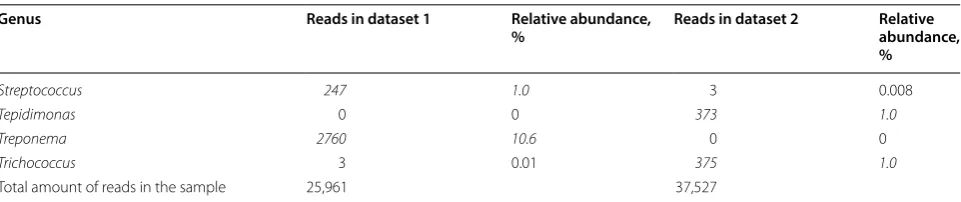
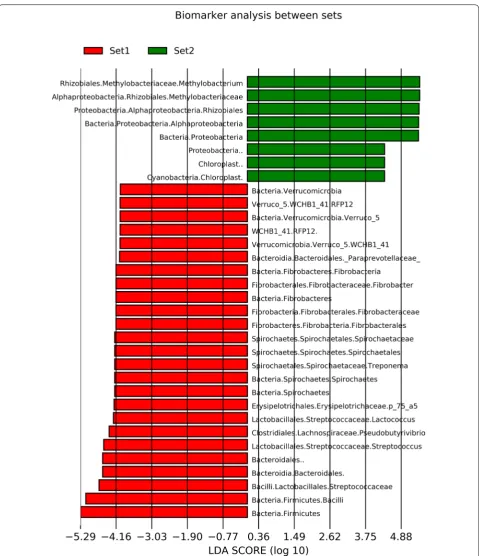
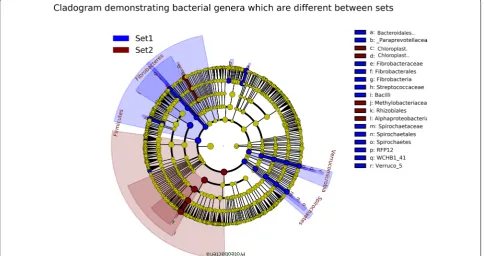
datasets and could be used as an example of differences between datasets. Table 1 shows the bacterial genera with highest number of reads in this sample in datasets 1 and 2. Thirty genera with highest number of reads of each dataset are included in the table, and only eight of these genera belong to the top 30 in both datasets. One of these 8 genera is Enterococcus, for which this sample was positive in microbiological testing. Twenty genera included in top 30 in one dataset have zero reads in the other dataset. In addition, 14 of these genera have only 1 to 11 reads in the other dataset. Table 2 shows the read numbers and relative abundance of all reads of the 19 genera with highest read numbers in datasets 1 and/ or 2. Linear discriminant analysis (LDA) was conducted between the two sets to identify genera/family level microbes which are significantly different between the two sets. Only microbes which were significantly differ-ent with an LDA score > 4 were included. These results reinforce the individual differences mentioned previ-ously with Methylobacterium being much more com-mon in dataset 2 compared to dataset 1. Streptococcus was also significantly different (Figures 3 and 4).
Discussion
The present study makes one more contribution to the complex issue on the microbiome of bovine milk, with some critical remarks. In our raw data, the total number of genera detected in the milk samples was over 700, if all findings starting from one read, were reported. However, findings with very low reads are unreliable and some cut-off for minimum reads should be used. In general singlets should be discounted to ensure that results are not sporadic. In fact, the data presented here suggests that there is a strong basis for discounting low read numbers due to differences between batches or sets. Studies on milk microbiome published so far have not given threshold for read numbers to be significant, which makes comparisons difficult. An important find-ing here was that results of the two datasets originat-ing from the same samploriginat-ing performed duroriginat-ing 1 day on one single herd differed, as some genera were present in all samples in one dataset but not detected in the other. The genera detected solely in one dataset are very likely
post-sampling contaminants which have appeared at some stage of the sample processing and analysis.
The most common phyla detected in mastitic milk samples in the present study, Firmicutes,
Actinobacte-ria, Bacteroides, and Proteobacteria, were the same as
have been reported in previous studies [21, 43]. Results from earlier studies have been contradictory. In the first published study on the mastitic milk microbiome, a high number of anaerobic bacterial sequences from genera
Fusobacterium and Porphyromonas, with sequences
belonging to Fusobacterium necrophorum were highly prevalent in all mastitic samples [16]. In this study, F.
nec-rophorum sequences were practically absent in healthy,
low SCC quarters, in contrast to our study, where genus
Fusobacterium was present also in healthy quarters. In
two studies, samples from quarters with clinical mastitis, with no growth in culture, were compared with samples from healthy quarters [17, 18]. Kuehn et al. [17] found significantly more Brevundimonas, Burkholderia,
Sphin-gomonas, and Stenotrophomonas in mastitic samples. In
another study the genus Sphingobacterium was signifi-cantly more abundant in quarters with increased milk SCC, as was Streptococcus [18].
It has been speculated that certain genera would rep-resent the “natural” microbiome of bovine milk [9, 10,
17, 18]. Logically, these genera should be present abun-dantly in milk from healthy quarters. Indeed, it has been reported that microbiota profiles from healthy quarters could clearly be discriminated from mastitic samples [18]. In our study the microbiota profiles of milk of mas-titic and healthy quarters differ as well, but the bacterial genera detected in samples of healthy quarters differ also between the datasets 1 and 2. In the study by Oikonomou et al. [18] four bacterial genera were present in all samples from healthy quarters: Faecalibacterium spp., unclassi-fied Lachnospiraceae, Propionibacterium spp. and
Aeri-bacillus spp.; also Nocardiodes and Paenibacillus were
Table 1 Microbiome results of the milk sample included in both datasets
Genus Reads in dataset 1 Relative abundance,
% Reads in dataset 2 Relative abundance, %
Acinetobacter 0 0 337 0.9
Agrobacterium 487 1.9 270 0.7
Akkermansia 259 1.0 0 0
Alkaliphilus 233 0.9 6 0.02
Bacillus 95 0.4 824 2.2
Bacteroides 1177 4.5 11 0.03
Blautia 2477 9.5 1062 2.8
Calothrix 296 1.1 2 0.005
Chryseobacterium 1 0.004 11 426 30.4
Clostridium 623 2.4 318 0.8
Corynebacterium 37 0.1 4516 12.0
Delftia 0 0 499 1.3
Desulfotomaculum 3 0.01 1405 3.7
Desulfovibrio 541 2.1 5 0.01
Dysgonomonas 364 1.4 171 0.5
Enhydrobacter 0 0 884 2.4
Enterococcus 447 1.7 7176 19.1
Fibrobacter 565 2.2 0 0
Flavobacterium 46 0.2 443 1.2
Lachnospira 289 1.1 104 0.3
Lactobacillus 303 1.2 1 0.002
Legionella 6 0.02 199 0.5
Leptotrichia 0 0 808 2.2
Candidatus Methylacidiphilum 1120 4.3 0 0
Methylobacterium 0 0 352 0.9
Microbacterium 0 0 181 0.5
Mycobacterium 0 0 308 0.8
Neisseria 0 0 934 2.5
Oscillospira 719 2.8 0 0
Oxalobacter 1 0.004 262 0.7
Paludibacter 312 1.2 103 0.3
Parabacteroides 0 0 161 0.4
Parapedobacter 249 1.0 0 0
Paraprevotella 671 2.6 2 0.005
Pedobacter 629 2.4 120 0.3
Pelomonas 0 0 156 0.4
Phascolarctobacterium 357 1.4 0 0
Porphyromonas 454 1.7 3 0.008
Prevotella 1081 4.2 146 0.4
Propionicimonas 0 0 387 1.0
Pseudobutyrivibrio 282 1.1 0 0
Pseudomonas 204 0.8 349 0.9
Ralstonia 87 0.3 181 0.5
Ruminococcus 623 2.4 60 0.2
Slackia 312 1.2 1 0.003
Sphingobacterium 2587 10.0 133 0.4
Sphingomonas 245 0.9 142 0.4
samples taken from healthy quarters were different from reported in our study or in the other studies.
In one study where effects of dry cow therapy on the microbiota of healthy quarters were investigated, the most abundant genera were Corynebacterium,
Acineto-bacter, Arthrobacter, Staphylococcus, and Psychrobacter
[21], i.e. different genera than reported in the other cited studies. Antimicrobial dry cow therapy had no effects on milk microbiome. Contradictory findings were reported in another study [22], where bacterial genera of the
phy-lum Proteobacteria increased in the colostrum samples
after dry cow therapy using a combination of penicillin and novobiocin. In that study, the phylum Firmicutes including the genus Butyrivibrio, and unclassified fami-lies Clostridiaceae and Bacillales, were the main bacteria in milk microbiota of healthy quarters before drying-off, which differs from previous studies. Lima et al. [43] studied microbiomes in colostrum samples of dairy cat-tle, finding Staphylococcus, Prevotella, Ruminococcaceae,
Bacteroidales, Clostridiales, and Pseudomonas as the
dominating genera. At family level, the most abundant families in samples from healthy quarters of twelve cows in an experimental mastitis study were Ruminococcaceae (mean 16.8%), Lachnospiraceae (mean 7.0%),
Aerococ-caceae (mean 6.8%), Enterobacteriaceae (mean 6.3%),
Planococcaceae (mean 5.7%), Bacteroidaceae (mean
5.4%), Corynebacteriaceae (mean 5.1%), Clostridiaceae (mean 4.2%), Bacillaceae (mean 3.5%), and
Staphylococ-caceae (mean 2.8%) [20]. As seen above, studies on milk
microbiome published so far have variable and often con-tradictory results.
It has been suggested that IMI would be a consequence of a dysbiosis of the mammary gland microbiome, and not merely an invasion of pathogenic bacteria from out-side the gland [9, 10]. This hypothesis has been based on studies previously referred to, where microbial com-munities of samples originating from healthy quarters have differed from those of mastitic samples. No direct scientific evidence for the dysbiosis theory has been
published. Another, maybe more likely explanation for the differences between microbiomes in mastitic and healthy quarters could be the changed composition of milk in mastitis. Mastitic milk and whey favor growth of different bacterial genera as compared with normal milk [44–46]. Species not belonging to udder pathogens like lactobacilli, Bacillus subtilis and Pseudomonas
fluo-rescens have been inhibited by mastitic milk, whereas
growth of known pathogens such as Staph. aureus and E. coli has been weaker in normal milk [44].
Microbiota present in milk samples drawn from mas-titic or healthy quarters do not represent the whole mammary gland but just milk from teat cistern and pos-sibly milk chamber of the udder, and we would not call the milk microbiome the same as the microbiome of the mammary gland. Microbiota in milk samples consist of microbes coming from an infected gland or extramam-mary sites or both, and also hypothetically, microbes belonging to the so-called natural microbiota of the mammary gland. To date, no scientific evidence on the presence of a natural microbiome in a healthy mammary gland is available [23]. In IMI the mammary gland is infected and microbes can be present in the duct system and other compartments of the gland, depending on the invasiveness of the pathogen, duration of IMI, and other factors [47]. In a lactating cow, the udder is an open sys-tem, and bacteria enter the gland via the teat canal. They can be transferred during milking, in particular during inappropriate changes in the vacuum level [48]. Bonsaglia et al. [21] reported a higher bacterial load in milk micro-biomes of samples taken at day 7 post-partum than in those taken at drying off, which may indicate the effect of milking on the milk microbiota. In a study investigating the impact of experimental mastitis treated with antimi-crobials on milk microbiota, the authors concluded that the mammary gland would have a resilient microbiome which is established after the exposure to antimicrobials [20]. This is logical, assuming that milk microbiota con-sists of microbes from outside of the gland, where they
The sample was positive for Enterococcus spp. in PCR and bacterial culture. Thirty bacterial genera with highest number of 16S reads in this sample in dataset 1 and in dataset 2, 52 bacterial genera in total, were included in this table. Only 8 genera belonged to the 30 genera with highest read numbers in both datasets. The number and relative amount of reads are italicized when belonging to the top 30.
Table 1 (continued)
Genus Reads in dataset 1 Relative abundance,
% Reads in dataset 2 Relative abundance, %
Streptococcus 247 1.0 3 0.008
Tepidimonas 0 0 373 1.0
Treponema 2760 10.6 0 0
Trichococcus 3 0.01 375 1.0
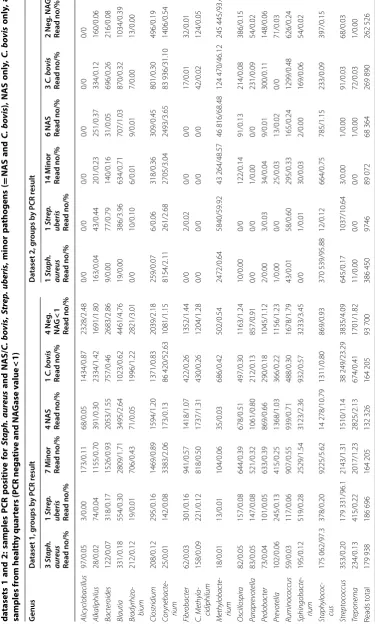
Table
2
M
edian r
ead numb
ers and r
ela
tiv
e abundanc
e (%)
of the t
otal r
ead numb
ers of the most c
ommon bac terial gener a f or diff er en
t sample gr
oups in
da
tasets 1 and 2: samples
PCR p ositiv e f or St aph. aureus and NAS/ C. b ovis , Strep . ub eris
, minor pa
tho gens ( = NAS and C. b ovis
), NAS only
, C. b
ovis only , and samples fr om health y quar
ters (PCR nega
tiv
e and NA
G
ase v
alue
<
1)
The number of samples in each ca
tegor
y is indica
ted
.
G
enus
Da
taset 1, g
roups b
y PCR r
esult
Da
taset 2, g
roups b y PCR r esult 3 Sta ph. aur eus Read no/% 1 Str ep . ub eris Read no/% 7 M inor Read no/%
4 NAS Read no/%
1 C. b ovis Read no/% 4 Neg . NA G < 1 Read no/% 1 Sta ph. aur eus Read no/% 1 Str ep . ub eris Read no/% 14 M inor Read no/%
6 NAS Read no/%
reflect bacterial genera present on body sites and the environment of the cow.
It is difficult to find support for the hypothesis on some metagenomic profile which would reflect a “normal” microbiome of the milk. During the milk sampling, con-tamination of the sample can occur at many stages of the procedure. Aseptic technique is the prerequisite for tak-ing good quality quarter milk samples [15]. However, in dairy farm conditions milk sampling is always challeng-ing, because there are many sources of contamination like cubicles, faeces, forage, barn air etc. [14, 15]. Metzger et al. [49] found that the composition of bacterial com-munity in milk samples differed between cows kept on different beddings. This indicates that the environment affects milk microbiomes even if milk is collected directly from the gland cistern as done in this study.
Among genera detected in milk samples, many belong to phyla and genera known to belong to the core micro-biome of the bovine rumen, like Prevotella,
Butyrivi-brio, Ruminococcus, Lachnospira, and Clostridium [50,
51]. Their presence in the milk samples is not surpris-ing as bacteria from the rumen also end up in faeces and on external body sites and the environment of the cow. Many genera reported in the milk like
Arthrobac-ter, Acinetobacter, and Psychrobacter are environmental
bacteria which can be detected in water, soil and other diverse habitats [52]. Despite thorough cleaning of the teat end prior to sampling, the teat canal and skin har-bor bacteria which easily can contaminate the sample. Non-aureus staphylococci and Corynebacteria are the most likely species in this respect [7, 53, 54]. Our sam-ples were taken on a large dairy farm with stanchion barns and straw bedding, where hygienic conditions were not optimal. Geographical conditions and sampling sites certainly have an impact on the microbiome detected in milk samples, and probably at least partially explain the very different microbiomes reported in various studies. This is supported by the study by Oikonomou et al. [18], who showed that discriminant analysis models could identify samples originating from different farms based on their microbial profiles. An interesting detail in our results was abundance of Calothrix in one mastitic sam-ple positive for Prototheca. This has also been reported by other authors [55], who suggested that the finding may be related to environmental factors or host immunity.
consistent with PCR and culture results. This is in line with previous studies where mastitis has been diagnosed using conventional culturing [16, 19]. When a major mas-titis pathogen Staph. aureus or Strep. uberis was detected by PCR in the milk sample with a low Ct value for that pathogen i.e. a high amount of DNA, the read numbers of these pathogens were high and formed the overwhelm-ing majority of read numbers in these samples. The same was true for minor pathogens NAS or C. bovis. On the contrary, if the Ct value for a minor pathogen was high in the PCR test, indicating low levels of DNA, the read number of that pathogen was also low and covered only a small proportion of the total read numbers in the sam-ple. Possible explanations for this phenomenon in quar-ters with low levels of minor pathogen DNA using PCR could be that the detected minor pathogens would ori-gin from the teat canal and skin, which also harbor large amount of microbiota belonging to diverse, often anaero-bic, genera, which are then also seen in the microbiota. In these samples, as well as in the samples from healthy quarters, bacterial genera such as Methylobacterium
and Treponema, appeared with high read numbers. One
explanation for the larger amount of diverse genera in PCR negative samples from healthy quarters could be that when the milk sample lacks DNA of udder patho-gens or their level is low, other genera, originating from other sources like teat orifice, barn air or environment, and laboratory sources during sample preparation, DNA extraction etc., have “space” during the amplification pro-cess in the microbiome analysis, i.e. have no competition and can be amplified in excess. For example, in dataset 1, the average proportion of Treponema is 2.4%. In the three Staph. aureus positive samples the proportion of
Treponema reads vary from 0.07 to 0.2%, and that of the
Strep. uberis positive sample is 0.2%. In the sample PCR
positive for NAS with Ct value 23.1 the proportion of
Treponema reads is also low, 0.03%. The same for
exam-ple with the genus Blautia, with an average proportion of 3.1% per sample. In the three Staph. aureus samples the proportion of Blautia reads were 0.1%, 0.1% and 0.2%, in the Strep. uberis sample 0.3% and in the NAS sam-ple 0.02%. Similarly in dataset 2, the average proportion
of Methylobacterium reads is 50% of all reads, but 0.6%
in the Staph. aureus positive sample. It has been shown that samples with originally low biomass and no clearly dominating genera, contaminating organisms can com-prise the majority of total sequences in the microbiome analysis [25, 52]. Milk samples from healthy quarters and quarters PCR positive with high Ct values could repre-sent this kind of low biomass samples.
Our two datasets clearly differed in that some gen-era, for example Alicyclobacillus, Bacteroides,
Candida-tus Methylacidiphilum, Fibrobacter, Methylobacterium,
Paraprevotella, Sphingobacterium, and Treponema were
present in one but almost or totally lacking in the other dataset. In addition, the genus Streptococcus was present with high read numbers in most of the dataset 1 samples but in dataset 2 was only seen in the Strep. uberis posi-tive sample. Most of these genera match with water and soil associated bacterial genera reported to contaminate samples in sequence-based microbiome analyses [52, 56,
57]. Contamination can occur during any step of sample handling and analysis, for instance laboratory reagents or kits have been shown to be contaminated at least in some cases [52]. In dataset 2, methylobacteria were detected in all samples and in most of them with high read numbers. The mean Methylobacterium spp. read number per sam-ple was 63 656 (median 36 776) reads (min 352, max 261 148). The Methylobacterium read numbers were approxi-mately 100-fold higher in samples from healthy quarters compared with samples with major mastitis pathogens. In dataset 1 methylobacteria were not common: the mean read number per sample for different
Methylo-bacterium species was only 321 (median 90) reads (min
0, max 3355 reads). The milk sample analyzed in both datasets but with different results for a substantial part of bacterial genera detected (Table 1) raises questions about the consistency of microbiome analytics on milk sam-ples. The DNA extraction of sets 1 and 2 were performed at different times and using different batch of the DNA isolation kits. It is likely that contamination during some step of the process has occurred. This is not exceptional, but a common and difficult to avoid problem in sensitive next-generation sequencing analyses [25].
We conclude that a critical assessment is necessary for assessing the results of milk microbiome analyses. What are the roles of the numerous different genera and spe-cies detected in the milk, are they endogenous or invad-ers, pathogens, commensals or contaminants? For a true understanding of the role and significance of the micro-biota in the mammary ecosystem more research on their presence and dynamics in health and disease, as well as in different environments and production systems of dairy cattle, is necessary. Furthermore, sampling and analy-ses should be carried out according to the best practices agreed for 16S microbiome research.
Acknowledgements
We thank DVM, PhD Piret Kalmus, Department of Clinical Medicine, Institute of Veterinary Medicine and Animal Science, Estonian University of Life Sciences, for providing the possibility to collect milk samples for the study.
Authors’ contributions
contributed to the study design, data sampling and drafted the manuscript. All authors read and approved the final manuscript.
Funding
This study was supported by Walter Ehrström Foundation.
Availability of data and materials
Data are available from the authors on request.
Ethics approval and consent to participate
The experiment was approved by the Commission of Animal Trials at the Estonian Ministry of Agriculture (No 7.2–11/1).
Competing interests
The authors declare that they have no competing interests.
Author details
1 Department of Production Animal Medicine, Faculty of Veterinary Medicine, University of Helsinki, Helsinki, Finland. 2 Glasgow Polyomics, College of Medi-cal, Veterinary and Life Sciences, University of Glasgow, Glasgow, UK. 3 Institute of Biodiversity, Animal Health and Comparative Medicine, College of Medical, Veterinary and Life Sciences, University of Glasgow, Glasgow, UK.
Received: 22 February 2019 Accepted: 13 May 2019
References
1. Watts JL (1988) Etiological agents of bovine mastitis. Vet Microbiol 1:41–66
2. Levison LJ, Miller-Cushon EK, Tucker AL, Bergeron R, Leslie KE, Barkema HW, De Vries TJ (2016) Incidence rate of pathogen-specific clinical mastitis on conventional and organic Canadian dairy farms. J Dairy Sci 99:1341–1350
3. Vakkamäki J, Taponen S, Heikkilä A-M, Pyörälä S (2017) Bacteriological etiology and treatment of mastitis in Finnish dairy herds. Acta Vet Scand 59:33
4. Verbeke J, Piepers S, Supré K, De Vliegher S (2014) Pathogen-specific incidence rate of clinical mastitis in Flemish dairy herds, severity, and association with herd hygiene. J Dairy Sci 97:6926–6934
5. Koskinen MT, Wellenberg GJ, Sampimon OC, Holopainen J, Rothkamp A, Salmikivi L, van Haeringen W, Lam TJGM, Pyörälä S (2010) Field com-parison of real-time polymerase chain reaction and bacterial culture for identification of bovine mastitis bacteria. J Dairy Sci 93:5707–5715 6. Keane OM, Budd KE, Flynn J, McCoy F (2013) Increased detection of
mastitis pathogens by real-time PCR compared to bacterial culture. Vet Rec 173:268–273
7. Hiitiö H, Simojoki H, Kalmus P, Holopainen J, Pyörälä S, Taponen S (2016) The effect of sampling technique on PCR-based bacteriological results of bovine milk samples. J Dairy Sci 99:6532–6541
8. Tolle A (1980) The microflora of the udder. In: Factors influencing the bacteriological quality of raw milk. Bull Int Dairy Fed, vol 120, pp 4 9. Addis MF, Tanca A, Uzzau S, Oikonomou G, Bicalho RC, Moroni P (2016)
The bovine milk microbiota: insights and perspectives from-omics stud-ies. Mol Biosyst 12:2359–2372
10. Derakhshani H, Fehr KB, Sepehri S, Francoz D, De Buck J, Barkema HW, Plaizier JC, Khafipour E (2018) Invited review: microbiota of the bovine udder: contributing factors and potential implications for udder health and mastitis susceptibility. J Dairy Sci 101:10605–10625
11. Turnbaugh PJ, Ley RE, Hamady M, Fraser-Liggett C, Knight R, Gordon JI (2007) The human microbiome project: exploring the microbial part of ourselves in a changing world. Nature 449:804–810
12. Hunt KM, Foster JA, Forney LJ, Schütte UM, Beck DL, Abdo Z, Fox LK, Williams JE, McGuire MK, McGuire MA (2011) Characterization of the diversity and temporal stability of bacterial communities in human milk. PLoS One 6:e21313
13. Cabrera-Rubio R, Collado MC, Laitinen K, Salminen S, Isolauri E, Mira A (2012) The human milk microbiome changes over lactation and is shaped by maternal weight and mode of delivery. Am J Clin Nutr 96:544–551
14. Vangroenweghe F, Dosogne H, Mehrzad J, Burvenich C (2001) Effect of milk sampling techniques on milk composition, bacterial contamination, viability and functions of resident cells in milk. Vet Res 32:565–579 15. Middleton JR, Fox LK, Pighetti G, Petersson-Wolfe C (eds) (2017)
Labora-tory handbook on bovine mastitis, 3rd edn. National Mastitis Council Inc, New Prague
16. Oikonomou G, Machado VS, Santisteban C, Schukken YH, Bicalho RC (2012) Microbial diversity of bovine mastitic milk as described by pyrose-quencing of metagenomic 16s rDNA. PLoS One 7:e47671
17. Kuehn JS, Gorden PJ, Munro D, Rong R, Dong Q, Plummer PJ, Wang C, Phillips GJ (2013) Bacterial community profiling of milk samples as a means to understand culture-negative bovine clinical mastitis. PLoS One 8:e61959
18. Oikonomou G, Bicalho ML, Meira E, Rossi RE, Foditsch C, Machado VS, Teixeira AGV, Santisteban C, Schukken YH, Bicalho RC (2014) Microbiota of cow’s milk; distinguishing healthy, sub-clinically and clinically diseased quarters. PLoS One 9:e85904
19. Ganda EK, Bisinotto RS, Lima SF, Kronauer K, Decter DH, Oikonomou G, Schukken YH, Bicalho RC (2016) Longitudinal metagenomics profiling of bovine milk to assess the impact of intramammary treatment using a third-generation cephalosporin. Sci Rep 6:37565
20. Ganda EK, Gaeta N, Sipka A, Pomeroy B, Oikonomou G, Schukken YH, Bicalho RC (2017) Normal milk microbiome is reestablished following experimental infection with Escherichia coli independent of intramam-mary antibiotic treatment with a third-generation cephalosporin in bovines. Microbiome 5:74
21. Bonsaglia ECR, Gomes MS, Canisso IF, Zhou Z, Lima SF, Rall VLM, Oikono-mou G, Bicalho RC, Lima FS (2017) Milk microbiome and bacterial load following dry cow therapy without antibiotics in dairy cows with healthy mammary gland. Sci Rep 7:8067
22. Derakhshani H, Plaizier JC, De Buck J, Barkema HW, Khafipour E (2018) Composition of the teat canal and intramammary microbiota of dairy cows subjected to antimicrobial dry cow therapy and internal teat seal-ant. J Dairy Sci 101:10191–10205
23. Rainard P (2017) Mammary microbiota of dairy ruminants: fact or fiction? Vet Res 48:25
24. Metzger SA, Hernandez LL, Garret SG, Pamela L, Ruegg PL (2018) Under-standing the milk microbiota. Vet Clin Food Anim 34:427–438 25. Kim D, Hofstaedter CE, Zhao C, Mattei L, Tanes C, Clarke E, Lauder A,
Sherrill-Mix S, Chehoud C, Kelsen J, Conrad M, Collman RG, Baldassano R, Bushman FD, Bittinger K (2017) Optimizing methods and dodging pitfalls in microbiome research. Microbiome 5:52
26. Pollock J, Glendinnin L, Wisedchanwet T, Watson M (2018) The madness of microbiome: attempting to find consensus “Best Practice” for 16S microbiome studies. Appl Environ Microbiol 84:e02627-17 27. Hogan JS, González RN, Harmon RJ, Nickerson SC, Oliver SP, Pankey
JW, Smith KL (1999) Laboratory handbook on bovine mastitis, Rev ed. National Mastitis Council, Madison
28. Mattila T, Sandholm M (1985) Antitrypsin and N
-acetyl-β-dglucosaminidase as markers of mastitis in herd of Ayrshire cows. Am J Vet Res 46:2453–2456
29. Hovinen M, Simojoki H, Pösö R, Suolaniemi J, Kalmus P, Suojala L, Pyörälä S (2016) N-acetyl-β-d-glucosaminidase activity in cow milk as an indicator of mastitis. J Dairy Res 83:219–227
30. Martin M (2011) Cutadapt removes adapter sequences from high-throughput sequencing reads. EMBnet J 17:10–12
31. Masella AP, Bartram AK, Truszkowski JM, Brown DG, Neufeld JD (2012) PANDAseq: paired-end assembler for illumina sequences. BMC Bioinfor-matics 13:31
32. Caporaso JG, Kuczynski J, Stombaugh J, Bittinger K, Bushman FD, Costello EK, Fierer N, Pena AG, Goodrich JK, Gordon JI, Huttley GA, Kelley ST, Knights D, Koenig JE, Ley RE, Lozupone CA, McDonald D, Muegge BD, Pirrung M, Reeder J, Sevinsky JR, Turnbaugh PJ, Walters WA, Widmann J, Yatsunenko T, Zaneveld J, Knight R (2010) QIIME allows analysis of high-throughput community sequencing data. Nat Methods 7:335–336 33. Edgar RC (2010) Search and clustering orders of magnitude faster than
BLAST. Bioinformatics 26:2460–2461
•fast, convenient online submission •
thorough peer review by experienced researchers in your field • rapid publication on acceptance
• support for research data, including large and complex data types •
gold Open Access which fosters wider collaboration and increased citations maximum visibility for your research: over 100M website views per year •
At BMC, research is always in progress.
Learn more biomedcentral.com/submissions
Ready to submit your research? Choose BMC and benefit from:
35. Caporaso JG, Bittinger K, Bushman FD, DeSantis TZ, Andersen GL, Knight R (2010) PyNAST: a flexible tool for aligning sequences to a template alignment. Bioinformatics 26:266–267
36. Wang Q, Garrity GM, Tiedje JM, Cole JR (2007) Naive Bayesian classifier for rapid assignment of rRNA sequences into the new bacterial taxonomy. Appl Environ Microbiol 73:5261–5267
37. McDonald D, Price MN, Goodrich J, Nawrocki EP, DeSantis TZ, Probst A, Andersen GL, Knight R, Hugenholtz P (2012) An improved Greengenes taxonomy with explicit ranks for ecological and evolutionary analyses of bacteria and archaea. ISME J 6:610–618
38. Werner JJ, Koren O, Hugenholtz P, DeSantis TZ, Walters WA, Caporaso JG, Angenent LT, Knight R, Ley RE (2012) Impact of training sets on clas-sification of high-throughput bacterial 16s rRNA gene surveys. ISME J 6:94–103
39. Price MN, Dehal PS, Arkin AP (2010) FastTree 2—approximately maximum-likelihood trees for large alignments. PLoS One 5:e9490 40. Lozupone C, Knight R (2005) UniFrac: a new phylogenetic method for
comparing microbial communities. Appl Environ Microbiol 71:8228–8235 41. Vázquez-Baeza Y, Pirrung M, Gonzalez A, Knight R (2013) EMPeror: a tool
for visualizing high-throughput microbial community data. Gigascience 2:16
42. Segata N, Izard J, Waldron L, Gevers D, Miropolsky L, Garrett WS, Hut-tenhower C (2011) Metagenomic biomarker discovery and explanation. Genome Biol 12:R60
43. Lima SF, Teixeira AGV, Lima FS, Ganda EK, Higgins CH, Oikonomou G, Bicalho RC (2017) The bovine colostrum microbiome and its association with clinical mastitis. J Dairy Sci 100:3031–3042
44. Kaartinen L, Ali-Vehmas T, Mattila T, Sandholm M (1989) Bacterial growth in mastitis whey in relation to bacterial association with mastitis. Vet Microbiol 21:155–163
45. Mattila-Sandholm T, Alivehmas T, Kaartinen L, Honkanen-Buzalski T (1990) Growth characteristics of Staphylococcus aureus and Escherichia coli in whey from sequentially infected milk. Acta Vet Scand 31:169–174 46. Fang W, Shi M, Huang L, Shao Q, Chen J (1993) Growth of Lactobacilli,
Staphylococcus aureus and Escherichia coli in normal and mastitic milk and whey. Vet Microbiol 37:115–125
47. Schukken YH, Gunther J, Fitzpatrick J, Fontaine MC, Goetze L, Holst O, Leigh J, Petzl W, Schuberth H-J, Sipka A, Smith DGE, Quesnell R, Watts J, Yancey R, Zerbe H, Gurjar A, Zadoks RN, Seyfert H-M, Members of the Pfizer mastitis research consortium (2011) Host-response patterns of
intramammary infections in dairy cows. Vet Immunol Immunopathol 144:270–289
48. Rasmussen MD, Frimer ES, Decker EL (1994) Reverse pressure gradients related to machine milking across the teat canal. J Dairy Sci 77:984–993 49. Metzger SA, Hernandez LL, Skarlupka JH, Suen G, Walker TM, Ruegg PL (2018) Influence of sampling technique and bedding type on the milk microbiota: results of a pilot study. J Dairy Sci 101:6346–6356
50. Henderson G, Cox F, Ganesh S, Jonker A, Young W, Global Rumen Census Collaborators, Janssen PH (2015) Rumen microbial community composi-tion varies with diet and host, but a core microbiome is found across a wide geographical range. Sci Rep 5:14567
51. Latham EA, Weldon KK, Wickersham TA, Coverdale JA, Pinchak WE (2018) Responses in the rumen microbiome of Bos taurus and indicus steers fed a low-quality rice straw diet and supplemented protein. J Anim Sci 96:1032–1044
52. Salter SJ, Cox MJ, Turek EM, Calus ST, Cookson WO, Moffatt MF, Turner P, Parkhill J, Loman NJ, Walker AW (2014) Reagent contamination can criti-cally impact sequence-based microbiome analyses. BMC Biol 12:87 53. Gill JJ, Sabour PM, Gong J, Yu H, Leslie KE, Griffiths MW (2006)
Charac-terization of bacterial populations recovered from the teat canals of lactating dairy and beef cattle by 16S rRNA gene sequence analysis. FEMS Microbiol Ecol 56:471–481
54. Braem G, De Vliegher S, Verbist B, Piessens V, Van Coillie E, De Vuyst L, Leroy F (2013) Unraveling the microbiota of teat apices of clinically healthy lactating dairy cows, with special emphasis on coagulase-nega-tive staphylococci. J Dairy Sci 96:1499–1510
55. Kano R, Kobayashi Y, Nishikawa A, Murata R, Itou T, Ito T, Suzuki K, Kamata H (2018) Next-generation sequencing analysis of bacterial flora in bovine Prototheca mastitic milk. Med Mycol J 59:E41–E46
56. Laurence M, Hatzis C, Brash DE (2014) Common contaminants in next-generation sequencing that hinder discovery of low-abundance microbes. PLoS One 9:e97876
57. Weiss S, Amnon A, Hyde ER, Metcalf JL, Song SJ, Knight R (2014) Tracking down the sources of experimental contamination in microbiome studies. Genome Biol 15:564
Publisher’s Note