Determinants of Well-being for Developing and Developed
Countries and their Role in Policy-making: A Panel Data Analysis
Jason Wei Jian Nga
Santha Vaithilingamb
Jing Moon Chuac Monash University Malaysia
Abstract: The gross domestic product has been the traditional indicator used to measure economic growth, with almost every country having national policies that are growth-centric in nature. Underlying this practice is the assumption that higher income levels precede higher levels of utility, or well-being. However, the Easterlin paradox discovered by Easterlin in the 1970s contradicts this economic assumption and has subsequently ignited interest in the study of subjective well-being and its determinants. Using the countries’ responses to the life satisfaction question in the World Values Survey as the measure of subjective well-being over a period of time, this study utilises panel data techniques to identify the key determinants of life satisfaction for developing and developed countries. The study also determines the relative importance of these key determinants for the two groups of countries. The findings of this study show that the determinants of life satisfaction differ across developed and developing countries, with religiosity being the only common determinant. The policy implications of these findings are discussed.
Keywords: GDP, panel data, subjective well-being, World Values Survey JEL classification: I31, Z10
1. Introduction
The well-being of a nation has traditionally been associated with its socio-economic progress, measured by its gross domestic product (GDP). Underlying this notion is the utility theory which posits that high levels of utility are preceded by high levels of income. This is further evidenced by the frequent association of GDP with social welfare or the ‘standard of living’ (Van den Bergh, 2009).
In recent times, however, GDP is increasingly viewed as an inadequate measure of well-being. Macroeconomic data such as GDP reveals very little about how people feel,
a Department of Econometrics and Business Statistics, Global Asia in the 21st Century Research Platform,
Monash University Malaysia, 47500 Bandar Sunway, Selangor, Malaysia. Email: [email protected] (Corresponding author)
b Department of Econometrics and Business Statistics, Global Asia in the 21st Century Research Platform,
Monash University Malaysia, 47500 Bandar Sunway, Selangor, Malaysia. Email: santha.vaithilingam@ monash.edu
c Department of Econometrics and Business Statistics, Monash University Malaysia, 47500 Bandar Sunway,
Selangor, Malaysia. Email: [email protected]
and how it affects them psychologically (Perovic & Golem, 2010). As aptly put by Di Tella and MacCulloch (2006), “Economists are trained to infer preferences from observed choices; that is, economists typically watch what people do, rather than listening to what people say” (p. 25). Subsequently, there has been a departure from this tradition and a growth in interest among economists on the determinants of subjective well-being, defined as people’s own affective and cognitive evaluation of their lives (Vittersø, Biswas-Diener, & Diener, 2005). Some identified determinants in the literature include unemployment (Clark & Oswald, 1994; Ohtake, 2012), health (Deaton, 2008), and social capital (Helliwell, 2006). However, the literature has been inconclusive for some of the determinants due to the following plausible reasons: first, many studies investigated the determinants individually and separately, ignoring potential estimate biases that may arise from omitting other relevant and important factors. Second, the empirical findings may be dependent on the sample of countries used in the study (Bjørnskov, 2003), which are predominantly developed countries due to the availability of data.
Generalising the findings for developed countries “to populations and settings other than those studied” (Lucas, 2003), such as developing countries, may not be an accurate representation. In particular, Clark, Etilé, Postel-Vinay, Senik and Van der Straeten (2005) noted that there is no justification to accept that the determinants of well-being are indistinguishable across people. For example, Delhey (2010) found that there was “convincing evidence for a systematic difference in the determinants of happiness” (p. 81), where “happiness tends to be pretty materialist in poorer places, and more post-materialist in richer ones” (p. 81). To this extent, relatively little is still known about the determinants of happiness for developing countries (Conceição & Bandura, 2008).
At this juncture, it is helpful to distinguish the terms ‘happiness’ and ‘life satis-faction’. Although both are components of subjective well-being, happiness is an affective element, while life satisfaction is a cognitive element (Conceição & Bandura, 2008). Nevertheless, economists have commonly used these terms interchangeably as measures of subjective well-being (Easterlin, 2004). However, on the basis of this study’s data set, this study ascribes to life satisfaction as the measure of subjective well-being.
There is generally a wide consensus on the main determinants of life satisfaction at the individual level. In contrast, cross-country differences in life satisfaction have yet to reach a consensus in identifying the national-level variables that are important for well-being, except for national income (Bjørnskov, Dreher, & Fischer, 2008). Specifically, Bjørnskov et al. (2008) noted the contrasting statistical significance of several aggregate variable determinants across various research studies. Therefore, there is a gap in the literature on national-level determinants of well-being.
for improved inference of model parameters (Hsiao, Mountain, & Illman, 1995), and that accounts for the impact of omitted variables that are largely unobservable. This improves upon previous studies that ignore the individual heterogeneity amongst countries that may result in biased estimates (e.g. Helliwell & Wang, 2013). Finally, in comparison to most studies that are either country or region specific, this study seeks to identify the specific factors that influence subjective well-being for a sample of developing and developed countries. This study will therefore also add to the relatively scant literature on the determinants of well-being for developing countries.
The study also determines the relative importance of the key factors influencing subjective well-being for developing and developed countries. This has important policy implications. The findings from this study can provide valuable insights to policy makers into the key factors that should be prioritised by providing an enabling environment based on what society values most to improve the level of subjective well-being, especially for developing countries where resources are constrained (Deaton, 2008; Easterlin, 2013).
The paper is organised as follows. Section 2 reviews the literature on some of the key determinants of subjective well-being identified in the literature. Section 3 describes the sources and computation of the data and explains the panel data methodology employed in the regression analysis. The estimation results and discussion are presented in Section 4. Section 5 summarises the results and discusses the policy implications. Section 6 concludes.
2. Literature Review
Numerous determinants of life satisfaction have been identified in the burgeoning literature on subjective well-being. There are primarily two strands of literature – determinants of life satisfaction at the individual level and determinants of life satisfaction at the national level. This section will review some of the key determinants of well-being from both strands of literature. In particular, this section will review the following determinants that will be used in our empirical analysis: income, income inequality, unemployment, health, religiosity, institutional factors and social capital.
Cross-country evidence shows that this positive relationship tapers for countries with higher levels of income, suggesting a nonlinear relationship between income and subjective well-being (Helliwell, 2003; Inglehart, 2000). Once countries move beyond a certain stage of economic development, societies will begin to demand a better quality of life that pertains to more intangible aspects such as relationships and protecting the environment (Clark, Frijters, & Shields, 2008). This explanation is in tandem with Delhey’s (2010) conclusion that subjective well-being tends to be more post-materialist in richer countries.
In comparison to the large body of research on income and subjective well-being, there is relatively less research investigating the relation between income inequality and subjective well-being. Existing research on this relation has also produced mixed results, with the significance and direction of relation still being widely disputed. While a few studies show that income inequality has no relationship with subjective well-being (Helliwell, 2003; Senik, 2002), using the Gini coefficient as a measure of income inequality, Alesina, Di Tella and MacCulloch (2004) discovered that income inequality has a stronger effect on subjective well-being in Europe than in the USA. The authors attributed this observation to the characterisation of European society as being socially less mobile (i.e. less ability for individuals to move up the income brackets), causing an aversion to inequality. Studies by Graham and Felton (2006), Oshio and Kobayashi (2011) and Schwarze and Härpfer (2007) also reported a negative relationship between income inequality and subjective well-being.
In contrast, some studies have shown a positive relationship between income inequality and subjective well-being. For example, in Britain, Clark (2003b) found that whilst well-being falls with the increase in the average income of the reference group, there is a significant positive association between well-being and reference group income inequality. In other words, as the income distribution of an individual’s reference group widens, the well-being of the individual increases – individuals appear to be “inequality-loving rather than inequality averse” (p. 11). In such situations, Clark (2003b) argued that inequality contains an aspect of opportunity for individuals.
Studies have consistently shown the negative effect of individual unemployment on subjective well-being to be huge (Clark & Oswald, 1994; Di Tella, MacCulloch, & Oswald, 2001; Helliwell, 2003). Frey and Stutzer (2002) explained this negative association by noting that the low levels of subjective well-being experienced among the unemployed is due to non-pecuniary costs such as psychic cost and social cost. Moreover, unemployment also leads to feelings of reduced control and helplessness (Goldsmith, Veum, & Darity, 1996).
From a macro perspective, studies have also found that general unemployment may decrease overall levels of subjective well-being, even amongst the employed (Alesina, Di Tella, & MacCulloch, 2004; Di Tella, MacCulloch, & Oswald, 2001; Frey & Stutzer, 2002). This could be attributed to either the employed feeling bad about the unfortunate plight of the unemployed, or it could stem from the worry of potential hikes in taxes that may occur in order to fund unemployment contributions. During periods of high unemployment, the employed may also worry about losing their jobs.
2003a; Frey & Stutzer, 2002; Layard, 2005). For example, as an extreme case, Graham (2009) found that a higher unemployment rate was positively correlated with subjective well-being in Russia and Latin American countries, lending support to the debate that being unemployed against a backdrop of high unemployment rates reduces the social ignominy of being unemployed.
Several individual-level studies that examined the relationship between health and subjective well-being concentrate on the subjective well-being of people who suffer from illnesses or are recovering from serious accidents (Easterlin, 2003; Oswald & Powdthavee, 2008). As reviewed by Easterlin (2003), victims of serious illnesses or accidents will first report a great reduction in life satisfaction. Although people may adapt to circumstances and recover from the initial drop in life satisfaction, the recovery is not substantial and hence, such incidents will still have a lasting negative effect on life satisfaction (Oswald & Powdthavee, 2008). Similarly, Diener and Seligman (2004) reviewed literature in the medical field and found that people with severe illnesses do not always adapt to them.
Also considered in empirical studies is the relationship between self-reported health and subjective well-being. Easterlin (2003) found that self-reported health declines throughout one’s lifetime, and that people who report themselves as less healthy are also less happy. Easterlin (2003) concluded that detrimental health changes have a permanent and negative impact on subjective well-being, and that adaptation is incomplete to deteriorating health. Helliwell (2003) also found that when life expectancy is used as a measure of health, there was no significant relationship between life-expectancy and subjective well-being at the national level.
There is relatively consistent evidence that frequent participation in religious activities improves subjective well-being (Clark & Lelkes, 2005; Hayo, 2004). Using the rating of the importance of God in one’s life, and frequency of church participation as proxies for religiosity from the WVS, Helliwell (2003) reported a strong positive linkage between these religiosity variables and life satisfaction, with the importance of God on happiness being almost three times larger than that of frequency of church attendance. This implies that the impact of support provided by religious beliefs on subjective well-being is different from the effects of receiving social support from attending church activities.
Religion has also been found to have a buffering impact on subjective well-being against economic stressors such as unemployment, poor financial status and widowhood for individuals (Clark & Lelkes, 2003). Lelkes (2006) revealed that the association between income and subjective well-being for religious individuals is weaker than that of their non-religious counterparts, leading Lelkes to suggest that religiosity may insure uncertainties from economic changes. This suggestion was also supported by Popova (2014).
There is also evidence that the level of subjective well-being is independent of the religion to which one belongs to (Rehdanz & Maddison, 2005). However, within a religion itself, there tends to be a huge variation in the levels of subjective well-being amongst the followers and believers (Haller & Hadler, 2006; Cohen, 2002).
contended that direct democracy should increase the well-being of citizens because politicians are held more accountable due to the active monitoring role of citizens. Therefore, government decisions will be more aligned to the needs and interests of the nation, thereby raising the level of well-being of people (Frey & Stutzer, 2000). Owen, Videras and Willemsen (2008) attributed the positive association between democracy and well-being to the opportunity to engage in the political process. In addressing whether various ways of institutionalising democracy affects well-being, Altman, Flavin and Radcliff (2017) employed individual and aggregate-level data for OECD countries from 1981-2008 and found robust evidence that the influence of the different types of democratic institutions for subjective well-being are substantial.
On the other hand, studies (e.g. Bjørnskov et al., 2008) have found no direct relationship between democracy and subjective well-being. In addressing the causality question if democracy causes subjective well-being, Inglehart (2006) argued that if a society’s level of subjective well-being is determined hugely by the level of democracy, the explosion of democracy which happened in around 1990 should have been accompanied by sharp increases in the level of subjective well-being. However, this did not happen. On the contrary, the correlation between subjective well-being and democracy became weaker.
Helliwell (2003) and Helliwell and Huang (2008) investigated the effect of quality of governance and other societal variables on the level of subjective well-being. Constructing an index to measure governance quality, Helliwell (2003) reported that a higher quality of governance was statistically significant in increasing the average of life satisfaction. This is because a higher quality of governance implies the provision of a higher quality of government services for its people which can be depended on with confidence, meeting the demands of the economy and expectations for the future.
Social capital has been prevalent in the field of social sciences since the work of Coleman (1988, 1990). Coleman (1988) defined social capital by its function whereby, “it is not a single entity but a variety of different entities consisting of two common components: they all consist of some aspect of social structures, and they facilitate certain actions of individuals within the structure” (p. S98). In particular, Coleman proposed thrust and obligations as one of the three distinct forms of social capital, the other two being information channels, and norms and effective sanctions.
The measure of trust towards other people has been used as a key proxy for social capital in the well-being literature. Helliwell (2003, 2006) found that trust in most other people results in higher levels of well-being. Similar findings are also reported by Li, Pickles and Savage (2005) for the United Kingdom, where the authors concluded that neighbourhood social trust increases life satisfaction. Besides trust of other people, trust in the legal and public institutions is also positively correlated with increased well-being (Hudson, 2006).
Much of the literature has examined only a subset of the factors that are important for well-being. As such, this study takes a more holistic approach by examining the key determinants that contribute to well-being of countries using a robust estimation method.
3. Data and Methodology 3.1 Data and Variables
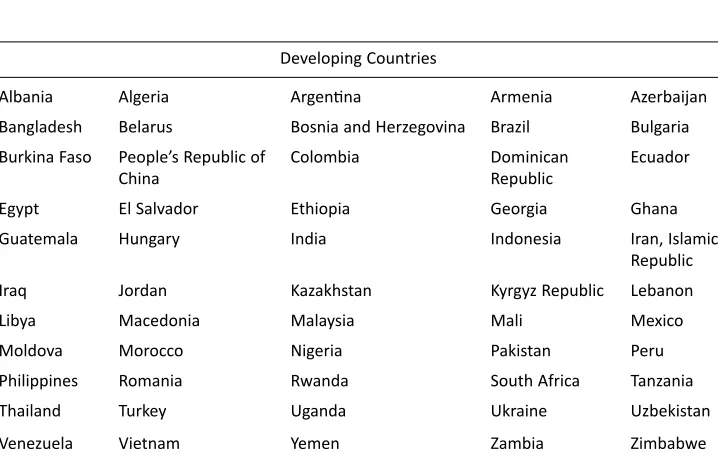
This study involved a sample size of 90 countries, with the countries categorised as either developing or developed, following the classification scheme proposed by the World Bank.1 Based on this classification scheme, there are 55 and 35 developing and
developed countries, respectively. The classification of these 90 countries is attached in Appendix A. Data for the variables considered in this study was extracted from the following databases: World Values Survey (Inglehart et al., 2014), World Development Indicators and Worldwide Governance Indicators (World Bank).
The dependent variable in this longitudinal study is subjective well-being measured by the life satisfaction indicator from the four waves of the WVS2, ranging from year
1995 to year 2014. These four waves subsequently form the four time periods in the longitudinal study. Life satisfaction is measured on a scale ranging from 1 to 10 in response to the question: “All things considered, how satisfied are you with your life as a whole these days?” A score of 1 refers to being “completely dissatisfied” while a score of 10 refers to being “completely satisfied”. Therefore, the dependent variable for each country in each wave of the survey was computed by averaging the life satisfaction scores of the individual respondents in that country for that particular wave.
The explanatory variables identified in the literature and used in this study are income, income inequality, unemployment, health, religiosity, governance quality and social trust. The explanatory variables are measured as follows:
• INCOME: GDP per capita based on purchasing power parity; in constant 2011 international dollars.
• INCOME INEQUALITY: Measured on a Likert scale from 1 to 10 to reflect individuals’ views on income inequality. A score of 1 refers to individuals agreeing completely with the statement “Incomes should be made more equal”. A score of 10 refers to individuals agreeing completely with the state-ment “We need larger income differences as incentives for individual effort.”3
1 Developing countries are classified based on: low income (Gross National Income (GNI) per-capita of
$1,045 or less in 2013), lower-middle income (GNI per capita of more than $1,045 but less than $4,125) and upper-middle income (GNI per capita of more than $4,125 but less than $12,746). Developed countries belong to the high-income group (GNI per capita of $12,746 or more).
2 The four waves were in 1995-1998 (Wave 3), 1999-2004 (Wave 4), 2005-2009 (Wave 5) and 2010-2014
(Wave 6).
3 This subjective measure of income inequality has also been used in Beja (2014). While most studies
• UNEMPLOYMENT: Share of the labour force that is without work but is avail-able for and seeking employment.
• HEALTH: Proxied by life expectancy at birth4 – the number of years a newborn
infant would live if current mortality patterns remained the same throughout his/her life at the time of birth.
• RELIGIOSITY: Measured on a Likert scale from 1 to 10 in response to the WVS question “How important is God in your life?” A score of 1 refers to “Not at all important” and a score of 10 refers to “Very important”.5
• GOVERNANCE QUALITY: Following Helliwell (2003), governance is a composite index computed as the simple average of the six composite indices – (1) control of corruption, (2) government effectiveness, (3) political stability and absence of violence/terrorism, (4) rule of law, (5) regulatory quality, and (6) voice and accountability. The composite index is measured in units of a standard normal distribution, ranging from approximately -2.5 to 2.5. The definitions for each of the six component indices can be found in Kaufmann, Kraay and Zoido-Lobatón (1999).
• SOCIAL TRUST: Measured by the proportion of survey respondents who picked the answer ‘most people can be trusted’ to the WVS question “Generally speaking, would you say that most people can be trusted or that you need to be very careful in dealing with people?”6
Data for the income, unemployment and health variables were extracted from the World Development Indicators7, while data for the six composite indices used in
constructing the governance variable was obtained from the Worldwide Governance Indicators. Data for the religiosity, income inequality and social trust variables were obtained from the WVS.
3.2 Methodology
To estimate the relationship between the explanatory variables and subjective well-being, we model the average life satisfaction of countries as a linear function of the independent variables considered in this study. Given that the data set used in this study is a panel data, characterised by observations from a cross-section of countries over multiple time periods, we estimate the following unobserved effects model given by:
(1) i = 1,2,…,N, t = 1,2,…,T, where LSit is the average life satisfaction for country i in time
period t and Xit is the vector of independent variables described in Section 3.1 for
4 We follow Helliwell (2003) in using life expectancy at birth as the proxy for physical health. 5 We follow Helliwell (2003) in using “How important is God in your life?” as the proxy for religiosity. 6 This measure of social trust has been widely used in the literature (Bjørnskov, 2006; Helliwell, 2003;
Helliwell & Wang, 2011).
7 Data for income, unemployment and health were based on the years in which each of the four waves of
the WVS was conducted for the respective countries. For example, since Wave 6 of the WVS for Malaysia was conducted in 2012, the data for Malaysian income, unemployment and health was also for 2012.
country i in time period t. In this study, N = 90 for the combined sample of countries, while N1 = 55 and N2 = 35 for the sub-samples of developing and developed countries
respectively. Also, T = 4, representing the four waves from Wave 3 to Wave 6 in the WVS. The idiosyncratic error is denoted by uit. The variable hi is referred to as
the unobserved effects – unobserved random variables that differ across the cross-section units (i.e. countries) but are time invariant. The inclusion of these unobserved effects in equation (1) extends the study of Helliwell and Wang (2013) by explicitly controlling for the presence of omitted variables that are largely unobservable, allowing consistent estimators to be obtained under certain assumptions. Ignoring the presence of these unobserved variables in a panel data framework may result in estimates that are biased and inconsistent. The presence of unobserved effects was formally tested using the Breusch and Pagan (1980) Lagrangian multiplier test, and the null hypothesis of no unobserved effects in the model was rejected at 5% level of significance.
The choice of the estimator, which is either the fixed effects (FE) estimator or the random effects (RE) estimator, depends on whether there exists a correlation between the unobserved effects and the explanatory variables. The Hausman (1978) test was used to test for such a correlation, and it can be concluded that there is insufficient evidence at conventional levels of significance to reject the null hypothesis of no correlation between the unobserved effects and the explanatory variables. Hence, the RE estimator, a consistent and efficient estimator, is used to estimate the unobserved effects model in equation (1).
It can be shown that the RE estimator is a feasible generalised least squares estimator given by:
(2)
where
(3)
The matrix X in equation (2) represents the matrix of observations of explanatory variables for the sample of countries across all time periods, while y represents the vector of average life satisfaction responses of the sample of countries across all time periods. in equation (3) represents the estimated conditional variance of the unobserved effects while represents the estimated conditional variance of the idio-syncratic error term. Taken together, the form of in (3) is referred to as the random effects structure.
𝜷𝜷^𝑅𝑅𝑅𝑅= (𝑿𝑿′𝜴𝜴 ^
−1𝑿𝑿)−1𝑿𝑿′𝜴𝜴^−1𝒚𝒚
𝜴𝜴^ =
[ 𝜎𝜎^ℎ2+ 𝜎𝜎
^ 𝑢𝑢2 𝜎𝜎^ℎ2
𝜎𝜎^ℎ2 𝜎𝜎^ℎ2+ 𝜎𝜎
^ 𝑢𝑢2
⋯
⋯ 𝜎𝜎
^ ℎ2 ⋮
⋮ ⋮ ⋱ ⋮
𝜎𝜎^ℎ2 𝜎𝜎^ℎ2 ⋯ 𝜎𝜎 ^
ℎ2+ 𝜎𝜎 ^
𝑢𝑢2]
𝜎𝜎^ℎ2
𝜎𝜎^𝑢𝑢2
4. Empirical Results 4.1 Descriptive Statistics
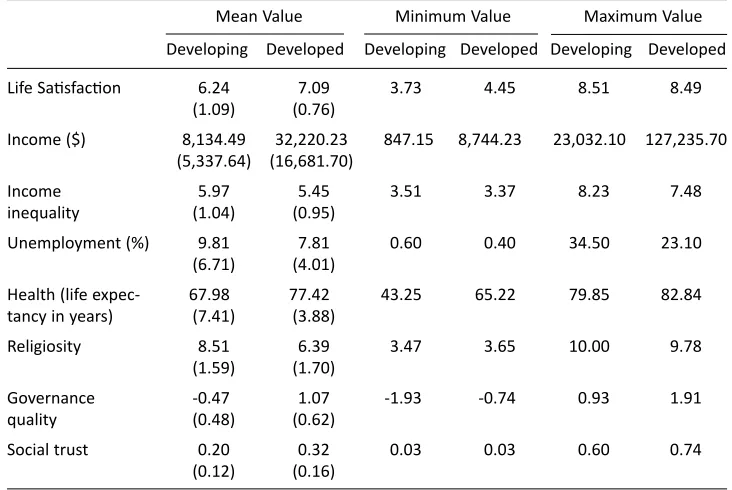
Table 1 presents the descriptive statistics for each of the variables corresponding to the respective samples of developed and developing countries. From Table 1, the average life satisfaction for the developed countries, across all four waves of the study period, is higher than that of the developing countries. However, the difference in average life satisfaction is only 0.85, considering that the average income for developed countries is approximately four times higher than that of developing countries. It is also noted that the range of life satisfaction scores for the developing countries is larger than that of the developed countries. However, for both samples of countries, the maximum average life satisfaction scores reported are approximately equal.
The average values of health (proxied by life expectancy at birth) and governance quality for the developed countries are also higher than that of developing countries, consistent with expectations. A negative average score for governance quality is noted for developing countries, reflecting a poor level of governance for these countries. The developed countries also perform better in terms of unemployment relative to developing countries. With regards to perceived income inequality, there is not much to differentiate between the developed and developing countries. It is also observed that developing countries are more religious than developed countries, with a considerably
Table 1. Descriptive statistics of variables for the sample of developing and developed countries Mean Value Minimum Value Maximum Value Developing Developed Developing Developed Developing Developed
Life Satisfaction 6.24 7.09 3.73 4.45 8.51 8.49
(1.09) (0.76)
Income ($) 8,134.49 32,220.23 847.15 8,744.23 23,032.10 127,235.70 (5,337.64) (16,681.70)
Income 5.97 5.45 3.51 3.37 8.23 7.48
inequality (1.04) (0.95)
Unemployment (%) 9.81 7.81 0.60 0.40 34.50 23.10
(6.71) (4.01)
Health (life expec- 67.98 77.42 43.25 65.22 79.85 82.84
tancy in years) (7.41) (3.88)
Religiosity 8.51 6.39 3.47 3.65 10.00 9.78
(1.59) (1.70)
Governance -0.47 1.07 -1.93 -0.74 0.93 1.91
quality (0.48) (0.62)
Social trust 0.20 0.32 0.03 0.03 0.60 0.74
(0.12) (0.16)
higher average religiosity score of 8.51, reflecting a higher importance of God in their lives. For social trust, a larger proportion of survey respondents in the developed countries agree that most people can be trusted.
Overall, the descriptive statistics reflect what one would expect of developed countries – better economic performance, better health care, stronger governmental institutions and a greater level of trust, each of which may contribute to a subsequent higher level of subjective well-being.
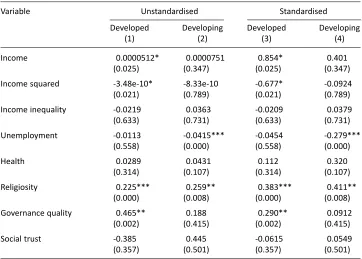
4.2 Regression Results
Table 2 reports the random effects estimation results for the unobserved effects model in equation (1), with columns (1) and (2) reporting the unstandardised estimated coefficients, and columns (3) and (4) reporting the standardised coefficients, for the sample of developed and developing countries. An additional variable, income squared, has been included in the regression model to capture any potential non-linear effects of income on subjective well-being. The reported signs of the coefficients for all the variables, except for income inequality and social trust, are the same for both developed and developing countries.
The empirical results show that only unemployment and religiosity are found to be significant determinants of average life satisfaction for developing countries. For developed countries, income, income squared, religiosity and governance quality are significant factors influencing the average life satisfaction. Health, income inequality and social trust have no significant effect on the level of subjective well-being in either developed or developing countries.
GDP per capita is statistically significant at the 5% level of significance in deter-mining the average life satisfaction for developed countries, with an increase in income over time raising the average life satisfaction. However, the negative coefficient and statistical significance of the quadratic income variable implies that this increase in subjective well-being with income over time is only up to a certain income threshold level. Based on the estimated coefficients in column (1), this threshold level can be inferred to be $73,563 for developed countries. This observation is consistent with Frey and Stutzer (2002) who found diminishing marginal utility from increased income levels for developed countries.
Income is not a significant variable in explaining the average life satisfaction in developing countries. Whilst this result is counter-intuitive, Diener and Seligman (2004) noted that it is possible for income variables to become statistically insignificant once other variables are statistically controlled for. Therefore, based on the results in column (2) for developing countries, once unemployment and religiosity have been statistically controlled for, income plays an insignificant role in explaining average life satisfaction.
Unemployment is a significant factor at the 0.1% level of significance in explaining the differences in average life satisfaction across developing countries over time, but not for developed countries. In particular, an increase in unemployment rate by 1 percentage point over time will reduce the average life satisfaction of a developing country by 0.0415 points on the life satisfaction scale on average, ceteris paribus. As postulated by Frey and Stutzer (2002), the reduced levels of subjective well-being from unemployment could be due to psychic and social costs, and the general worry of being laid off by employers during periods of high unemployment.
It is interesting to note that for developed countries, income is a significant factor in explaining average life satisfaction, but not unemployment, while the reverse is true for developing countries. A plausible explanation could be that if unemployment rates were to increase in a developed country, the average level of subjective well-being will not be impacted much as citizens are able to fall back on established social security systems that will look after their welfare (Dethier, 2007). Moreover, shocks in the unemployment rates of developed countries may only be temporal in nature (Román & Brat, 2014). On the other hand, high unemployment rates in developing countries may be prolonged, and social security systems may also not exist in these countries. Therefore, employ-ment could be a buffer against economic shocks and subsequently provide a sense of security that boosts the level of well-being for people in developing countries.
Table 2. Estimated unstandardised and standardised beta coefficients of equation (1) for the sample of developed and developing countries
Variable Unstandardised Standardised
Developed Developing Developed Developing
(1) (2) (3) (4)
Income 0.0000512* 0.0000751 0.854* 0.401
(0.025) (0.347) (0.025) (0.347)
Income squared -3.48e-10* -8.33e-10 -0.677* -0.0924
(0.021) (0.789) (0.021) (0.789)
Income inequality -0.0219 0.0363 -0.0209 0.0379
(0.633) (0.731) (0.633) (0.731)
Unemployment -0.0113 -0.0415*** -0.0454 -0.279***
(0.558) (0.000) (0.558) (0.000)
Health 0.0289 0.0431 0.112 0.320
(0.314) (0.107) (0.314) (0.107)
Religiosity 0.225*** 0.259** 0.383*** 0.411**
(0.000) (0.008) (0.000) (0.008)
Governance quality 0.465** 0.188 0.290** 0.0912
(0.002) (0.415) (0.002) (0.415)
Social trust -0.385 0.445 -0.0615 0.0549
(0.357) (0.501) (0.357) (0.501)
Religiosity is both practically and statistically significant in determining average life satisfaction in both developed and developing countries, whereby the coefficients are statistically significant at 0.1% and 1% level of significance respectively. For developed countries, the national average life satisfaction would increase, on average, by 0.225 points on the 10-point scale when the perception of the importance of God increases by 1 unit on the 10-point scale over time, ceteris paribus. The corresponding increase in the national average life satisfaction for developing countries is marginally higher at 0.259. Therefore, religiosity impacts the level of well-being in developing countries more than developed countries. Nevertheless, this marginal difference between the two sample groups of countries may be surprising given the increasing secularism amongst developed countries due to the rise in the chase for material goods (Sachs, 2013). Therefore, one would have expected religiosity to not have an important role in determining subjective well-being for developed countries.
Governance quality is not a significant variable in determining the well-being of developing countries, but is very significant for that of developed countries. It is expected that an increase in governance quality by 1 unit on its scale over time will raise the developed countries’ average life satisfaction by 0.465 points on the 10-point scale,
ceteris paribus. This result confronts the findings of Helliwell and Huang (2008) who found that governmental quality has a stronger impact on well-being for poorer nations. The reported unstandardised beta coefficients in Columns 1 and 2 of Table 2 are not able to identify the relative importance of each statistically significant determinant. Therefore, Table 2 also presents the corresponding standardised beta coefficients to determine the relative importance of the determinants of well-being for both developed and developing countries in order to inform policy formulation. The standardised beta coefficients are interpreted as the change in the average life satisfaction score from a one standard deviation increase in the explanatory variable over time, ceteris paribus. Therefore, an explanatory variable with a larger beta coefficient can be interpreted as having a larger effect, and hence importance, on subjective well-being.
The magnitude of the coefficients in Table 2 show that the determinants of life satisfaction for developed countries, in order of importance, are: (i) income, (ii) religiosity and (iii) governance quality. For developing nations, the determinants of life satisfaction, in order of importance, are: (i) religiosity and (ii) unemployment. These findings will provide insights into the prioritisation of determinants for countries at different stages of development.
5. Policy Implications
These empirical results have important implications for policy makers in the respec -tive groups of countries. It is especially important for developing countries where they have limited resources and hence encounter higher opportunity costs in implementing all the policies. Therefore, careful understanding of the relationships between the key factors of well-being and a country’s stage of development will enable the country to prioritise resources according to the importance of the factors. In this context, Easterlin (2013) and Deaton (2008) suggested that for governments to be effective, it is essential that they provide an enabling environment that delivers better public services such as health and education and also to ensure a stronger social safety net which can enhance the well-being of society. This ensures that policy makers take into consideration the factors of well-being that society value and introduce initiatives and specific policies that addresses these concerns. These key factors are discussed below.
Religiosity still remains as an important factor in determining the levels of subjective well-being for both developed and developing countries. However, policy makers are confronted with difficulties in developing and implementing policies to promote religiosity amongst its people, as religion has often been a source of conflict that gives rise to animosity and war (Reychler, 1997). The promotion of religiosity can also be easily misinterpreted as one that promotes a particular religion, causing other religions to be discriminated against.
However, as pointed out by Sachs (2013), all major religions share basic ethical principles. Therefore, the starting point for policy makers is not to promote religion, but rather to promote these shared ethical principles – principles that support the universal value of treating others as we want them to treat us. As such, at the national levels, policy makers could consider a renewed push towards either introducing or strengthening religious and moral education as part of the educational reforms. Religiosity could be promoted by establishing initiatives such as creating awareness by inviting spiritual leaders and teachers to give talks and discourses on religion in institutions of learning and also in organisations. Further, establishing an inclusive consultative committee with prominent non-political leaders and experts in various fields may help resolve conflicts in any religion and find solutions to these problems. This rational consultative public discussion may alleviate misunderstandings within and between religions in a community.
On a worldwide level, movements could target for a revival of virtue ethics. For example, Sachs (2013) cited Action for Happiness as one of the movements who asks its members to live in a way that “produces as much happiness and as little misery as they can” (p. 93). Another example of a worldwide organisation that can aid in promoting religiosity is the Council for a Parliament of the World’s Religions.8 It began in 1893 and
has since held the Parliament of the World’s Religions in various locations around the world. Its mission is to “cultivate harmony among the world’s religious and spiritual communities and foster their engagement with the world and its guiding institutions in order to achieve a just, peaceful and sustainable world.” It seeks to promote harmony between religions, and not unity, as the latter will risk the erosion of the
unique characteristics of each individual religion or spiritual tradition. Interestingly, the Council also recognises that “the well-being of the Earth and all life depends on (the) collaboration (among the world’s religious and spiritual communities).”
Income has remained as the most significant determinant of subjective well-being for the sample of developed countries involved in this empirical analysis. Whilst promoting per capita GDP remains important, maintaining economic stability and sustainability is of paramount importance. During the Global Economic Crisis (also known as the Global Financial Crisis), market incomes fell considerably (OECD, 2013), causing a negative impact on well-being (Hannon, 2013). This outcome can be explained by the loss-aversion theory (Kahneman, Diener, & Schwarz, 1999), whereby the being loss resulting from a fall in income is disproportionately higher than the well-being gain from an equal rise in income. Hence, it is important for policies to aim at stabilising economic growth to ensure stable incomes, and also at taking precautions in buffering against economic recessions.
Moreover, in developed countries, government initiatives such as social security programs may lead to better life satisfaction among people as these programs provide financial access to people, especially among the lower strata of society and helps to reduce stress and pressure to seek employment. For example, in Denmark, government benefits of this nature is accepted and are not perceived as a social stigma. This also bridges the income gap between the ‘have’ and ‘have not’s and may lead to a less polarised society.
Given that governance quality also has significant influence on subjective well-being for developed countries, considerable efforts should be directed towards improving governance quality. As such, reforms aimed at further strengthening the institutional and political environment can be devised, such that developed countries continue to be governed with accountability, honesty, stability and integrity. For example, a mechanism can be developed for grievance redress where people are able to provide evaluative feedback to policy makers on public services by expressing their concerns and preferences. This allows the government to understand the experiences and problems that people face when interacting with government services through inclusive participatory policies and ensure accountability in the delivery of public services. This will subsequently help to enhance the government services, eventually leading to better well-being of its people. In collaboration with the feedback system, governments should also establish a government networking system to foster stronger relationship between people and institutions to work together to solve problems. In this way, governing institutions can apply the concept of dynamic capabilities, specifically the absorptive capabilities, to acquire and assimilate from the valuable external knowledge generated from the people and through leveraging on the feedback of people, using adaptive capability to improve the delivery of public programs.
to achieve as politicians in many countries would not be keen to execute the process since it may restrain their power and subsequently hinder them from pursuing their personal interests.
The findings from the empirical analysis showed that for developing countries, policies aimed at growing the economy is not as important as combatting unemployment issues. Therefore, for developing countries, policy makers should focus on job creation to bring down unemployment, and not on policies that boost national income per se. This is because the benefits from policies aimed at boosting GDP per capita may not be felt by the masses. For example, developing countries may expand their economy through increased exports of commodities (e.g. oil in Nigeria), but with the earnings only benefitting the elite few (Iwuji, 2014). Through the provision of employment, people are able to gain security in income earnings. Moreover, permanent employment, even if it means having a job that is not fully satisfactory, is still better than no job at all (Grün, Hauser, & Rhein, 2010). However, identifying the right strategies and initiatives that a government needs to introduce to reduce the scale of unemployment is dependent on identifying the underlying causes of unemployment that the country is facing.
An approach that can be adopted to alleviate unemployment, which may be more of structural unemployment in developing countries, is for the government to provide training services to enhance labour skills and job matching services to hasten the job search process or to take up new jobs. Further, incentives in the form of subsidies and grants can also be given to encourage firms to relocate to areas of high employment, and also to spend on training initiatives to empower individuals with new skills or to re-skill the unemployed to make them employable.
6. Conclusion
Although GDP has been a dominant indicator that has guided governments in develop-ing policies directed at growth over the past decades, there has been a growdevelop-ing call to develop new measures of welfare that look beyond GDP (Van den Bergh, 2009; Bleys, 2012; Fleurbaey, 2009). An outcome of this has been the growing emphasis on looking at measures of subjective well-being.
Given the increased studies on the subject matter of subjective well-being, this study has contributed to the literature by determining the key macro factors influencing life satisfaction in developed and developing countries using panel data techniques. In particular, the findings of this study reported different determinants in explaining average life satisfaction for developed and developing countries, with religiosity being the only common determinant across the two groups of countries. The determinants of average life satisfaction for developed countries, in order of importance are income, religiosity and governance quality, while the corresponding determinants for developing countries are religiosity and unemployment. This study has also discussed potential policy implications arising from the findings, helping to bring subjective well-being to the forefront of policy.
While there are concerns with regards to generalisability, the application of panel data analysis is still considered a more robust technique compared to cross-sectional and time series methods of analysis.
References
Alesina, A., Di Tella, R., & MacCulloch, R. (2004). Inequality and happiness: Are Europeans and Americans different? Journal of Public Economics, 88(9-10), 2009-2042. https://doi. org/10.1016/j.jpubeco.2003.07.006
Altman, D., Flavin, P., & Radcliff, B. (2017). Democratic institutions and subjective well-being.
Political Studies, 65(3), 685-704. https://doi.org/10.1177/0032321716683203
Becchetti, L., & Rossetti, F. (2009). When money does not buy happiness: The case of “frustrated achievers”. The Journal of Socio-Economics, 38(1), 159-167. https://doi.org/10.1016/j.socec. 2008.08.009
Beja, E.L. (2014). Subjective well-being analysis of income inequality: Evidence for the indus-trialized and emerging economies. Applied Research in Quality of Life, 9(2), 139-156. https:// doi.org/10.1007/s11482-013-9243-9
Bjørnskov, C. (2003). The happy few: Cross-country evidence on social capital and life satisfaction. Kyklos, 56(1), 3-16. https://doi.org/10.1111/1467-6435.00207
Bjørnskov, C. (2006). The multiple facets of social capital. European Journal of Political Economy,
22(1), 22-40. https://doi.org/10.1016/j.ejpoleco.2005.05.006
Bjørnskov, C., Dreher, A., & Fischer, J.A.V. (2008). Cross-country determinants of life satisfaction: Exploring different determinants across groups in society. Social Choice and Welfare, 30(1), 119-173. https://doi.org/10.1007/s00355-007-0225-4
Blanchflower, D.G., & Oswald, A.J. (2004). Well-being over time in Britain and the USA. Journal of Public Economics, 88(7-8), 1359-1386. https://doi.org/10.1016/S0047-2727(02)00168-8 Bleys, B. (2012). Beyond GDP: Classifying alternative measures for progress. Social Indicators
Research, 109(3), 355-376. https://doi.org/10.1007/s11205-011-9906-6
Breusch, T.S., & Pagan, A.R. (1980). The Lagrange multiplier test and its applications to model specification in econometrics. The Review of Economic Studies, 47(1), 239-253. https://doi. org/10.2307/2297111
Clark, A.E. (2003a). Unemployment as a social norm: Psychological evidence from panel data. Journal of Labor Economics, 21(2), 323-351. https://doi.org/10.1086/345560
Clark, A.E. (2003b). Inequality-aversion and income mobility: A direct test (Delta Working Paper No. 2003-11). Paris, France: DELTA. Retrieved from http://citeseerx.ist.psu.edu/viewdoc/ download?doi=10.1.1.202.9008&rep=rep1&type=pdf
Clark, A.E., & Lelkes, O. (2003). Keep the faith: Is social capital just an instrument? Unpublished manuscript. Paris, France: De ́partment et Laboratoire d’Économic Théoretique et Applique ́e. Clark, A.E., & Lelkes, O. (2005). Deliver us from evil: Religion as insurance (Working Paper No.
2005-43). Paris, France: Paris-Jourdan Sciences Economiques.
Clark, A.E., & Oswald, A.J. (1994). Unhappiness and unemployment. The Economic Journal, 104(424), 648-659. https://doi.org/10.2307/2234639
Clark, A.E., Frijters, P., & Shields, M.A. (2008). Relative income, happiness, and utility: An explanation for the Easterlin Paradox and other puzzles. Journal of Economic Literature,
46(1), 95-144. https://doi.org/10.1257/jel.46.1.95
Clark, A., Etilé, F., Postel-Vinay, F., Senik, C., & Van der Straeten, K. (2005). Heterogeneity in reported well-being: Evidence from twelve European countries. The Economic Journal,
115(502), C118-C132. https://doi.org/10.1111/j.0013-0133.2005.00983.x
Coleman, J.S. (1988). Social capital in the creation of human capital. American Journal of Sociology, 94(Supplement), S95-S120.
Coleman, J.S. (1990). Foundations of social theory. Cambridge, MA: Harvard University Press. Conceição, P., & Bandura, R. (2008). Measuring subjective well-being: A summary review of
the literature. New York, NY: Office of Development Studies, United Nations Development Programme.
Deaton, A. (2008). Income, health, and well-being around the world: Evidence from the Gallup World Poll. Journal of Economic Perspectives, 22(2), 53-72. https://doi.org/10.1257/jep. 22.2.53
Delhey, J. (2010). From materialist to post-materialist happiness? National affluence and deter-minants of life satisfaction in cross-national perspective. Social Indicators Research, 97(1), 65-84. https://doi.org/10.1007/s11205-009-9558-y
Dethier, J-J. (2007). Social security: What can developing countries learn from developed countries? (2020 Focus Brief on the World’s Poor and Hungry People), Washington, DC: International Food Policy Research Institute.
Di Tella, R., & MacCulloch, R. (2006). Some uses of happiness data in economics. Journal of
Economic Perspectives, 20(1), 25-46. https://doi.org/10.1257/089533006776526111
Di Tella, R., MacCulloch, R.J., & Oswald, A.J. (2001). Preferences over inflation and unemploy-ment: Evidence from surveys of happiness. American Economic Review, 91(1), 335-341. https://doi.org/10.1257/aer.91.1.335
Diener, E., & Seligman, M.E.P. (2004). Beyond money: Toward an economy of well-being.
Psychological Science in the Public Interest, 5(1), 1-31. https://doi.org/10.1111/j.0963-7214.2004.00501001.x
Easterlin, R.A. (1974). Does economic growth improve the human lot? Some empirical evidence. In P.A. David & M.W. Reder (Eds.), Nations and households in economic growth: Essays in
honor of Moses Abramovitz (pp. 89-125). Cambridge, MA: Academic Press. https://doi. org/10.1016/B978-0-12-205050-3.50008-7
Easterlin, R.A. (2003). Explaining happiness. Proceedings of the National Academy of Sciences of
the United States of America, 100(19), 11176-11183.
Easterlin, R.A. (2004). The economics of happiness. Daedalus, 133(2), 26-33.
Easterlin, R.A. (2013). Happiness, growth, and public policy. Economic Inquiry, 51(1), 1-15. https:// doi.org/10.1111/j.1465-7295.2012.00505.x
Easterlin, R.A., Angelescu McVey, L., Switek, M., Sawangfa, O., & Zweig, J.S. (2010). The happiness–income paradox revisited. Proceedings of the National Academy of Sciences of the
United States of America, 107(52), 22463-22468. https://doi.org/10.1073/pnas.1015962107 Fleurbaey, M. (2009). Beyond GDP: The quest for a measure of social welfare. Journal of Economic
Literature, 47(4), 1029-1075. https://doi.org/10.1257/jel.47.4.1029
Frey, B.S., & Stutzer, A. (2000). Happiness, economy and institutions. The Economic Journal, 110(466), 918-938. https://doi.org/10.1111/1468-0297.00570
Frey, B.S., & Stutzer, A. (2002). Happiness and economics: How the economy and institutions affect
human well-being. Princeton, NJ: Princeton University Press.
Frey, B., Stutzer, A., Benz, M., Meier, S., Luechinger, S., & Benesch, C. (2008). Happiness: A
revolution in economics. Cambridge, MA: MIT Press.
Goldsmith, A.H., Veum, J.R., & Darity, W. (1996). The psychological impact of unemployment and joblessness. The Journal of Socio-Economics, 25(3), 333-358. https://doi.org/10.1016/S1053-5357(96)90009-8
Graham, C. (2009). Happiness around the world: The paradox of happy peasants and miserable millionaires. Oxford, England: Oxford University Press.
Grün, C., Hauser, W., & Rhein, T. (2010). Is any job better than no job? Life satisfaction and re-employment. Journal of Labor Research, 31(3), 285-306. https://doi.org/10.1007/s12122-010-9093-2
Haller, M., & Hadler, M. (2006). How social relations and structures can produce happiness and unhappiness: An international comparative analysis. Social Indicators Research, 75(2), 169-216. https://doi.org/10.1007/s11205-004-6297-y
Hannon, P. (2013, November 5). OECD: Well-being in Euro zone has suffered since crisis. The Wall Street Journal. Retrieved from http://online.wsj.com/articles/SB100014240527023 0393690457917906110 9932756
Hausman, J.A. (1978). Specification tests in econometrics. Econometrica, 46(6), 1251-1271. https://doi.org/10.2307/1913827
Hayo, B. (2004). Happiness in Eastern Europe (Marburg Economic Working Paper No. 12). Marburg, Germany: School of Business and Economics, University of Marburg. https://doi. org/10.2139/ssrn.601201
Helliwell, J.F. (2003). How’s life? Combining individual and national variables to explain subjective well-being. Economic Modelling, 20(2), 331-360. https://doi.org/10.1016/S0264-9993(02)00057-3
Helliwell, J.F. (2006). Well-being, social capital and public policy: What’s new? The Economic
Journal, 116(510), C34-C45. https://doi.org/10.1111/j.1468-0297.2006.01074.x
Helliwell, J.F., & Huang, H. (2008). How’s your government? International evidence linking good government and well-being. British Journal of Political Science, 38(4), 595-619. https://doi. org/10.1017/S0007123408000306
Helliwell, J.F., & Wang, S. (2011). Trust and wellbeing. International Journal of Wellbeing, 1(1), 42-78. Helliwell, J.F., & Wang, S. (2013). World happiness: Trends, explanations and distributions. In J.F. Helliwell, R. Layard, & J.D. Sachs (Eds.), World happiness report 2013 (pp. 8-37). New York, NY: UN Sustainable Development Solutions Network. Retrieved from https://s3.amazonaws. com/happiness-report/2013/WorldHappinessReport2013_online.pdf
Hsiao, C., Mountain, C., & Illman, K.H. (1995). A Bayesian integration of end-use metering and conditional-demand analysis. Journal of Business & Economic Statistics, 13(3), 315-326. https://doi.org/10.2307/1392191
Hudson, J. (2006). Institutional trust and subjective well-being across the EU. Kyklos, 59(1), 43-62. https://doi.org/10.1111/j.1467-6435.2006.00319.x
Inglehart, R. (2000). Globalization and postmodern values. The Washington Quarterly, 23(1), 215-228. https://doi.org/10.1162/016366000560665
Inglehart, R. (2006). Democracy and happiness: What causes what? Paper presented at the Con-ference on Human Happiness, Notre Dame University, Notre Dame, Indiana. Retrieved from https://www3.nd.edu/~adutt/activities/documents/InglehartHappinessandDemocracy1.pdf Inglehart, R., Haerpfer, C., Moreno, A., Welzel, C., Kizilova, K., Diez-Medrano, J., … Puranen, B. et al.
(2014). World values survey: All rounds – country-pooled datafile version. Madrid: JD Systems Institute. Retrieved from http://www.worldvaluessurvey.org/WVSDocumentation WVL.jsp. Iwuji, P.C. (2014, April 25). GDP growth and the façade of economic development. Nigeria World.
Retrieved from http://nigeriaworld.com/articles/2014/apr/251.html
Kahneman, D., Diener, E. & Schwarz, N. (Eds.) (1999). Well-being: The foundations of hedonic
psychology. New York, NY: Russell Sage Foundation.
Kaufmann, D., Kraay, A., & Zoido-Lobatón, P. (1999). Governance matters (World Bank Policy Research Working Paper 2196). Washington, DC: World Bank. Retrieved from http:// documents.worldbank.org/curated/en/665731468739470954/pdf/multi-page.pdf
Layard, R. (2005). Happiness: Lessons from a new science. New York, NY: Penguin Books.
Lelkes, O. (2006). Tasting freedom: Happiness, religion and economic transition. Journal of
Li, Y., Pickles, A., & Savage, M. (2005). Social capital and social trust in Britain. European Socio-logical Review, 21(2), 109-123. https://doi.org/10.1093/esr/jci007
Lucas, J.W. (2003). Theory-testing, generalization, and the problem of external validity. Socio-logical Theory, 21(3), 236-253. https://doi.org/10.1111/1467-9558.00187
Ngamaba, K.H., Panagioti, M., & Armitage, C.J. (2018). Income inequality and subjective well-being: A systematic review and meta-analysis. Quality of Life Research, 27(3), 577-596. https://doi.org/10.1007/s11136-017-1719-x
OECD. (2013). Crisis squeezes income and puts pressure on inequality and poverty (Results from the OECD Income Distribution Database). Paris: Author. Retrieved from http://www.oecd. org/els/soc/OECD2013-Inequality-and-Poverty-8p.pdf
Ohtake, F. (2012). Unemployment and happiness. Japan Labor Review, 9(2), 59-74.
Oshio, T., & Kobayashi, M. (2011). Area-level income inequality and individual happiness: Evidence from Japan. Journal of Happiness Studies, 12(4), 633-649. https://doi.org/10.1007/ s10902-010-9220-z
Oswald, A.J., & Powdthavee, N. (2008). Does happiness adapt? A longitudinal study of disability with implications for economists and judges. Journal of Public Economics, 92(5-6), 1061-1077. https://doi.org/10.1016/j.jpubeco.2008.01.002
Owen, A.L., Videras, J., & Willemsen, C. (2008). Democracy, participation, and life satisfaction. Social Science Quarterly, 89(4), 987-1005. https://doi.org/10.1111/j.1540-6237.2008.00595.x Perovic, L.M., & Golem, S. (2010). Investigating macroeconomic determinants of happiness in
transition countries: How important is government expenditure? Eastern European Eco-nomics, 48(4), 59-75. https://doi.org/10.2753/EEE0012-8775480403
Popova, O. (2014). Can religion insure against aggregate shocks to happiness? The case of transition countries. Journal of Comparative Economics, 42(3), 804-818. https://doi.org/ 10.1016/j.jce.2014.05.003
Rehdanz, K., & Maddison, D. (2005). Climate and happiness. Ecological Economics, 52(1), 111-125. https://doi.org/10.1016/j.ecolecon.2004.06.015
Reychler, L. (1997). Religion and conflict. The International Journal of Peace Studies, 2(1). Retrieved from http://www.gmu.edu/programs/icar/ijps/vol2_1/Reyschler.htm
Román, D., & Brat, I. (2014, July 24). Spain unemployment rate drops as job creation gathers pace. The Wall Street Journal. Retrieved from https://online.wsj.com/articles/spain-unemployment-rate-drops-as-job-creation-gathers-pace-1406191306
Sachs, J.D. (2013). Restoring virtue ethics in the quest for happiness. In J.F. Helliwell, R. Layard, & J.D. Sachs (Eds.), World happiness report 2013 (pp. 80-97). New York, NY: UN Sustainable Development Solutions Network. Retrieved from https://s3.amazonaws.com/happiness-report/2013/WorldHappinessReport2013_online.pdf
Schwarze, J., & Härpfer, M. (2007). Are people inequality averse, and do they prefer redistribution by the state? The Journal of Socio-Economics, 36(2), 233-249. https://doi.org/10.1016/j. socec.2005.11.047
Senik, C. (2002). When information dominates comparison: Learning from Russian subjective
panel data (William Davidson Institute Working Paper No. 495). Ann Arbor, MI: William Davidson Institute. https://doi.org/10.2139/ssrn.328180
Van den Bergh, J.C.J.M. (2009). The GDP paradox. Journal of Economic Psychology, 30(2), 117-135. https://doi.org/10.1016/j.joep.2008.12.001
Vittersø, J., Biswas-Diener, R., & Diener, E. (2005). The divergent meanings of life satisfaction: Item response modeling of the satisfaction with life scale in Greenland and Norway. Social Indicators Research, 74(2), 327-348. https://doi.org/10.1007/s11205-004-4644-7
Appendix A
Table of developed and developing countries
Developed Countries
Australia Canada Chile Croatia Cyprus
Estonia Finland France Germany Hong Kong
Israel Italy Japan Latvia Lithuania
Netherlands New Zealand Norway Poland Puerto Rico
Qatar Korea, Republic Russian Federation Saudi Arabia Singapore
Slovak Republic Slovenia Spain Sweden Switzerland
Taiwan, Republic of China Trinidad and Tobago United Kingdom United States Uruguay
Developing Countries
Albania Algeria Argentina Armenia Azerbaijan
Bangladesh Belarus Bosnia and Herzegovina Brazil Bulgaria Burkina Faso People’s Republic of Colombia Dominican Ecuador
China Republic
Egypt El Salvador Ethiopia Georgia Ghana
Guatemala Hungary India Indonesia Iran, Islamic
Republic
Iraq Jordan Kazakhstan Kyrgyz Republic Lebanon
Libya Macedonia Malaysia Mali Mexico
Moldova Morocco Nigeria Pakistan Peru
Philippines Romania Rwanda South Africa Tanzania
Thailand Turkey Uganda Ukraine Uzbekistan