ISSN 0015–5659 www.fm.viamedica.pl
Using three-dimensional digital models
to establish alveolar morphotype
M. Konvalinkova
1, 2, W. Urbanova
1, K. Langova
3, M. Kotova
1, 21Department of Orthodontics and Cleft Defects, Third Faculty of Medicine Charles University and University Hospital Kralovske Vinohrady, Prague, Czech Republic
2Department of Orthodontics, Faculty of Medicine and Dentistry, Palacky University, Olomouc, Czech Republic 3Department of Medical Biophysics, Faculty of Medicine and Dentistry, Palacky University, Olomouc, Czech Republic
[Received: 13 December 2017; Accepted: 29 January 2018]
Background: The aim of the study was to propose a classification of alveolar morphotype and assess a relationship between extraction/non-extraction ortho-dontic treatment and changes to the alveolar process.
Materials and methods: Seventy-five subjects (mean age = 23.2, SD = 5.1) were selected. Areas of the sections of the alveolar process (ASAP) at three different levels (0, 2, and 4 mm) were measured on pre- and post-treatment three-dimen -sional digital models. Method reliability was analysed using Dahlberg’s formula, intraclass correlation coefficient, and paired t-tests.
Results: The mean ASAP was smallest at level 0 and largest at level 4. Pre-treatment ASAP < 773 mm2, < 863.9 mm2, and < 881.1 mm2 at levels 0, 2, and 4 mm, respectively, should be described as a “thin” alveolar morphotype. Regression models showed that pre-treatment ASAP was a predictor of the change of the alveolus during treatment only at level 2.
Conclusions: Patients for whom pre-treatment ASAP is < 773 mm2, < 863.9 mm2, and < 881.1 mm2 at levels 0, 2, and 4 mm, respectively, should be described as having a “thin” alveolar morphotype. In these patients, extraction treatment, associated with a decrease in the alveolus area, should be exercised with caution.
(Folia Morphol 2018; 77, 3: 536–542)
Key words: alveolar process, digital model, scanning
IntrodUctIon
Initial orthodontic/orthognathic documentation includes intraoral and extraoral photographs, radio-graphic images, and plaster models of the denti-tion. Until recently, the documentation was mainly “analog.” Proper storage and retrieval of information from the documentation in such a format is economi-cally and spatially challenging. Digital technology is currently becoming an integral part of orthodontic/ /orthognathic diagnosis and treatment. The pho-tographs and radiographs are often used in digital form, and plaster models are being quickly replaced
by digital ones. In addition, three-dimensional (3D) radiography is indispensable in many patients. The digital revolution in orthodontics opens up new possibilities, particularly during treatment planning and quality control. For example, preparation of a diagnostic set-up, often a deciding factor during treatment plan selection, is quick and relatively easy when virtual models of dentition are used. The value of digital 3D documentation in neuro/craniofacial problems has been widely accepted [7, 10, 11, 23]. Another advantage of digital documentation is the
facilitation of scientific research [6, 13, 14].
Address for correspondence: Dr. M. Konvalinkova, Department of Orthodontics and Cleft Defects, Third Faculty of Medicine Charles University and
A recent population-based “Study of Health in Pomerania” [16] demonstrated that craniofacial
morphology, specifically the cranial width and facial
index, was a risk factor for periodontal problems — gingival recession (GR) and clinical attachment loss (CAL). An 11-year follow-up of the sample comprising 556 healthy subjects from Pomerania, Germany, at
a mean age of about 56 years at final observation,
showed that the higher the facial index (i.e. ratio of facial height to facial width), the more pronounced were GR and CAL. In other words, subjects with the long narrow faces had about 0.3 mm more GR and 0.5 mm more CAL compared to subjects with broad square faces.
The facial type is associated with morphology of the alveolus — subjects with long faces have a slender alveolus and thinner cortical bone compared to those with short faces who have a thick alveolar process with a dense cortical bone. Differences also concern facial growth — in a short facial type the
maxilla grows more horizontally, whereas in a long facial type — vertical growth prevails over horizontal
[1, 15, 18].
The shape of the alveolus influences the range of
possible teeth movements during orthodontic treat-ment because the cortical bone in the alveolar pro-cess creates a boundary beyond which teeth should not be moved. If the roots are forced outside of the cortical bone, bone dehiscence can develop [2]. The dehiscence can, in turn, lead directly to GR, especially
when accompanied by the inflammatory process [21].
Measurement of the shape of the alveolus prior to treatment could help prevent the development of GR. Theoretically, tooth movement in subjects with a “thin” alveolar process should be less in comparison to those with a thick alveolus. Digital models made before treatment seem suitable for assessing alveolar morphology — they are relatively easy to obtain and, in contrast to radiographs, do not involve the patient being exposed to ionising radiation. Surface and volu-metric analysis of models is also possible with numer-ous software packages. However, no clear description of what should be regarded as “thin” and “thick” alveoli, based on digital model measurements, exists in the current literature. Furthermore, it is important to establish how extraction in orthodontic treatment affects the morphology of the alveolus in compari-son to non-extraction. Therefore, this study aims to:
(a) propose a classification for the morphology of
the alveolar process (alveolar morphotype), and (b)
to assess the relationship between orthodontic treat-ment alternatives (extraction vs. non-extraction) and changes in the alveolus during treatment.
MaterIals and Methods
The patient archives at the Department of Ortho-dontics and Cleft Anomalies, 3rd Medical Faculty,
Charles University, University Hospital “Královské
Vi-nohrady”, Prague, Czech Republic, were searched to identify subjects fulfilling the following inclusion
criteria:
1. No systemic disease or congenital malformations; 2. Angle Class II malocclusion with normal (Class I)
skeletal morphology before orthodontic treatment; 3. Flat (< 1.5 mm deep) curve of Spee;
4. Permanent dentition in fully established occlusion; 5. No periodontal problems;
6. Orthodontic treatment with fixed appliances car
-ried out after pubertal growth spurt;
7. Undamaged, good quality plaster models made before and after orthodontic treatment.
Seventy-five subjects (20 males, 55 females) were
selected with a mean age of 23.2 (SD = 5.1, ranging
from 17.6 to 40.2) before orthodontic treatment
(T1). Non-extraction treatment was performed in 39 subjects (15 subjects had protrusion of maxillary central incisors, i.e. were diagnosed with Angle Class II
Division 1 malocclusion, and 24 subjects showed
retrusion of maxillary central incisors, i.e. were diag-nosed with Angle Class II Division 2 malocclusion).
Extraction treatment (removal of maxillary first pre
-molars) was carried out on 36 subjects (20 subjects had protrusion of maxillary central incisors, i.e. were diagnosed with Angle Class II Division 1 malocclusion; 16 subjects had retrusion of maxillary central incisors, i.e. were diagnosed with Angle Class II Division 2 malocclusion). Orthodontic treatment lasted for
1.7 ± 0.3 years (ranging from 1.1 to 2.4). Post-treat
-ment (T2) docu-mentation was carried out at a mean
age of 24.9 ± 5.0 (ranging from 19.1 to 41.4). One hundred and fifty plaster models (75 made
at T1 and 75 at T2) were scanned with a D700 table top surface scanner (3Shape, Copenhagen, Denmark). The digital images were saved in open data format (*STL) and analysed using the 3Shape Ortho Analyser programme (3Shape, Copenhagen, Denmark).
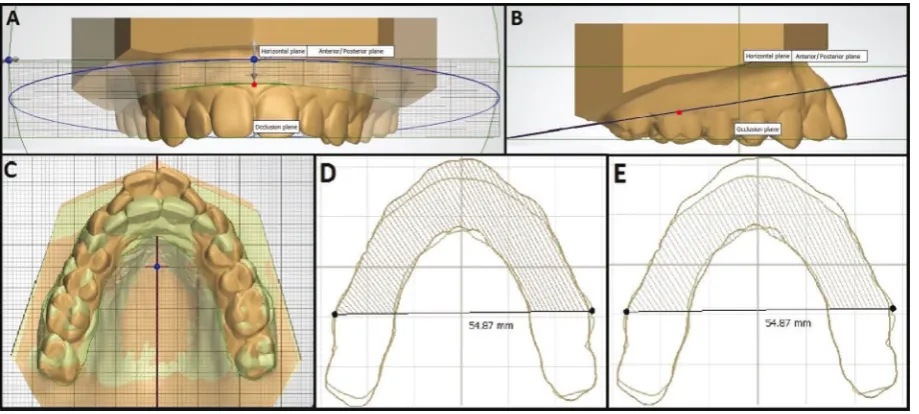
The sagittal and occlusal planes were identified
pre-treatment (T1) reference level for horizontal slices was
a plane determined by a point in the middle of the line connecting the deepest points on the cementoe-namel junction of the central incisors (Fig. 1A), and the deepest points on the cementoenamel junction of
the first molars bilaterally (Fig. 1B) (hereafter referred
to as tooth cervical level 0) [12]. The two additional virtual slices were made parallel to this plane but at
a distance of 2 mm (cervical level 2) and 4 mm (cervi
-cal level 4) api-cally from cervi-cal level 0.
Scans of the models made before and after treat-ment were superimposed (Fig. 1C) with the help of individually determined orientation points. Rugae palatinae and palate relief were used as superimpo-sition sites as they had been previously shown to be
suitable for this purpose [3]. The areas defined by
lines contouring the vestibular and palatal sides of
the horizontal slices through the alveolar process at levels 0, 2, and 4 mm before treatment (Fig. 1D) and
after treatment (Fig. 1E) were measured on the scans of the superimposed models. The distal border for measuring the area of the alveolar process on a given slice was a straight line connecting the midpoints on the buccal side of the occlusal surface of the right
and left first molars identified on the T1 model. After
superimposition, the original (T1) distal border refer-ence line was transferred to the post-treatment (T2)
digital model. Therefore, the movement of the first
permanent molars during treatment did not influ
-ence the measurement area of the alveolar process (Fig. 1D, E). All models were scanned and measured
by one investigator (first author). All measurements
were performed with 1/100 mm precision.
Reliability of the method and statistical analysis Twenty randomly selected models were once re-scanned, once re-superimposed, and then once
remeasured by the same investigator (first author)
after > 2 weeks. Measurement error was analysed using Dahlberg’s formula and intraclass correlation
coefficient (ICC). The occurrence of bias (systematic
error) was assessed using paired t-tests.
Independent t-tests were used to compare the
sec-tion areas at cervical levels 0, 2, and 4 mm between
subjects from extraction and non-extraction groups, while paired t-tests were used to assess changes from T1 to T2 in groups. Correlational analysis and regression models were used to assess the relation-ship between the section areas at cervical levels 0, 2,
and 4 mm and changes during treatment (from T1
to T2). All tests were interpreted at the 0.05 level of
significance. The Excel 2013 (Microsoft, Redmond,
WA, USA), SPSS (Statistical Package for the Social
Sciences), Statistics 23 (IBM, Armonk, NY, USA), and MedCalc software (Mariakerke, Belgium) were used
for statistical analysis.
resUlts
Reliability of the methodMeasurement error ranged from 0.650 to 0.798 according to Dahlberg’s formula. The ICCs ranged from 0.998 to 1, implying almost perfect reliability. No systematic error was found with paired t-tests (p > 0.05). Intra-observer measurement variability ranged from 0.83 to 0.97 for the section area at levels 2 and 0, respectively.
Pre-treatment morphology
Mean values, standard deviations, ranges, and percentile distributions of the pre-treatment area of the alveolus section surface measured at levels 0, 2,
and 4 are presented in Table 1. The areas were highly correlated with each other — correlation coefficients ranged from 0.797 (levels 0 and 4) to 0.942 (lev
-els 0 and 2), and to 0.945 (lev-els 2 and 4). Table 2
demonstrates pre-treatment measurements in the whole sample and groups. The mean area of the alveo-lus section before treatment was smallest at level 0 and
largest at level 4. No differences were observed between
extraction and non-extraction groups (p = 0.246, 0.902, and 0.498 for levels 0, 2, and 4, respectively).
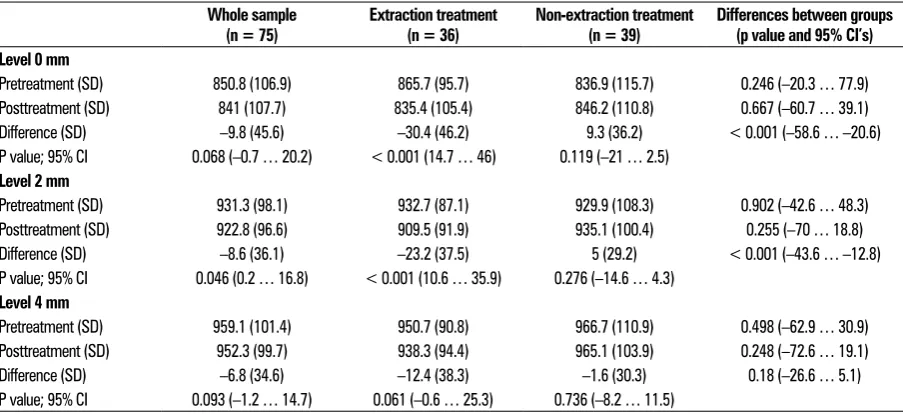
Changes during treatment
Changes during treatment are presented in Table 2. The area of the section decreased in the whole sample
at all levels (0, 2, and 4). However, only the change
registered at level 2 was statistically significant
(p = 0.046; Table 2). In the extraction group, changes occurring during treatment were statistically significant
for levels 0 and 2 (p < 0.001 and p < 0.001,
respec-tively), while those observed at level 4 were statistically non-significant (p = 0.061). Comparison of changes
in extraction and non-extraction groups showed that those registered at levels 0 and 2 were statistically
highly significant (p < 0.001), while changes measured at level 4 were statistically non-significant (p = 0.18).
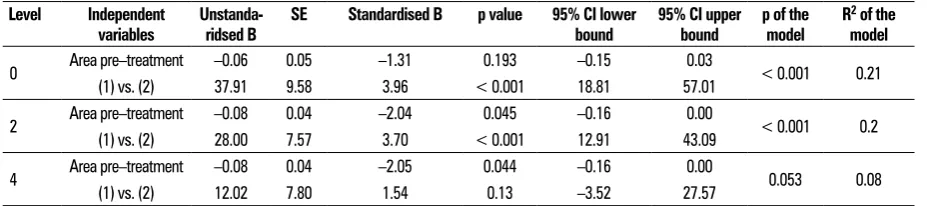
Relationship between pre-treatment morphology and the number of changes during treatment
Regression models (Table 3) with treatment al-ternatives (extraction vs. non-extraction) and pre-Table 1. Area of the section of the alveolar process measured pre-treatment in the whole sample (n = 75)
Level Mean SD Minimum Maximum Percentiles
5 10 25 50 75 90 95
0 850.8 106.9 660.1 1223.8 682.6 714.2 773.0 840.7 918.3 1010.0 1023.4
2 931.3 98.1 737.3 1325.4 786.5 814.7 863.9 920.3 981.5 1047.4 1100.1
4 959.1 101.4 764.7 1368.5 817.0 833.8 881.1 953.5 1009.4 1067.1 1120.2
Table 2. Changes during treatment in the whole sample and extraction and non-extraction groups
Whole sample(n = 75) Extraction treatment (n = 36) Non-extraction treatment (n = 39) Differences between groups (p value and 95% CI’s) Level 0 mm
Pretreatment (SD) 850.8 (106.9) 865.7 (95.7) 836.9 (115.7) 0.246 (–20.3 … 77.9)
Posttreatment (SD) 841 (107.7) 835.4 (105.4) 846.2 (110.8) 0.667 (–60.7 … 39.1)
Difference (SD) –9.8 (45.6) –30.4 (46.2) 9.3 (36.2) < 0.001 (–58.6 … –20.6)
P value; 95% CI 0.068 (–0.7 … 20.2) < 0.001 (14.7 … 46) 0.119 (–21 … 2.5) Level 2 mm
Pretreatment (SD) 931.3 (98.1) 932.7 (87.1) 929.9 (108.3) 0.902 (–42.6 … 48.3)
Posttreatment (SD) 922.8 (96.6) 909.5 (91.9) 935.1 (100.4) 0.255 (–70 … 18.8)
Difference (SD) –8.6 (36.1) –23.2 (37.5) 5 (29.2) < 0.001 (–43.6 … –12.8)
P value; 95% CI 0.046 (0.2 … 16.8) < 0.001 (10.6 … 35.9) 0.276 (–14.6 … 4.3) Level 4 mm
Pretreatment (SD) 959.1 (101.4) 950.7 (90.8) 966.7 (110.9) 0.498 (–62.9 … 30.9)
Posttreatment (SD) 952.3 (99.7) 938.3 (94.4) 965.1 (103.9) 0.248 (–72.6 … 19.1)
Difference (SD) –6.8 (34.6) –12.4 (38.3) –1.6 (30.3) 0.18 (–26.6 … 5.1)
P value; 95% CI 0.093 (–1.2 … 14.7) 0.061 (–0.6 … 25.3) 0.736 (–8.2 … 11.5)
treatment area of the alveolus (at levels 0, 2, and 4,
respectively) as independent variables and the change in section surface of the alveolus during treatment
(at levels 0, 2, and 4, respectively) as dependent
variables showed that the pre-treatment area of the alveolus was a predictor of change during treatment
only at level 2 (at level 4, the model was statistically non-significant). However, the effect of the pre-treat -ment area of the alveolus on dependent variables
was limited — standardised B coefficient was –2.04
and R2 of the model was 0.2. Treatment alternatives
affected changes in the section surface of the al-veolus during treatment, measured at levels 0 and 2 — non-extraction treatment was associated with larger increases of 37.9 mm2 (level 0) and 28 mm2
(level 2) in comparison to extraction treatment. It should be noted that regression models explained approximately 20% of the variance in the sample.
dIscUssIon
One of the axioms in orthodontics holds that the bone follows the tooth during its movement through the alveolus. This is possible thanks to bone remod-elling — a coupled process of bone resorption and apposition elicited by the mechanical force applied to the tooth by an orthodontic appliance [9, 22]. The ratio between remodelling of the alveolar process and tooth movement is claimed to be 1:1. If this ratio is preserved, the root of the tooth is always supported by the alveolar bone and no bone loss occurs during
orthodontic treatment [4]. However, this ratio is not
achieved every time in all types of tooth movement, or in all areas of the alveolar process. For example, studies on the effects of tooth movement across the alveolus demonstrate that when the tooth apices were displaced into cortical bone, through penetra-tion, the roots’ surface became exposed. Reverse
movement of the roots into the cancellous bone of the alveolus allowed for partial osteogenesis [19].
However, it was not sufficient to cover the root fully
[20]. The lack of full regeneration of the cortical bone was observed even several years after treatment [5]. An unfavourable consequence of this phenomenon can be periodontal breakdown, particularly when
inflammation of the periodontal tissues coincides. Based on the results of this study, it is proposed
that for patients in whom the surface area of the alveolus on pre-treatment digital models is measured at level 0 at less than 773 mm2, level 2 at less than
863.9 mm2, and level 4 at less than 881.1 mm2, the
tooth movement across the alveolar process (i.e. pro-clination/retroclination of anterior teeth, expansion of posterior dental segment) should be planned with particular caution. In such patients, the area of the
al-veolus is significantly below average (it lies within the
25th percentile) and one can reasonably assume that
the possibility of bringing the root into the cortical bone, or even worse — penetrating it, is increased in comparison to patients with a thick alveolar process. On the other hand, for patients in whom the surface area of the alveolar process at level 0 measures more than 918.3 mm2, at level 2 more than 981.5 mm2,
and at level 4 is more than 1009.4 mm2, the teeth can
have less constraint from the cortical bone, hence, less caution may be required during planning and execution of orthodontic treatment.
Extraction of teeth is frequently associated with palatal movement of the remainder [2, 17]. The results
of this study confirm that extractions of maxillary first
premolars followed by orthodontic space closure cause a decrease in the section surface area of the alveolus. The mean percentage reduction of the pre-treatment area was < 5%. Nevertheless, caution is warranted in patients with a thin (as described above) alveolar Table 3. Regression models with the change of the area during treatment (measured at levels 0, 2, and 4) as dependent variable and area before treatment (measured at levels 0, 2, and 4) and treatment alternative (extraction vs. non-extraction) as independent variables
Level Independent
variables Unstanda- ridsed B SE Standardised B p value 95% CI lower bound 95% CI upper bound p of the model R 2 of the model
0 Area pre–treatment –0.06 0.05 –1.31 0.193 –0.15 0.03 < 0.001 0.21
(1) vs. (2) 37.91 9.58 3.96 < 0.001 18.81 57.01
2 Area pre–treatment –0.08 0.04 –2.04 0.045 –0.16 0.00 < 0.001 0.2
(1) vs. (2) 28.00 7.57 3.70 < 0.001 12.91 43.09
4 Area pre–treatment –0.08 0.04 –2.05 0.044 –0.16 0.00 0.053 0.08
(1) vs. (2) 12.02 7.80 1.54 0.13 –3.52 27.57
process. In these patients, palatal movement of the remaining teeth could result in dangerous approxima-tion of the root surfaces and the cortical bone with ensuing formation of bone dehiscence/fenestration [8].
The findings demonstrate that in a sample of or
-thodontic patients with typical malocclusion (Angle Class II Division 1 and Angle Class II Division 2 treated
with and without the extraction of maxillary first
premolars) the treatment alternatives of extraction vs. non-extraction are better predictors of changes in the surface section area of the alveolar process than its pre-treatment area. In other words, when a clinician plans a patient’s treatment, he/she needs to carefully consider the possible consequences of extraction and non-extraction treatment alternatives for the alveolus, especially for patients with a thin alveolar morphotype.
While radiography represents a “gold standard” for the evaluation of changes in the alveolar region during orthodontic therapy, it is associated with expo-sure to potentially harmful ionising radiation. In the present study, the authors attempt to create a non-invasive and simple method for monitoring changes in the alveolar bone during orthodontic therapy. To our knowledge, there are no current studies focusing on the measurement of the entire alveolar process
horizontally using a 3D scanner.
Limitations of the study
In this study, extraction and non-extraction groups comprise subjects with Angle Class II Division 1 and Angle Class II Division 2 malocclusion. Pre-treatment inclination of maxillary central incisors — proclined in Division 1 and retroclined in Division 2 malocclu-sion — could have affected measurement of the pre-treatment area of section surface area of the alveolus. In order to prevent this, the ratio of patients was balanced with Angle Class II Division 1 and Angle Class II Division 2 malocclusion in the extraction and non-extraction groups.
Only the post-adolescent subjects in this inves-tigation were evaluated. Therefore, the results can be generalised only for subjects at a similar devel-opmental stage.
The assessed changes of the alveolar process were based on the scans of its external surface. Thus, any measurement of the section surface area of the al-veolus is a combination of the measurement through soft tissues and the underlying alveolar bone.
conclUsIons
Within the limitations of the study the following conclusions can be drawn: (a) Digital model analysis of the dental arch should be used in planning ortho-dontic treatment; (b) Patients for whom the surface area of the alveolar process is measured on pre-treat-ment digital models at < 773 mm2, < 863.9 mm2,
and < 881.1 mm2 at levels 0, 2, and 4, respectively,
should be described as having a “thin” alveolus; (c) Extraction treatment, which is associated with a decrease in the alveolus area, should be exercised with caution in subjects with a thin alveolus.
Acknowledgements
This work was in part supported by LO1304 from
Ministry of Education, Youth and Sports, Czech Re
-public. We thank Vladimir Divoky, PhD (Faculty of Medicine and Dentistry, Palacký University, Olomouc) for his help with translation of the original research
findings and for his suggestions towards manuscript
finalisation, prof. Milan Kaminek, MD (Faculty of Med
-icine and Dentistry, Palacký University, Olomouc) for
helpful discussions, and Hana Böhmova, MD (Faculty
Hospital, Pilsen) for her technical assistance.
references
1. Aarts BE, Convens J, Bronkhorst EM, et al. Cessation
of facial growth in subjects with short, average, and long facial types - Implications for the timing of
im-plant placement. J Craniomaxillofac Surg. 2015; 43(10): 2106–2111, doi: 10.1016/j.jcms.2015.10.013, indexed in
Pubmed: 26548528.
2. Ahn HW, Moon SC, Baek SH. Morphometric evaluation of
changes in the alveolar bone and roots of the maxillary anterior teeth before and after en masse retraction using cone-beam computed tomography. Angle Orthod. 2013;
83(2): 212–221, doi: 10.2319/041812-325.1, indexed in
Pubmed: 23066654.
3. Bailey LT, Esmailnejad A, Almeida MA. Stability of the pala -tal rugae as landmarks for analysis of den-tal casts in extrac-tion and nonextracextrac-tion cases. Angle Orthod. 1996; 66(1):
73–78, doi: 10.1043/0003-3219(1996)066<0073:SOTPR
A>2.3.CO;2, indexed in Pubmed: 8678349.
4. Baloul S. Osteoclastogenesis and osteogenesis during tooth movement. Tooth Movement. 2016; 18: 75–79, doi: 10.1159/000351901.
5. Duterloo HS. The impact of orthodontic treatment proce-dures on the remodelling of alveolar bone. Orthodontische
Studieweek. Ned Ver Orthod Studie. 1975: 5–21.
6. Grauer D, Cevidanes LH, Tyndall D, et al. Registration of orthodontic digital models. Craniofac Growth Ser. 2011;
48: 377–391, indexed in Pubmed: 26549917.
7. Güleç A, Kaçıra BK, Kütahya H, et al. Morphometric analysis
three-dimensional computed tomography: correlation with sex, age, and height. Folia Morphol. 2017; 76(3):
433–439, doi: 10.5603/FM.a2017.0005, indexed in
Pub-med: 28150271.
8. Handelman CS. The anterior alveolus: its impor-tance in limiting orthodontic treatment and its in-fluence on the occurrence of iatrogenic sequelae.
Angle Orthod. 1996; 66(2): 95–109; discussion 109, doi: 10.1043/0003-3219(1996)066<0095:TAAIII>2.3.
CO;2, indexed in Pubmed: 8712499.
9. Krishnan V, Davidovitch Z. On a path to unfold-ing the biological mechanisms of orthodontic tooth
movement. J Dent Res. 2009; 88(7): 597–608, doi: 10.1177/0022034509338914, indexed in
Pub-med: 19641146.
10. Kuijpers MAR, Chiu YT, Nada RM, et al. Three-dimensional
imaging methods for quantitative analysis of facial soft tissues and skeletal morphology in patients with
oro-facial clefts: a systematic review. PLoS One. 2014; 9(4): e93442, doi: 10.1371/journal.pone.0093442, indexed in
Pubmed: 24710215.
11. Marinković S, Milić I, Djorić I, et al. Morphometric multi -slice computed tomography examination of the
craniover-tebral junction in neck flexion and extension. Folia Mor
-phol. 2017; 76(1): 100–109, doi: 10.5603/FM.a2016.0037,
indexed in Pubmed: 27830891.
12. Nouri M, Abdi AH, Farzan A, et al. Measurement of the
buccolingual inclination of teeth: manual technique vs 3-dimensional software. Am J Orthod Dentofacial Orthop.
2014; 146(4): 522–529, doi: 10.1016/j.ajodo.2014.06.018,
indexed in Pubmed: 25263155.
13. Pachêco-Pereira C, De Luca Canto G, Major PW, et al. Vari-ation of orthodontic treatment decision-making based on dental model type: A systematic review. Angle Orthod.
2015; 85(3): 501–509, doi: 10.2319/051214-343.1,
in-dexed in Pubmed: 25098186.
14. Rischen RJ, Breuning KH, Bronkhorst EM, et al. Re -cords needed for orthodontic diagnosis and treatment planning: a systematic review. PLoS One. 2013; 8(11):
e74186, doi: 10.1371/journal.pone.0074186, indexed in
Pubmed: 24265669.
15. Sadek MM, Sabet NE, Hassan IT, et al. Alveolar bone map-ping in subjects with different vertical facial dimensions.
Eur J Orthod. 2015; 37(2): 194–201, doi: 10.1093/ejo/
cju034, indexed in Pubmed: 25114124.
16. Salti L, Holtfreter B, Pink C, et al. Estimating effects of
craniofacial morphology on gingival recession and clinical
attachment loss. J Clin Periodontol. 2017; 44(4): 363–371, doi: 10.1111/jcpe.12661, indexed in Pubmed: 27930822. 17. Sarikaya S, Haydar B, Ciğer S, et al. Changes in alveolar
bone thickness due to retraction of anterior teeth. Am J
Orthod Dentofacial Orthop. 2002; 122(1): 15–26, indexed in Pubmed: 12142888.
18. Swasty D, Lee J, Huang JC, et al. Cross-sectional human mandibular morphology as assessed in vivo by cone-beam computed tomography in patients with different vertical facial dimensions. Am J Orthod Dentofacial
Orthop. 2011; 139(4 Suppl): e377–e389, doi: 10.1016/j.
ajodo.2009.10.039, indexed in Pubmed: 21435546.
19. Thilander B, Nyman S, Karring T, et al. Bone regeneration
in alveolar bone dehiscences related to orthodontic tooth
movements. Eur J Orthod. 1983; 5(2): 105–114, indexed in Pubmed: 6574916.
20. Wainwright WM. Faciolingual tooth movement: its influ -ence on the root and cortical plate. Am J Orthod. 1973;
64(3): 278–302, indexed in Pubmed: 4199008.
21. Wennström JL. Mucogingival considerations in orthodon
-tic treatment. Semin Orthod. 1996; 2(1): 46–54, indexed in Pubmed: 9161283.
22. Wise GE, King GJ. Mechanisms of tooth eruption and orthodontic tooth movement. J Dent Res. 2008; 87(5):
414–434, doi: 10.1177/154405910808700509, indexed
in Pubmed: 18434571.
23. Zhang S, Wang X, Ren X, et al. Applications of digital technology for the morphological study of C3-C7 vertebral
arch pedicle in children. Folia Morphol (Warsz). 2017; 76(3): 426–432, doi: 10.5603/FM.a2017.0003, indexed