ISSN 0015–5659 www.fm.viamedica.pl
A comparative morphometric study
of the myocardium during the postnatal
development in normotensive and
spontaneously hypertensive rats
A.A. Iliev, G.N. Kotov, B.V. Landzhov, L.S. Jelev, V.K. Kirkov, D.V. Hinova-Palova
Department of Anatomy, Histology and Embryology, Medical University of Sofia, Bulgaria[Received: 25 June 2017; Accepted: 30 August 2017]
Background: Differences in the size of cardiac muscle cells observed in normal and hypertrophic hearts have been assessed through different methodologies. Spontaneously hypertensive rats are often used as an experimental model of essential hypertension in humans, which allows researchers to study the relation between hypertension and cardiac hypertrophy. It has been shown that ventricular hypertrophy in mammals progresses and ventricular failure develops in the end stage of hypertrophy. The aim of the present study was to analyse a number of morphometric markers and compare them between male normotensive Wistar rats (WR) and male spontaneously hypertensive rats (SHR).
Materials and methods: The total number of male WR was 15, distributed in five age groups, each containing three animals: 2-week-old; 1-month-old; 3-month--old; 6-month3-month--old; 12-month-old. The male SHR were distributed in two age groups, each containing three animals: 1-month-old (young) and 6-month-old (adult).
Results: As aging progressed, both in male normotensive WR and in male SHR we noted a statistically significant increase in the morphometric parameters thickness of the free wall and the cross-sectional area of the cardiomyocytes and their nuclei and a decrease in the cardiomyocytic density in both ventricles. These changes were more pronounced and occurred at an earlier age in SHR.
Conclusions: The present study analyses in detail the alterations in the myocardium of the left and right ventricle, initiated by age-related hypertrophy, as well as hy-pertrophy induced by arterial hypertension. (Folia Morphol 2018; 77, 2: 253–265) Key words: comparative quantitative study, myocardium, postnatal, normotensive rats, spontaneously hypertensive rats
INTRODUCTION
Differences in the size of cardiac muscle cells observed in normal and hypertrophic hearts have been assessed by a small number of studies. Most of literature data are limited only to measurements of the cellular diameter or the cross-sectional area and
a few researchers have tried to measure the length of the cardiomyocyte [1, 5]. The irregular shape of cardiomyocytes and the location of the intercalated
discs make it difficult to determine the length of the
separate cells in tissue sections. While studying nor-mal human hearts, Ashley[5] measured the diameter
Folia Morphol., 2018, Vol. 77, No. 2
of cardiomyocytes at the level of the nucleus and discovered that it is longer in cells from the papillary muscles as opposed to cells from the free wall of both the left (LV) and the right ventricle (RV); furthermore,
muscle fibres in the LV are bigger than those in the
RV. In young spontaneously hypertensive rats (SHR), the diameter of cells in a papillary muscle from the LV is longer than that of cells in the free wall; from the 21st week onwards, the diameter of cells in the free
wall becomes longer than that of cells in the papillary
muscles [6]. Anversa et al.[3] reported a larger cross-sectional area in subendocardial cardiomyocytes from normotensive rats, while in the case of hypertrophy caused by hypertension, it is subepicardial cells which become larger than subendocardial. The authors also observed that the cellular length measured in tis-sue sections is longer in cells from the subepicardial layer in comparison to subendocardial cells both in normotensive rats and in SHR.
Spontaneously hypertensive rats are often used
as an experimental model of essential hypertension
in humans, which allows researchers to study and
influence the relation between hypertension as the
initiating factor and cardiac hypertrophy as a con-sequence to it [10, 32]. It has been shown that ven-tricular hypertrophy in mammals is a process which takes place for life and progresses as aging advances
[9, 30, 31]. Engelmann et al. [8] analysed cardiac
hypertrophy at the onset of its development, its full establishment as a morphological feature and its progression by assessing morphological alterations in the subepicardial and middle layers in the free wall
of the LV. Their results show that focal necrosis is first
observed in the subepicardial and middle layers at as
early as 6 months of age in SHR. Some authors [18, 28, 29] reported the presence of a secondary growth
phase in the LV in SHR, while according to others[35] ventricular growth becomes stable between 7 and 15 months of age. The increased interstitial space, aging of the cardiomyocytes and the increase in the mean diffusion distance probably contribute to the occurrence of ventricular failure observed in the end
stage of hypertrophy [8, 11].
Okabe et al. [24] found no significant differences
in the dimensions of the cardiomyocytes in the sub-epicardial layer of the LV wall in young normotensive
Wistar-Kyoto rats (WKY) and SHR (3–8-week-old).
In WKY the adolescent period between the age of
8 and 15 weeks was characterised by a continuous
growth of cardiomyocytes from the LV with the same
length/width ratio as in the group of younger animals. On the contrary, in SHR, the length/width ratio of LV
cardiomyocytes was significantly reduced due to the
fact that their dimensions increased more in width than in length [24]. Okabe et al. [24] also found that in WKY the age-associated reduction in the number of side-to-side junctions occurred gradually over the postnatal period, while in SHR, this reduction acceler-ated from age 15 weeks onwards [24]. This may be considered a sign of structural dissociations which are probably caused by the accumulation of colla-gen and the increase in the intercellular space in the hypertrophied myocardium [24].
The aim of the present study was to analyse and compare a number of morphometric markers (thickness of the wall, cross-sectional area of the cardiomyocytes, cross-sectional area of the nuclei, nuclear-cytoplasmic ratio [NCR], cardiomyocytic
den-sity) traced among five age groups of male normo -tensive Wistar rats (WR) and two age groups (young
— 1-month-old and adult — 6-month-old) male
SHR. The dynamic changes in some of the cellular parameters (cross-sectional area of the nuclei, NCR, cardiomyocytic density), which were presented and
compared have been studied for the first time and no correlations were found in literature, which expands
our knowledge of quantitative characteristics of the cardiomyocytes during the postnatal development of normotensive WR and SHR.
MATERIALS AND METHODS
In the present study, we used histological material from the hearts of male normotensive WR and SHR.
The total number of WR was 15, distributed in five age
groups, each containing three animals: 2-week-old;
1-month-old; 3-month-old; 6-month-old;
12-month--old. The SHR were distributed in two age groups, each containing three animals: 1-month-old (young) and
6-month-old (adult). All experiments were conducted
with the approval of the University Committee on
Animal Resources (No. 4866). All animals received
humane care in compliance with the “Principles of laboratory animal care” formulated by the National Society for Medical Research and the “Guide for the care and use of laboratory animals” prepared by the National Institute of Health (NIH publication No.
86–23, revised 1996). The animals were anaesthetised
the blood in the cardiac cavities. After a short fixation
in 10% neutral buffered formalin, a transverse section was performed through the middle of the heart, a lit-tle below the level of the cardiac valves, thus dividing the heart into two halves. The hearts were then placed again in 10% neutral buffered formalin for
immer-sion fixation. Afterwards, they were fixed in paraffin blocks, from which we prepared 7 μm wide paraffin
tissue slides. These slides represented a series of trans-verse cross-sections through the ventricles, which were
stained with haematoxylin and eosin (H&E).
The morphometric analysis was performed on
five slides from the heart of each animal. Quantita -tive data were obtained with a computerised system for image analysis NIS-Elements Advanced Research (Ver. 2.30). The areas of interest in each slide were
first found on low magnifications (×100, ×200),
taking into account the respective age group.
Af-terwards, at magnification ×400 we photographed
an area of the myocardium, containing transversely cut cardiomyocytes, and a zone with surface area of 0.04 mm2 was marked. The borders of the
cardio-myocytes within the zone were outlined. Due to the fact that cardiomyocytes are elongated, the contours frequently passed through the cells; therefore, in order to make a good comparison of the data, it was decided that the marked zone should include these cells which are adjacent, on the inside or outside, to two perpendicular contours and, respectively, should not include cells which are adjacent, on the inside or outside, to the other two borders. After outlining the borders, the following morphometric parameters were obtained automatically: thickness of the free wall of the LV and RV (μm); cross-sectional area of the cardiomyocyte (μm2); cross-sectional area of the
nuclei (μm2); NCR; cardiomyocytic density —
calcu-lated as number of cells per unit of surface area of the slide (number of cells/mm2).
Statistical analysis
The obtained quantitative data were demonstrat-ed with diagrams and were statistically evaluatdemonstrat-ed
through a Student t-test. Statistically significant dif -ferences were read in the case of p < 0.05. Microsoft
Office Excel 2010 was used to process the data and to
demonstrate the obtained results in an adequate way.
RESULTS
Results were obtained through assessment of randomly selected zones of the myocardium with
no significant ruptures resulting from the process -ing technique of the histological material that could compromise the proper data analysis (Figs. 1–7). We organised the results in the form of tables and diagrams, representing the respective quantitative data for LV and RV in normotensive WR and SHR. The comparative analysis gave a numerical representation of the degree of growth of the myocardium, the in-dividual cardiomyocytes and their nuclei depending on the degree of afterload of the respective ventricle.
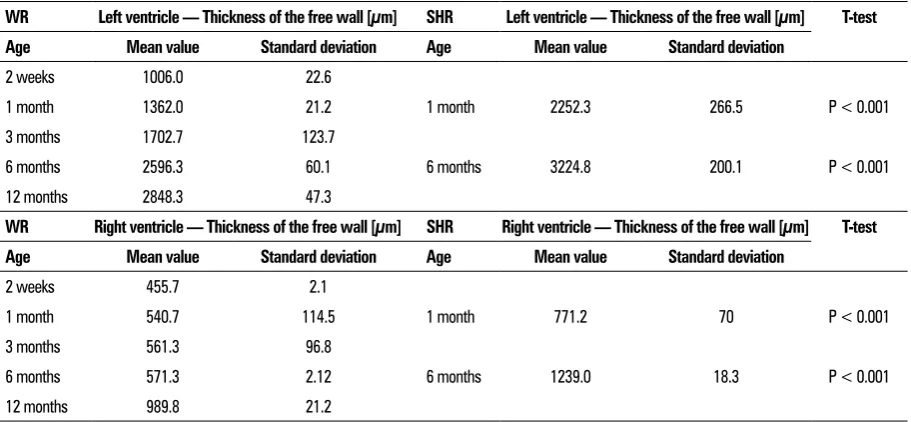
The rate at which the thickness of the free wall of the LV increased in young (1-month-old) SHR was
comparable to that in adult (6-month-old) normo -tensive WR. Similar changes were observed in adult
(6-month-old) SHR in which the thickness of the free wall of the LV exceeded even that observed in Figure 1. Photomicrograph of left ventricle, age — 3 months, Wistar rat, haematoxylin and eosin, size bar: 100 mm.
Folia Morphol., 2018, Vol. 77, No. 2
senescent (12-month-old) normotensive WR. A thor-ough comparative analysis of the changes in the thick-ness of the free wall of the RV in all groups showed
a relatively smooth increase, with no significant
peaks; we also noted that in SHR the thickness again
exceeded the value of this parameter in the respec
-tive age groups of normotensive WR (Fig. 8, Table 1).
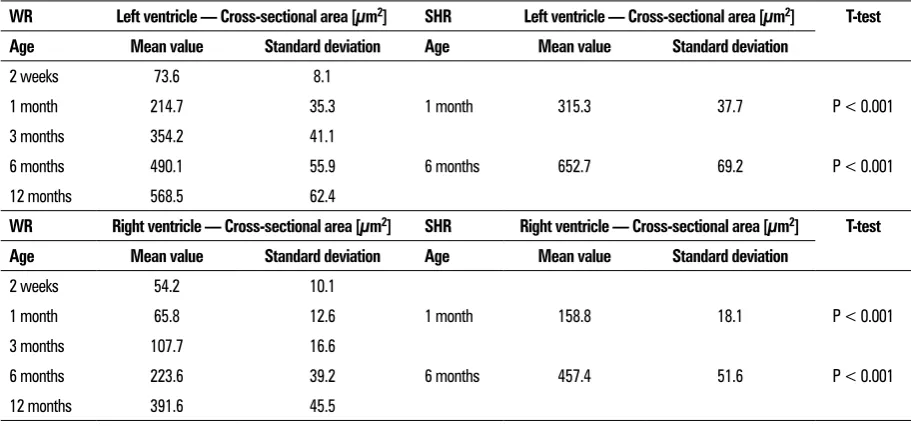
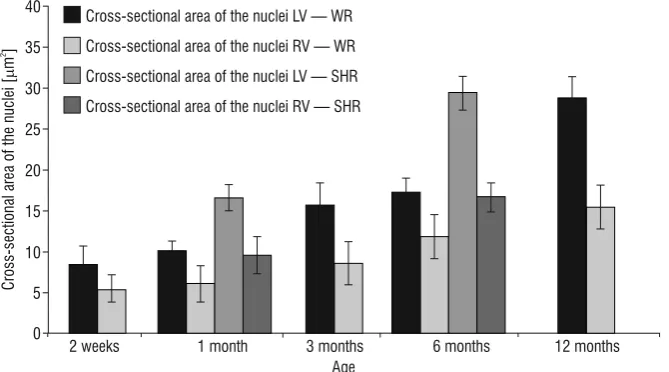
We observed a similar tendency in the values of two other parameters — cross-sectional area of the
cardiomyocytes (Fig. 9, Table 2) and of their nuclei
(Fig. 10, Table 3). Changes in these markers in cardio-myocytes from the LV of young (1-month-old) SHR were comparable to those of 3-month-old normo-tensive WR, while in cardiomyocytes from the RV, the values of the parameters in young (1-month-old) SHR Figure 3. Photomicrograph of right ventricle, age — 1 month,
Wistar rat, haematoxylin and eosin, size bar: 100 mm.
Figure 4. Photomicrograph of left ventricle, age — 1 month, spontaneously hypertensive rats, haematoxylin and eosin, size bar: 200 mm.
Figure 5. Photomicrograph of left ventricle, age — 6 months, spontaneously hypertensive rats, haematoxylin and eosin, size bar: 100 mm.
Figure 6. Photomicrograph of right ventricle, age — 1 month, spontaneously hypertensive rats, haematoxylin and eosin, size bar: 100 mm.
exceeded those in 3-month-old normotensive WR. We noted that the results in adult (6-month-old) SHR
were comparable to those in senescent (12-month-old) normotensive WR both for cardiac muscle cells from the LV and the RV. Furthermore, the values for the cross-sectional area of the cardiomyocytes in adult SHR were higher than those in senescent
nor-motensive WR and a statistically significant difference
between the two groups was read.
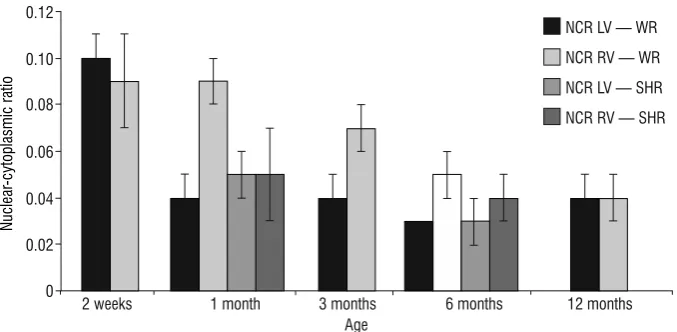
We clearly noted a tendency for decrease in the NCR both in normotensive WR and in SHR.
Con-sidering that the cross-sectional areas of the car-diomyocytes and their nuclei from both ventricles in young (1-month-old) SHR were comparable to those
in 3-month-old normotensive WR, we expected that
the NCR in these age groups would have similar and comparable values. As the graphic shows, we noted similar results for the NCR in young SHR and adult
normotensive WR. In adult (6-month-old) SHR the
NCR was comparable to that in senescent (12-month--old) normotensive WR, which followed the same pattern as the parameter cross-sectional area for Table 1. Numerical representation of the comparative analysis of the morphometric parameter thickness of the free wall of the left and right ventricle in normotensive Wistar rats (WR) and spontaneously hypertensive rats (SHR)
WR Left ventricle — Thickness of the free wall [μm] SHR Left ventricle — Thickness of the free wall [μm] T-test Age Mean value Standard deviation Age Mean value Standard deviation
2 weeks 1006.0 22.6
1 month 1362.0 21.2 1 month 2252.3 266.5 P < 0.001
3 months 1702.7 123.7
6 months 2596.3 60.1 6 months 3224.8 200.1 P < 0.001
12 months 2848.3 47.3
WR Right ventricle — Thickness of the free wall [μm] SHR Right ventricle — Thickness of the free wall [μm] T-test Age Mean value Standard deviation Age Mean value Standard deviation
2 weeks 455.7 2.1
1 month 540.7 114.5 1 month 771.2 70 P < 0.001
3 months 561.3 96.8
6 months 571.3 2.12 6 months 1239.0 18.3 P < 0.001
12 months 989.8 21.2
Folia Morphol., 2018, Vol. 77, No. 2
both cardiomyocytes and their nuclei (Fig. 11, Table 4). Changes in the NCR had a relatively smooth rate due to the fact that the cross-sectional areas of the cardiomyocytes and their nuclei increased uniformly. We noted that the dynamics of this parameter were
not well defined as was expected. Most probably, this
was due to the fact that advancing age was related to an increase in the number of binucleated cells as a result of the development of cardiomyocytic hyper-trophy. Moreover, the volume of the cardiac muscle
cell increases as well; this measurement does not participate in the calculation of the NCR. Nevertheless, the NCR showed a tendency for the cardiomyocytes to enlarge as aging advanced.
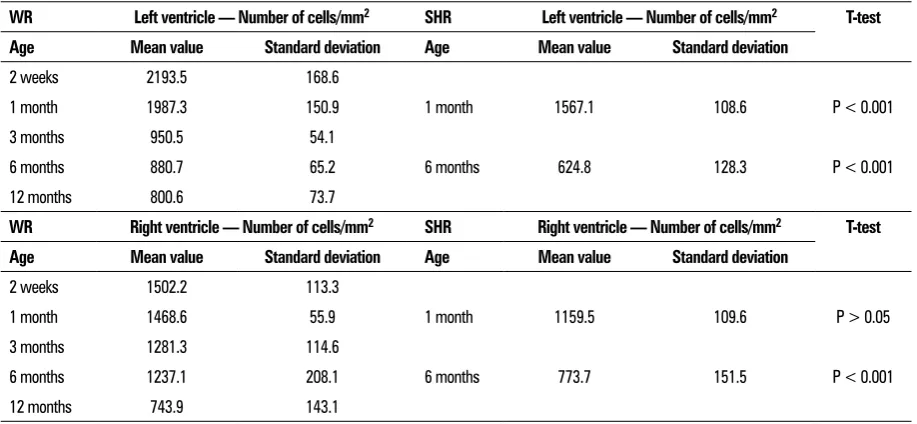
Changes in the parameter cardiomyocytic density from both ventricles were inversely proportional to those observed for the cross-sectional area. Over the whole postnatal period, the values decreased in both ventricles. We noted that the parameter in cells from the LV in young (1-month-old) SHR was not Table 2. Numerical representation of the comparative analysis of the morphometric parameter cross-sectional area of the
cardiomyocytes in normotensive Wistar rats (WR) and spontaneously hypertensive rats (SHR)
WR Left ventricle — Cross-sectional area [μm2] SHR Left ventricle — Cross-sectional area [μm2] T-test Age Mean value Standard deviation Age Mean value Standard deviation
2 weeks 73.6 8.1
1 month 214.7 35.3 1 month 315.3 37.7 P < 0.001
3 months 354.2 41.1
6 months 490.1 55.9 6 months 652.7 69.2 P < 0.001
12 months 568.5 62.4
WR Right ventricle — Cross-sectional area [μm2] SHR Right ventricle — Cross-sectional area [μm2] T-test Age Mean value Standard deviation Age Mean value Standard deviation
2 weeks 54.2 10.1
1 month 65.8 12.6 1 month 158.8 18.1 P < 0.001
3 months 107.7 16.6
6 months 223.6 39.2 6 months 457.4 51.6 P < 0.001
12 months 391.6 45.5
comparable to that in 3-month-old and 6-month-old WR, being significantly higher. The cardiomyocytic
density in the right ventricle for the same groups did
not exhibit such significant difference. The values in adult (6-month-old) SHR were comparable to those
in senescent (12-month-old) normotensive WR in both ventricles. The thorough analysis of the chang-es in the cardiomyocytic density in the LV in adult
(6-month-old) SHR showed a decrease in the values
when compared to those in senescent (12-month-old) normotensive WR (Fig. 12, Table 5).
The changes observed during the comparative analysis of the studied morphometric parameters
cor-related with a more clearly pronounced hypertrophy in the free wall of the LV as aging advanced in the groups of SHR. Changes were more dynamic in the LV due to the fact that the higher arterial pressure in the systemic circulation mostly affected its afterload. It should be noted that age-related hypertrophy was also observed in normotensive WR. Hypertrophic
al-terations were reflected in detail by the parameters
cross-sectional area of the cardiomyocytes (the values of which showed an intensive increase over the post-natal period) and cardiomyocytic density (the values of which showed a smooth decrease, most notable at the transition from young to adult animals). These Figure 10. Graphical representation of the comparative analysis of the morphometric parameter cross-sectional area of the cardiomyocytic nuclei in normotensive Wistar rats (WR) and spontaneously hypertensive rats (SHR); LV — left ventricle; RV — right ventricle.
Table 3. Numerical representation of the comparative analysis of the morphometric parameter cross-sectional area of the cardiomyocytic nuclei in normotensive Wistar rats (WR) and spontaneously hypertensive rats (SHR)
WR Left ventricle — Cross-sectional area [μm2] SHR Left ventricle — Cross-sectional area [μm2] T-test Age Mean value Standard deviation Age Mean value Standard deviation
2 weeks 8.5 2.2
1 month 10.1 1.2 1 month 16.6 1.6 P < 0.001
3 months 15.7 2.8
6 months 17.3 1.7 6 months 29.4 2.1 P < 0.001
12 months 28.7 2.7
WR Right ventricle — Cross-sectional area [μm2] SHR Right ventricle — Cross-sectional area [μm2] T-test Age Mean value Standard deviation Age Mean value Standard deviation
2 weeks 5.5 1.6
1 month 6.1 2.2 1 month 9.6 2.3 P < 0.001
3 months 8.6 2.6
6 months 11.9 2.7 6 months 16.7 1.8 P < 0.001
Folia Morphol., 2018, Vol. 77, No. 2
changes were initiated at an earlier age in SHR as compared to the corresponding age groups of nor-motensive WR.
DISCUSSION
Data from the studies of Anversa et al.[4] show
that with advancing age, a significant loss of muscle fibres is observed in both ventricles. The compara -tive analysis of cardiomyocytic density in the present
study also confirms the presence of age-related loss
of cardiac muscle cells. The rate at which this
phe-nomenon is expressed is almost identical in both
ventricles but persists longer in the LV. Over the period
4–12 months, a 19% decrease in the total number of
cardiomyocytes from both ventricles was calculated by Anversa et al.[4]. Over subsequent age intervals, a similar decrease was observed in the LV, while in the RV the initial loss undergoes a full reverse until the 12th month. This proves that the loss of functional
muscle tissue over the course of aging precedes the onset of ventricular dysfunction. The studies of An-versa et al.[4] also support the thesis that a similar phenomenon is seen in human hearts. The mecha-nisms, which take a central place in the development of cardiomyocytic loss and the formation of zones of
interstitial and replacement fibrosis, are not entirely
Table 4. Numerical representation of the comparative analysis of the morphometric parameter nuclear-cytoplasmic ratio (NCR) in normotensive Wistar rats (WR) and spontaneously hypertensive rats (SHR)
WR Left ventricle — NCR SHR Left ventricle — NCR T-test
Age Mean value Standard deviation Age Mean value Standard deviation
2 weeks 0.1 0.01
1 month 0.04 0.01 1 month 0.05 0.01 P < 0.001
3 months 0.04 0.01
6 months 0.03 0 6 months 0.03 0.01 P < 0.05
12 months 0.04 0.01
WR Right ventricle — NCR SHR Right ventricle — NCR T-test
Age Mean value Standard deviation Age Mean value Standard deviation
2 weeks 0.09 0.02
1 month 0.09 0.01 1 month 0.05 0.02 P < 0.001
3 months 0.07 0.01
6 months 0.05 0.01 6 months 0.04 0.01 P < 0.001
12 months 0.04 0
clear. The role of local ischaemia has been discussed, as the adaptive abilities of the coronary vessel reserve and its sustainability decrease in the process of aging [12]. Anversa et al.[4] also show that cellular hyper-plasia also participates in the hypertrophic response of the myocardium during the process of aging. For this reason, measuring only the mean volume of the
cardiomyocyte may lead to an insufficient precision
of the assessment of the growth of cardiac muscle cells. The effect which aging has on both ventricles has a different quantitative dimension which was sup-ported by the results of our study. Although the study
of Anversa et al.[4] shows that cardiomyocytic loss in the two ventricles is comparable, the degree of cel-lular hyperplasia in the LV is higher than that in the RV. Over the course of the studied 25-month interval, the muscle component increased 1.75 times in the RV and 2.2 times in the LV. It can be stated therefore that
the myocardium of the RV has a significantly higher
reserve capacity with regard to growth as opposed to the LV. These differences are believed to arise from
the fact that the stress experienced by the LV over the period of postnatal development is significantly higher,
which depletes its reserve capacity at a younger age. Table 5. Numerical representation of the comparative analysis of the morphometric parameter cardiomyocytic density in normotensive Wistar rats (WR) and spontaneously hypertensive rats (SHR)
WR Left ventricle — Number of cells/mm2 SHR Left ventricle — Number of cells/mm2 T-test Age Mean value Standard deviation Age Mean value Standard deviation
2 weeks 2193.5 168.6
1 month 1987.3 150.9 1 month 1567.1 108.6 P < 0.001
3 months 950.5 54.1
6 months 880.7 65.2 6 months 624.8 128.3 P < 0.001
12 months 800.6 73.7
WR Right ventricle — Number of cells/mm2 SHR Right ventricle — Number of cells/mm2 T-test Age Mean value Standard deviation Age Mean value Standard deviation
2 weeks 1502.2 113.3
1 month 1468.6 55.9 1 month 1159.5 109.6 P > 0.05
3 months 1281.3 114.6
6 months 1237.1 208.1 6 months 773.7 151.5 P < 0.001
12 months 743.9 143.1
Folia Morphol., 2018, Vol. 77, No. 2
It is well known that with cessation of myocytic proliferation during the process of postnatal develop-ment, the physiological, as well as the induced growth of the myocardium, mostly take place hypertrophy of the cardiac muscle cells [20]. This fact has been
confirmed from our morphometric data with regard
to cardiomyocytic density. Other studies point out that cardiomyocytes from the atria[23] and the ven-tricles[4, 27] may be stimulated through induction of nuclear hyperplasia. Literature data support the hypothesis that nuclear hyperplasia correlates with
a similar increase in the number of cells [26, 27].
This mechanism probably plays a role in the senes-cent myocardium as means to preserve the heart’s pumping function at the onset of heart failure and
represents the myocardium’s final response before
the onset of ventricular dysfunction and death [4].
According to our data, nuclear hyperplasia, reflected
in the parameter cross-sectional area of the nucleus
is most pronounced between 6 and 12 month of the
postnatal development, which supports the above hypothesis. The comparative analysis in the present study even shows that nuclear hyperplasia in normo-tensive 12-month-old WR is comparable to that in
6-month-old SHR. These data indirectly support the fact that this is one of the finals responses intended
to preserve the pumping function of the myocardium before the onset of impaired ventricular function.
The different values of the parameters of car-diomyocytic growth in SHR and normotensive rats are due to the different workload on the ventricles, which in turn is determined by the higher systemic arterial pressure in SHR. In SHR, the cellular volume increases by 151% which is achieved through an in-crease in the cross-sectional area by 77% and a total increase in the longitudinal size of the cardiomyocytic population by 42% [2]. Conversely, the mass of the cardiomyocytes in normotensive rats increases by 124% which is achieved through an increase in the cross-sectional area by 47% and an increase in the lon-gitudinal size of the cardiac muscle cells by 53% [2]. These data make it evident that in this group of rats, the increase in the diameter (21%) is less than half of the calculated increase in the longitudinal size (53%), while the rate of increase in the diameter (33%) and the length (42%) are closer to those observed in SHR. It has been found that the progressive increase in the diameter and cross-sectional area in SHR is achieved through a continuous increase in the systemic
arterial pressure [17, 19, 25, 34]. Wagner et al. [37]
reported that at age 10–12 weeks, the body weight of both WKY rats and SHR was identical; however, the heart weight in SHR was 30% higher than that of WKY rats. Furthermore, they found that SHR develop cardiac hypertrophy as early as 4 weeks of age and systolic and diastolic dysfunction at 2–3 months.
This phenomenon can be objectified quantitatively by a significant increase in the ratio between heart
weight and body weight, a general increase in the heart weight and arterial hypertension [37]. These changes in the parameters may be interpreted as a compensatory response of the myocardium at the cellular level, intended to decrease the effects of in-creased pre- and afterload of the heart [2]. Our previ-ous studies have shown that the myocardial response to increased stress includes ventricular remodelling with accumulation of collagen and development of
reactive fibrosis[21], a specific location-targeted
up-regulation of enzymes of the NOS group[13–15] and
a decrease in the capillary density [16].
No literature data are found with regard to the parameters cross-sectional area of the cardiomyocytic nuclei and NCR. These two morphometric markers provide a general understanding of the age-related hypertrophic alterations in the cardiac muscle cells. Furthermore, they give a fairly accurate assessment of the changes in cardiomyocytes as a result of increased afterload in the ventricles (like in hypertrophic condi-tions). The results of the present study demonstrate that the growth rate of the nuclei follows in a similar pattern the growth rate of the cardiac muscle cells both in the LV and in the RV. This dynamic is identical both in the age groups of normotensive WR and SHR. During the period of growth of the normotensive
WKY and the SHR (3–8-week-old) the dimensions of
the cardiomyocytes in the subepicardial layer of the LV wall are identical and increase identically without
any significant discrepancies in the length/width ratio [24]. Over the period of adolescence
(8–15-week--old) cardiomyocytes in the LV of WKY grew with the same length/width ratio as observed in the group of younger rats. On the contrary, in SHR, the length/
/width ratio of LV cardiomyocytes was significantly
reduced due to the fact that their dimensions in-creased disproportionately — more in width than in
length [24]. Our findings show that the values of the
morphometric parameters are higher in 1-month-old male SHR as compared to male normotensive Wistar rats of the same age. When comparing between adult
WKY, Okabe et al. [24] noted a marked thinning of lateral branches in the group of senescent animals. A
similar finding was reported for the groups of adult and senescent SHR, where a significant reduction in
the number of lateral branches was observed in se-nescent animals [24]. This decrease in the number of lateral branches may suggest possible dissociations of their end-to-end junctions with parallel neighbouring cells [24]. Moreover, the hypertrophied myocardium
contained zones of replacement fibrosis in the place
of cardiomyocytes which had undergone atrophic deformations and/or loss [24]. The presence of such
replacement fibrosis has been confirmed by our
previous studies [21]. These changes in the normal architectonics of the myocardium may predispose it towards development of arrhythmias due to the discontinuous conduction [24].
Under conditions of low-pressure hypoxia,
Moravec et al. [22] report the presence of RV hyper-trophy due to cardiomyocyte growth and
prolifera-tion of the extracellular matrix which continues to develop even after hypoxia has been reversed. They note that chronic hypoxia leads to a unilateral cardiac
hypertrophy. The weight of the LV remains unchanged or even decreased due to peripheral vasodilatation and decreased systemic vascular resistance. On the contrary, due to pulmonary vasoconstriction, the RV operates against an increased pressure. Some authors consider that a harmonious growth of the RV may be maintained until maturation by factors which induce continuous growth stimulation, one such factor being
the long-term exposure to low pressure hypoxia [22].
The concomitant presence of neoangiogenesis and polyploid muscle cells described by Moravec et al. [22] is the main factor behind the quantitative aspects of RV hypertrophy. Moreover, they report that during the early postnatal period, the simultaneous acceleration of myocyte growth and capillary proliferation is often
observed [16]. Similar results were obtained in other
models of ventricular hypertrophy due to chronic
me-chanical overloading [36]. The comparative analysis
of the morphometric parameters in the RV showed a smooth change in the values over time, with no
drastic peaks as aging progressed in the examined
groups of animals.
In their study, Cury et al. [7] used cardiac tissue from senescent rats under physiological aging con-ditions and analysed the length of the sarcomeres, as well as several morphometric parameters of the mitochondria. Based on previous measurements, they
reported an increase in the length of the sarcom-eres in adult as compared to young animals [7]. The mitochondrial volume density in the aged rat heart
was 33.83%, which was consistent with data from
previous studies and the authors concluded that no
significant loss of mitochondrial volume density was
observed with advancing age [7]. The values for the parameter mitochondrial area in aged rat cardiomyo-cytes were much more variable [7]. The thickness of
the mitochondrial cristae was investigated for the first
time and didn’t appear to have a large variation [7]. In the heart tissue of cardiomyopathic patients, Tandler et al. [33] report the presence of mitochondria with
a significant increase in the quantitative characteristics,
known as megamitochondria. These mitochondria, however, are characterised only by increase in the number and not the thickness of the cristae [7]. The cellular organelle which can be investigated and as-sessed quantitatively through the methods of light microscopy is the nucleus. Our results showed that aging in the two groups of animals (male
normoten-sive WR and male SHR) leads to significant changes
in the cardiomyocytic nuclei, especially in the LV. Cardiomyocytic nuclei from the RV grew slowly and without any drastic peaks. A similar decrease in the morphometric parameter nuclear-cytoplasmic ratio
was noted. These data confirm that aging of the
myocardium, both under physiological and patho-logical conditions, is associated not only with gross changes of the myocardial architectonics, but also
fine alterations of the cellular organelles.
CONCLUSIONS
The present study and the collected quantitative data, carefully analysed and traced over the course of the postnatal period, demonstrate a detailed and thorough assessment of changes in the myocardium and the cardiomyocytes in the LV and RV, initiated by age-related hypertrophy, as well as hypertrophy induced by arterial hypertension. Our results make it evident that these alterations are more pronounced and occur at an earlier age in the groups of SHR, as opposed to normotensive WR.
REFERENCES
1. Aherne W. A method of determining the cross sectional area of muscle fibres. J Neurol Sci. 1968; 7(3): 519–528, indexed in Pubmed: 5709860.
Folia Morphol., 2018, Vol. 77, No. 2
doi: 10.1152/ajpheart.1984.246.6.H739, indexed in Pubmed: 6742139.
3. Anversa P, Olivetti G, Melissari M, et al. Stereological measurement of cellular and subcellular hypertrophy and hyperplasia in the papillary muscle of adult rat. J Mol Cell Cardiol. 1980; 12(8): 781–795, doi: 10.1016/0022-2828(80)90080-2, indexed in Pubmed: 6448301. 4. Anversa P, Palackal T, Sonnenblick EH, et al. Myocyte
cell loss and myocyte cellular hyperplasia in the hy-pertrophied aging rat heart. Circ Res. 1990; 67(4): 871–885, doi: 10.1161/01.res.67.4.871, indexed in Pubmed: 2145091.
5. Ashley LM. A determination of the diameters of ventricu-lar myocardial fibers in man and other mammals. Am J Anat. 1945; 77: 325–363, indexed in Pubmed: 21005548. 6. Bishop SP, Oparil S, Reynolds RH, et al. Regional myocyte
size in normotensive and spontaneously hypertensive rats. Hypertension. 1979; 1(4): 378–383, doi: 10.1161/01. hyp.1.4.378, indexed in Pubmed: 161552.
7. Cury DP, Dias FJ, Sosthenes MC, et al. Morphometric, quantitative, and three-dimensional analysis of the heart muscle fibers of old rats: transmission electron microscopy and high-resolution scanning electron micros-copy methods. Microsc Res Tech. 2013; 76(2): 184–195, doi: 10.1002/jemt.22151, indexed in Pubmed: 23180425.
8. Engelmann GL, Vitullo JC, Gerrity RG. Morphometric
analysis of cardiac hypertrophy during development, maturation, and senescence in spontaneously hyperten-sive rats. Circ Res. 1987; 60(4): 487–494, doi: 10.1161/01. res.60.4.487.
9. Frenzel H, Feimann J. Age-dependent structural changes in the myocardium of rats. A quantitative light- and electron-microscopic study on the right and left chamber wall. Mech Ageing Dev. 1984; 27(1): 29–41, indexed in Pubmed: 6492886.
10. Frohlich E, Tarazi R. Is arterial pressure the sole factor responsible for hypertensive cardiac hypertrophy? Am J Cardiol. 1979; 44(5): 959–963, doi: 10.1016/0002-9149(79)90229-7.
11. Gilligan JP, Spector S. Synthesis of collagen in cardiac and vascular walls. Hypertension. 1984; 6(6 Pt 2): III44–III49, indexed in Pubmed: 6240453.
12. Hachamovitch R, Wicker P, Capasso JM, et al. Alterations of coronary blood flow and reserve with aging in Fischer 344 rats. Am J Physiol. 1989; 256(1 Pt 2): H66–H73, doi: 10.1152/ajpheart.1989.256.1.H66, indexed in Pub-med: 2912199.
13. Iliev A, Jelev L, Landzhov B, et al. An immunohistochemi-cal study of the expression of neuronal NOS in the myo-cardium of spontaneously hypertensive rats. Compt Rend Acad Bulg Sci. 2017; 70(8): 1157–1162.
14. Iliev A, Jelev L, Landzhov B, et al. Neuronal NOS im-munoreactivity in the myocardium of the rat during the postnatal period. Compt Rend Acad Bulg Sci. 2016; 69(7): 921–926.
15. Iliev A, Jelev L, Landzhov B, et al. Postnatal changes in the myocardium of the rat. A comparative light microscopic and immunohistochemical study. Compt Rend Acad Bulg Sci. 2016; 69(4): 505–512.
16. Iliev A, Kotov G, Landzhov B. et al. A comparative analysis of capillary density in the myocardium of normotensive
and spontaneously hypertensive rats. Acta Morphol Anthropol. 2017; 24: 19–25.
17. Imamura K. Ultrastructural aspect of left ventricu-lar hypertrophy in spontaneously hypertensive rats: a qualitative and quantitative study. Jpn Circ J. 1978; 42(8): 979–1002, indexed in Pubmed: 153413.
18. Ingwall JS, Fossel ET. Changes in the creatine kinase sys-tem in the hypertrophied myocardium of the dog and rat. In: Tarazi RC, Dunbar JB (eds.). Perspectives in Cardiovas-cular Research. Raven Press, New York. 1983: 601–607.
19. Kawamura K, Kashii C, Imamura K. Ultrastructural
changes in hypertrophied myocardium of spontaneously hypertensive rats. Jpn Circ J. 1976; 40(10): 1119–1145, indexed in Pubmed: 136527.
20. Korecky B, Rakusan K. Normal and hypertrophic growth of the rat heart: changes in cell dimensions and number. Am J Physiol. 1978; 234(2): H123–H128, doi: 10.1152/
ajpheart.1978.234.2.H123, indexed in Pubmed: 146437. 21. Kotov G, Iliev A, Landzhov B, et al. Postnatal changes
in the morphology of the myocardium in rat ventricles. Arch Anat Physiol. 2017; 2(1): 011–017, doi: 10.17352/ aap.000005.
22. Moravec M, Turek Z, Moravec J. Persistence of neoangio-genesis and cardiomyocyte divisions in right ventricular myocardium of rats born and raised in hypoxic condi-tions. Basic Res Cardiol. 2002; 97(2): 153–160, indexed in Pubmed: 12002263.
23. Oberpriller J. Changes in DNA content, number of nuclei and cellular dimensions of young rat atrial myocytes in re-sponse to left coronary artery ligation. J Mol Cell Cardiol. 1983; 15(1): 31–42, doi: 10.1016/0022-2828(83)90305-x. 24. Okabe M, Kawamura K, Terasaki F, et al. Remodeling of
cardiomyocytes and their branches in juvenile, adult, and senescent spontaneously hypertensive rats and Wistar Kyoto rats: comparative morphometric analyses by scan-ning electron microscopy. Heart Vessels. 1999; 14(1): 15–28, indexed in Pubmed: 10543310.
25. Okamoto K. Spontaneous hypertension its pathogenesis and complications. Springer-Verlag, New York 1972. 26. Olivetti G, Ricci R, Lagrasta C, et al. Cellular basis of wall
remodeling in long-term pressure overload-induced right ventricular hypertrophy in rats. Circ Res. 1988; 63(3): 648–657, doi: 10.1161/01.res.63.3.648, indexed in Pubmed: 2970334.
27. Olivetti G, Ricci R, Anversa P. Hyperplasia of myocyte nuclei in long-term cardiac hypertrophy in rats. J Clin Invest. 1987; 80(6): 1818–1822, doi: 10.1172/JCI113278, indexed in Pubmed: 2960697.
28. Pfeffer JM, Pfeffer MA, Fishbein MC, et al. Cardiac func-tion and morphology with aging in the spontaneously hypertensive rat. Am J Physiol. 1979; 237(4): H461–H468, doi: 10.1152/ajpheart.1979.237.4.H461, indexed in Pubmed: 495731.
29. Rakusan K, Hrdina PW, Turek Z, et al. Cell size and capil-lary supply of the hypertensive rat heart: quantitative study. Basic Res Cardiol. 1984; 79(4): 389–395, indexed in Pubmed: 6237640.
31. Schmucker DL, Sachs HG. Age-dependent alterations in rat ventricular myocardium: a quantitative analysis. Mech Ageing Dev. 1985; 31(1): 89–101, doi: 10.1016/0047-6374(85)90028-4, indexed in Pubmed: 2993765. 32. Sen S. Regression of cardiac hypertrophy. Experimental
animal model. Am J Med. 1983; 75(3A): 87–93, indexed in Pubmed: 6137950.
33. Tandler B, Dunlap M, Hoppel CL, et al. Giant mitochondria in a cardiomyopathic heart. Ultrastruct Pathol. 2002; 26(3): 177–183, doi: 10.1080/01913120290076847, indexed in Pubmed: 12184376.
34. Tomanek RJ, Davis JW, Anderson SC. The effects of alpha-methyldopa on cardiac hypertrophy in spontane-ously hypertensive rats: ultrastructural, stereological, and morphometric analysis. Cardiovasc Res. 1979; 13(3): 173–182, indexed in Pubmed: 157811.
35. Tomanek RJ, Searls JC, Lachenbruch PA. Quantitative changes in the capillary bed during developing, peak, and stabilized cardiac hypertrophy in the spontane-ously hypertensive rat. Circ Res. 1982; 51(3): 295–304, doi: 10.1161/01.res.51.3.295.
36. Tomanek RJ, Wessel TJ, Harrison DG. Capillary growth and geometry during long-term hypertension and myocardial hypertrophy in dogs. Am J Physiol. 1991; 261(4 Pt 2): H1011–H1018, doi: 10.1152/ajpheart.1991.261.4.H1011, indexed in Pubmed: 1833986.