Pavithra M et al, International Journal of Computer Science and Mobile Applications, Vol.4 Issue. 6, June- 2016, pg. 70-79 ISSN: 2321-8363
Impact Factor: 4.123
LBP-TOP DESCRIPTOR FOR
DETECTING INTERESTING EVENTS
Pavithra M
1, Dr. M.Vimaladevi
2ME.,Phd, Priyanga M
3, Yamuna Devi S
4M.E. Student, Head of the Department, M.E Student, M.E Student
Hindusthan Institute of Technology,Coimbatore, Tamilnadu India
Abstract
Theprevalent use of surveillance systems in road side, railwaystations, airports or malls has led to anenormous amountof data that wants to be analyzed for safety oreven commercial reasons.The mission of automatically detectingframes with anomalous or interesting events from longduration video sequences has concerned the research communityin the last decade. The existing system introduced a Swarm Intelligence based approach for Detecting InterestingEvents in Crowded Environments.The Histograms of Oriented Gradients (HOG) is used for capture the appearance information and Histograms of Oriented Swarms (HOS) is used for capture the frame dynamics. Both are combined to form a new descriptor that effectively characterizes each scene. However it does not considered dynamic texture to achieve high accuracy. To solve this problem the proposed system introduced histogram of Local Binary Patterns from Three Orthogonal Planes (LBP-TOP) to represent dynamic texture.In a time window of each frame average triplets of HOG, HOS and LBP-TOP are consecutively computed. Then, these features are passed as an input to classifier. Here proximal support machine is used for classification . Proximal Support Vector Machine is based on Support Vector Machine, it is simpler and faster than traditional Support Vector Machines algorithm, which is especially suitable for large amounts of data or image classification and operations. The experimental results show that the proposed system achieves better performance compared with existing system
.
Keywords:
Histograms of Oriented Gradients, Histograms of Oriented Swarms and texture.1. Introduction
Video analysis and video surveillance is an important research area. The key defy are video-based event discovery and large-scale data maintenance and retrieval. The detecting and tracking objects is a crucial capability for smart surveillance, the most critical defy in video-based surveillance (from the perspective of a human intelligence analyst) is retrieval of the analysis output to detect events of interest and identify trends. The task of automatic event detection from long duration video has gained an increasing attention.Crowds pose challenges for traditional computer vision and image/video processing methods, due to the presence of occlusions, varying crowd densities and the complex stochastic nature of their motion, so numerous alternative approaches have been developed to overcome these barriers.
Pavithra M et al, International Journal of Computer Science and Mobile Applications, Vol.4 Issue. 6, June- 2016, pg. 70-79 ISSN: 2321-8363
Impact Factor: 4.123
flexibility and the applicability of the proposed method over other existing methods. However, different types of datasets cannot be applied.
Ravi Ranjan et al [3] proposed a new method for clustering in anomaly intrusion detection by using the approach of K-medoids method of clustering and certain modifications were performed in it. The proposed algorithm is able to achieve high detection rate and overcomes the disadvantages of K-means algorithm. The proposed method solves the problem of dependency on the initial centroids and the number of cluster and irrelevant clusters. The work provided higher detection rate and low false negative rate; however it suffers from root attack.
Amin Karami et al [4] proposed a mew anomaly detection system based on fuzzy which had two phases of work. Initial phase is called as the training phase where hybridization of Particle Swarm Optimization (PSO) and K-means algorithm was proposed. The two algorithms were provided with two well-separated clusters of simultaneous cost functions and also local optimization to obtain the optimal number of clusters. Then in the second phase which is detection phase a fuzzy approach was proposed with the combination of two distance-based classification methods and an outlier for detect anomalies in new monitoring data. The proposed system provided high detection rate and decreased false positive rate. The main drawback of this system is that it lacks in accuracy.
Ibrahim Aljarah et al [5] proposed a parallel particle swarm optimization clustering algorithm based intrusion detection system that used MapReduce methodology. PSO was used to cluster the task as it avoids the sensitivity problem of initial cluster centroids and as well as the premature convergence. Large data sets were processed in proposed intrusion detection system on commodity hardware. The proposed work achieved a linear speedup as the intrusion detection and false alarm rates were improved. But the system lacks to detect different kinds of intrusion.
SeyedMojtabaHosseiniBamakan et al [6] proposed a multiple criteria linear programming and particle swarm optimization based method to enhance the accuracy of attacks detection. The proposed method is a classification method based on mathematical programming with a potential ability to solve real-life data mining problems. Particle swarm optimization (PSO) was implemented to tune the parameters to improve the performance of MCLP classifier. KDD CUP 99 dataset used to evaluate the performance of proposed method. The method improved the detection rate and false alarm rate.
In FangjunKuang et al [7] a new SVM model that combined kernel principal component analysis (KPCA) with improved chaotic particle swarm optimization (ICPSO) was proposed to deal with intrusion detection. Multi-layer SVM classifier was employed to estimate an attack and KPCA was applied as a preprocessor of SVM for the reduction of the dimension of feature vectors and shorten training time, and also used N-RBF to reduce the noise generated by feature differences. The ICPSO was presented to optimize the punishment factor C, kernel parameters ζ and the tube size ε of SVM. The proposed work had reduced the training time, and improved the prediction accuracy.
Saber M. Elsayed et al [8] proposed a new PSO algorithm to solve a variety of constrained optimization problems which considered a mix of different PSO variants. The PSO variants evolved a different number of individuals from the current population. The algorithm assigned more individuals to the better-performing variants and lesser to the worse-performing ones for each generation. A new PSO variant was also developed in proposed algorithm for better balance between local and global PSO versions. Thus the self adaptive PSO was proposed, tested and analyzed on two sets of test problems, namely the CEC2006 and CEC2010 constrained optimization problems. But the proposed algorithm does not solve for test problems.
Kim et.al. [13] also extract local opticalflow and enforce consistency across locations throughMarkov Random Field models. Benezeth et al. [5] usebinary background subtraction to extract motion labels andthen model these local features using a 3D Markov Random
Field (MRF). Kratz et al. [14] extract spatio-temporal gradientto fit Gaussian model, and then use HMM to detectabnormal events. Mahadevan et al. [15] model the normal
Pavithra M et al, International Journal of Computer Science and Mobile Applications, Vol.4 Issue. 6, June- 2016, pg. 70-79 ISSN: 2321-8363
Impact Factor: 4.123
2. Materials and methods
2.1 Input
The video is taken as an input and backgrounds are subtracted from input. Then ROI regions are extracted from it. In this system both motion and appearance features are considered for detecting anomalies. In order to capture the appearanceand motion the Histograms of Oriented Gradients (HOG) is used and Histograms of Oriented Swarms (HOS) is used respectively.
2.2 Appearance Modelling
HOG is a colour invariant feature. And also it captures the local edge and gradient structure. Each block k is divided into 2×2 cells. The divided block is selected to maintain a sufficient level of detail for describing appearance. For each cell weighted histogram of gradients is generated. The HOG of the cthcell (1 ≤ c ≤ 4) in block k of frame j is thus represented by HOGkj (c). After calculation of HOG for each for all frames in the temporal window, then they are averaged over 3 consecutive frames so as to take in richer temporal information and at the same time achieve temporally local noise elimination.
The final HOG descriptor for 3 frames average for each cell c in block k:
̅̅̅̅̅̅ = E[ ̅̅̅̅̅̅ , ̅̅̅̅̅̅ , ̅̅̅̅̅̅ ]
2.3 Motion Modelling Using HOS Descriptor
In order to build a motion descriptor the swarm intelligence is used.
Prey Generation
The prey that is tracked by the swarm comprises of OF magnitude values of pixels lying inside ROIs, instead of their luminance. In this system number of prey in each frame varies is equivalent to the number of ROIs in the frame. The pixels of each ROI region are considered sequentially to form a prey for a ROI in m frames. The pixel in a particular ROI of frame j has OF magnitude equal to Oij , where 1 ≤ i ≤ n and 1 ≤ j ≤ m. In order to perform ithpixel’s OF consecutively over time for prey construction.
The prey position is determined by using OF magnitude as follows
= O
Where,
t- Spatiotemporal index
In order to capture significant temporal information the sequence of pixel selection is important factor. The swarm will track for all pixels 1, . . . ,nmin each ROI region as follows
[O , . . . , O . . . , O , . . . , O ],
Where,
Pavithra M et al, International Journal of Computer Science and Mobile Applications, Vol.4 Issue. 6, June- 2016, pg. 70-79 ISSN: 2321-8363
Impact Factor: 4.123
Extraction of Forces
The agents are groups which used to track the prey and differentiate its state. The agents are located randomly. Based on the agent-prey forces, agent-to-agent forces and friction forces the positions changedover time. The interaction force Fneigh is theinteraction force which is estimated between agent i andall other agents of the
swarm found in the neighbourhood of i,at a distance smaller than ρ.
F ∑
Where,
- Interaction force between each agent i and all other agents j of the swarm
Define each agent i ’s position at t as x (t), so F (i, j, t) is:
Where,
d(i, j ) - distance between agents i and j
xi(t − 1) - previous position of agent i
α, β - weighting parameters set equal to 1
Ffricis the velocity dependent friction force. It depends on the velocity the agentformerly had, corresponding to
the previous prey location t−1:
F (i, t) = −μ ・˙ x (t − 1)
Where,
x (t − 1)-former velocity of agent i .
Final swarm is formed as
F (i, p, t) = λ ・(x (t − 1) – x (t − 1)).
HOS Descriptor
The evolution of the agents’ positions and forces affecting the agents are observed to form a HOS descriptor. Due to the insertion of elementary parameter γthe newtonsecond law of motion is modified, the parameter γ takes into account the previous velocity values.
̈ (t) = (γ − 1) ̇ (t − 1) + F (i, t) + F (i, t) + F (i, p, t)
As a result of the forces, the swarm followsaccelerated motion and the velocity of agent i at location xi is:
Pavithra M et al, International Journal of Computer Science and Mobile Applications, Vol.4 Issue. 6, June- 2016, pg. 70-79 ISSN: 2321-8363
Impact Factor: 4.123
Where
δ- Time step parameter
The flow values are changing slowly over space and time. The agents positions are incessantly updated and their new valuesare given for each spatiotemporal location t by the following equation:
x (t) = x (t − 1) + δ ・˙x (t − 1) + 1 2 x¨ ̈ (t) δ
Where,
δ-timestep parameter
Swarm agents’ positions are arbitrarily produced for the first prey position t = 0, and their speeds and accelerations are originally set to zero.
During training, ROIs are extracted and thepixel OF in them is examined and tracked by the agents.We then compute the average of swarm agents’ positionsof aboveequation for each t, and follow a process similar to theHOG extraction to extract weighted histogramsof agents’ positions (HOS), according to the corresponding OF orientation.
ANOMALY DETECTION AND LOCALIZATION
In order to detect anomaly Appearance and motion descriptors are merged to form the final descriptor.
f = { ̅̅̅̅̅̅ , ̅̅̅̅̅̅ , . . . , ̅̅̅̅̅̅ , ̅̅̅̅̅̅̅ }
Here, ̅̅̅̅̅̅m−2,mis the average of HOG histograms corresponding to a block for frames m −2 to m and
̅̅̅̅̅̅m−2,m is the average of the corresponding HOS histograms taken from Eq. (1). The overall process takes
place in each ROI. A normalization step takes place to form the final descriptor so as to achieve scale invariance.
To measure each region normality Support Vector Machine (SVM) is used. The Support Vector Data Description (SVDD) method of was chosen, as it is known to be best suited for outlier detection. According to this approach, spherical boundaries are used instead of planar ones around the provided data of the training set. The goal is to enclose nearly all n training examples in a hypersphere with center o and the smallest possible radius R, with the outliers lying outside this sphere. Thus, its purpose is to minimize the function:
Min ( + c∑ ̇ )
subject to|| -O|| ≤
In order to create a soft margin and allow for outliers in the training set, slack variables ˙ξiand a penalty parameter C describe the hypersphere. By using Lagrange multipliers to solve Eq.(13), subject to Eq.(14), with a Gaussian kernel, we conclude that a new “test object” z is accepted when:
|| -O|| = ∑ | |
)>- +
Pavithra M et al, International Journal of Computer Science and Mobile Applications, Vol.4 Issue. 6, June- 2016, pg. 70-79 ISSN: 2321-8363
Impact Factor: 4.123
method is capable of dealing with non-uniformly moving and evolving crowds, as the descriptors are examined and characterized separately in each ROI. It can accurately localize different anomalies in a wide range of videos, from human crowds to traffic.
LBP-TOP DESCRIPTOR
The proposed system introduced a novel detection mechanism for detect and localize the anomalies in Crowded Environments. Here the histogram of Local Binary Patterns from Three Orthogonal Planes (LBP-TOP) is more suitable to represent dynamic texture. In a time window of each frame average triplets of HOG, HOS and LBP-TOP are consecutively computed.
LBP-TOP based dynamic texture
The textureT is joint distributionof intensities from the nine pixels in a 3×3 neighbourhood
T = p(g0, g1, g2, g3, g4, g5, g6, g7, g8),
where
gi(i= 0, ..., 8) – intensities of the pixels
Based on the sign of the differences, gray scale invariant local binary pattern (LBP) is computed.
LBP = ∑
Where,
S(x) = { }
The volume LBP (VLBP) is definedas the joint distribution of the intensities of 3 × P +3pixels on the current frame, tc, the previous frame, tc− L,and the next frame, tc+ L in,
VLBP ( = ∑
Where
P -number of neighbours in each frame
L -temporal interval,
gq- neighbour pixels’intensities
gc- centre pixel intensity.
Pavithra M et al, International Journal of Computer Science and Mobile Applications, Vol.4 Issue. 6, June- 2016, pg. 70-79 ISSN: 2321-8363
Impact Factor: 4.123
into spatio-temporal patches. Within eachpatch, LBP-TOP is extracted. In each plane we use the 8pixel neighbourhood. As a result, each plane contains 28local binary patterns. Among the three planes, XY containsrich appearance features. XT and YT contain the motionfeatures with limited appearance features. Only the XT and YT are considered in our application tomake it robust to human appearance. The size of the histogramin our application is 28 ×2 = 512 bins.
Classification
Then, these features are passed as an input to classifier. Here proximal support machine is used for classification. Proximal Support Vector Machine is based on Support Vector Machine, it is simpler and faster than traditional Support Vector Machines algorithm, which is especially suitable for large amounts of data or image classification and operations.
Classification is computed between normal pattern and abnormal pattern. Here proximal support vector machine classifier is used for classification process.
On assumption that there are N training samples, such as,( ) ( ) …( ) among them , so the target function of Proximal Support Vector Machine can be denoted by
Min + ( )
Subject to : L(Aw –er )+ y =e
C represented as castigation factor, y denote the sample output, w figure the normal vector of the classification hyperplane, e denoted as units vector, g is the parameter which can ascertain the position of two dividing-line plane relating to the origin in Proximal Support Vector Machine; A represent the n×m dimensional training data set, each sample is corresponding to a list .
It can accurately localize different anomalies in a wide range of videos, from human crowds to traffic.
Experimental results
In our experiment, we are analyzes and compares the performance of SVM based anomaly detection and LBP-TOP-PSVM based anomaly detectionapproaches in terms of accuracy, precision and recall.
1. Accuracy comparison
Accuracy is evaluated as,
Pavithra M et al, International Journal of Computer Science and Mobile Applications, Vol.4 Issue. 6, June- 2016, pg. 70-79 ISSN: 2321-8363
Impact Factor: 4.123
Figure .1 Accuracy comparisons
We analyze and compare the performance offered by various methods for anomaly detection. In this graph, x axis will be the two approaches of anomaly detection and y axis will be accuracy in %.From the graph see that, accuracy of the proposed LBP-TOP-PSVM based anomaly detectionis increased somewhat compared with SVM based anomaly detection.
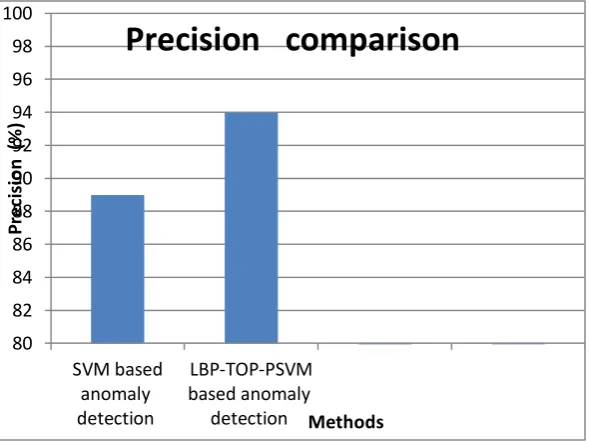
2. Precision
Precision value is determined based on the retrieval of information at true positive prediction, false positive. In healthcare data precision is determined the percentage of positive outcome returned that are relevant.
Precision =TP/ (TP+FP)
Figure .2 Precision comparisons
80 82 84 86 88 90 92 94 96 98 100 SVM based anomaly detection LBP-TOP-PSVM based anomaly detection P rec is io n ( % ) MethodsPrecision comparison
80 82 84 86 88 90 92 94 96 98 100 A cc u ra cy (% ) MethodsPavithra M et al, International Journal of Computer Science and Mobile Applications, Vol.4 Issue. 6, June- 2016, pg. 70-79 ISSN: 2321-8363
Impact Factor: 4.123
We analyze and compare the performance offered by various methods for anomaly detection. In this graph, x axis will be the two approaches of anomaly detection and y axis will be precision in %.From the graph see that, precision of the proposed LBP-TOP-PSVM based anomaly detection is increased somewhat compared with SVM based anomaly detection.
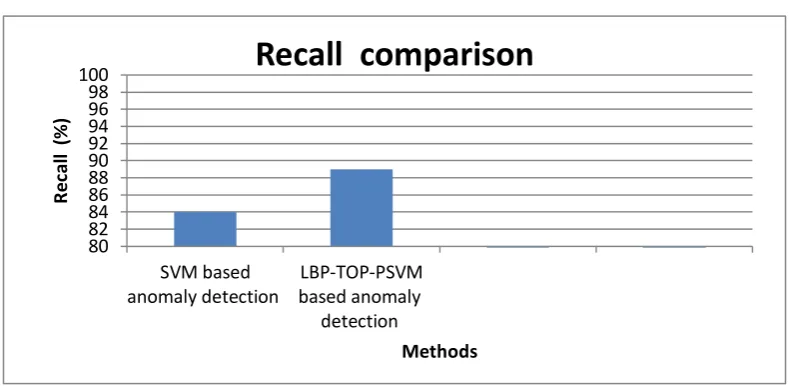
3. Recall
Recall value is determined based on the retrieval of information at true positive prediction, false negative. Recall in this context is also referred to as the True Positive Rate. In that process the fraction of relevant instances that are retrieved.
Recall =TP / (TP+FN)
Figure .3 Recall comparisons
We analyze and compare the performance offered by various methods for anomaly detection. In this graph, x axis will be the two approaches of anomaly detection and y axis will be Recall in %.From the graph see that, Recall of the proposed LBP-TOP-PSVM based anomaly detection is increased somewhat compared with SVM based anomaly detection.
Conclusion
The proposed system introduced a new detection mechanism for detect and localize the anomalies in Crowded Environments. Here the histogram of Local Binary Patterns from Three Orthogonal Planes (LBP-TOP) is used forrepresent the dynamic texture. In a time window of each frame average triplets of HOG, HOS and LBP-TOP are consecutively computed. Then, these features are passed as an input to classifier. Here proximal support machine is used for anomaly classification. The experimental results show that the proposed system achieves better performance compared with existing system.
80 82 84 86 88 90 92 94 96 98 100
SVM based anomaly detection
LBP-TOP-PSVM based anomaly
detection
R
e
ca
ll
(%
)
Pavithra M et al, International Journal of Computer Science and Mobile Applications, Vol.4 Issue. 6, June- 2016, pg. 70-79 ISSN: 2321-8363
Impact Factor: 4.123
References
[1] Anil M. Cheriyadat and Richard J. Radke, “Detecting Dominant Motions in Dense Crowds “IEEE Journal of special topics in signal processing, 2010.
[2] VagiaKaltsa, Alexia Briassouli , IoannisKompatsiaris, Michael G. Strintzis, “Swarm-based motion features for anomaly detection in crowds”, 2014.
[3] Ravi Ranjan and G. Sahoo, “A New clustering approach for anomaly intrusion detection“ International Journal of Data Mining & Knowledge Management Process (IJDKP) Vol.4, No.2, March 2014.
[4] Amin Karamia,n, ManelGuerrero-Zapata,” A fuzzy anomaly detection system based on hybrid PSO-Kmeansalgorithmincontent-centricnetworks”, Elsevier 2014.
[5]Ibrahim Aljarah and Simone A. Ludwig,” MapReduce Intrusion Detection System based on aParticle Swarm Optimization Clustering Algorithm”, IEEE Congress on Evolutionary Computation, June 20-23, 2013.
[6] SeyedMojtabaHosseiniBamakan.a,b, BehnamAmiric, MahboubehMirzabagherib,Yong Shia , “A New Intrusion Detection Approach using PSO based MultipleCriteria Linear Programming”, Information Technology and Quantitative Management (ITQM 2015).
[7]FangjunKuang · Siyang Zhang · Zhong Jin · WeihongXu, “A novel SVM by combining kernel principal component analysis and improved chaotic particle swarm optimization for intrusion detection”, 2014.