Analytical method development and validation for simultaneous estimation of fluvastatin sodium and valsartan by RP-HPLC technique
6
0
0
Full text
(2) Prakash Sarigomula. et al., Int. J. Pharm & Ind. Res., Vol.–03 (02) 2013 [152 - 157]. competitively inhibited by FVS4. Resulting decreased hepatic cholesterol synthesis and upregulates LDL receptor synthesis increasing LDLC clearance from plasma into liver cells and increase in HDL. VAL is chemically(2S)-3-methyl2-[N-({4-[2-(2H-1,2,3,4tetrazol5yl)phenyl]phenyl} methyl) pentanamido] butanoic acid3. Valsartan competitively and selectively inhibits the action of angiotensin II at the AT1 receptor subtype which is responsible for most of the known effects of angiotensin II6. Hence the proposed method is significant to apply in future dosage forms either by Pharmaceutical Industry and scientific community.. Materials and methods Chromatographic separation was carried out on HPLC make WATERS with auto sampler, HPLC injecting syringe (20µl) Hamilton, the equipment was configured to PC work station with Empower2 software, reference standards of FVS and VAL were obtained a gift sample form MSN labs, Hyderabad and used as such, the tablet dosage form as Lescol XL-80mg & Diovan-160mg purchased at local Community Pharmacy. All the chemicals and reagents used were of HPLC grade or analytical reagents grade purchased from Qualigens, Merck (CHEMICALS) Mumbai, India.. Experiment and results Optimized chromatographic condition Stationary phase columns: ODS-X Terra, C18 column (250mm* 4.6mm), 5µm Mobile phase : Acetonitrile: Buffer (potassium dihydrogen ortho phosphate (pH-5) in the ratio of 60:40 (%v/v). Detector wave length : 237 nm Injection volume : 20µl Flow rate : 0.7ml/min Temperature : Ambient Preparation of solutions Construction of calibration curve Standard stock solution of FVS and VAL were prepared separately in 10ml of mobile phase to get the concentration of 1000mcg/ml respectively. From the standard stock solution of drugs, different dilutions were prepared, injected and their peak area was measured and calibration curve were constructed.. 153. Physical mixture From the standard stock solution of the drugs, physical mixture containing FVS and VAL in the ratio of 0.2:0.4, 0.3:0.6, 0.4:0.8, 0.5:1 & 0.6:1.2 respectively were prepared and the results were given in table-02. Sample preparation Average weight of the tablet was determined by weighing 20 tablets. The tablets were crushed to a fine powder and amount equivalent to 10mg of FVS and VAL were weighed and transferred to 10ml volumetric flask separately, dissolve in about 5ml of mobile phase by sonication for 15 min and make up to the volume with mobile phase. The solution was filtered and was further diluted with mobile phase to get the final concentration of 40mcg/ml for FVS and 80mcg/ml for VAL, the resulting solution was injected for quantitive analysis. The FVS and VAL was calculated by using the calibration curve-regression equation; the results are reported in table-01.. Validation of developed method Specificity/selectivity To evaluate the specificity, solutions of FVS, VAL and placebo are prepared individually, were injected in to the system and it was observed that FVS and VAL peaks were well separated and there was no interference with placebo. (fig-02) System suitability Solution containing both FVS and VAL in the mobile phase was injected and the system suitability parameters were determined. The results are given in table-03. Linearity & range Linearity was evaluated from the calibration curve data and linear response was observed between 20 to 60mcg/ml for FVS and 40 to 120mcg/ml for VAL with a correlation co-efficient of 0.999 for FVS and 0.999 for VAL. Regression equations were constructed for both the drugs and are given below: YFVS=69501XFVS+25344(r2=0.999) YVAL=63638XVAL+93860(r2=0.999) Where YFVS and YVAL are response (peak area) for FVS and VAL respectively XFVS and XVAL are the concentration of FVS and VAL respectively.. www.ijpir.com.
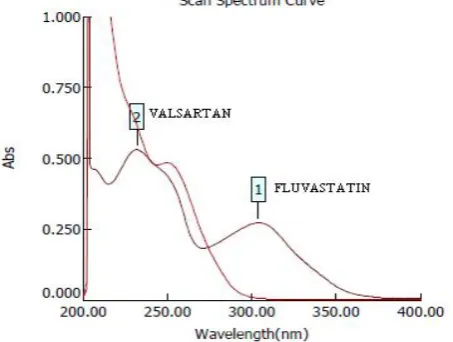
(3) 154. Prakash Sarigomula. et al., Int. J. Pharm & Ind. Res., Vol.–03 (02) 2013 [152 - 157]. Accuracy Accuracy of method developed was confirmed by performing recovery study at three different concentration levels 50%, 100% and 150% each in triplicate. The result of accuracy study is reported in table-04. Precision The tablet formulation was analysed for the content of FVS and VAL injected three times on the same day to determine intra day precision and analysed on three different days to determine inter-day precision. The results are given table-05. Limit of detection and limit of quantification The proposed method was estimated in terms of limit of quantification (LOQ) and the lowest concentration detected under the chromatographic conditions as the limit of Detection (LOD). The LOD and LOQ were calculated by the equation LOD=3.3*N/B and LOQ=10*N/B where N is the standard deviation of the peak areas of the. corresponding drug sample, taken as the measure of the noise, and B is the slope of the corresponding calibration plot as the measure of the signal. The LOD was found to be 3.01mcg/ml, 2.99mcg/ml for FVS and VAL respectively where as the LOQ was found to be 10.0mcg/ml, 9.99mcg/ml for FVS and VAL respectively. Robustness Robustness was established in a triplicate by analyzing system suitability of standard and sample at flow rates of 0.6 and 0.8ml/min (nominal flow rate 0.7ml/min) and pH 4 and 5.5 (nominal pH 5) and different organic solvent percentage (ACN:Buffer) 30:70 and 50:50 (nominal organic solvent percentage 60:40). The results are reported in table-06,07 & 08.. Fig. 01: Overlain U.V spectra of FVS and VAL. Fig. 02: Chromatogram of placebo. www.ijpir.com.
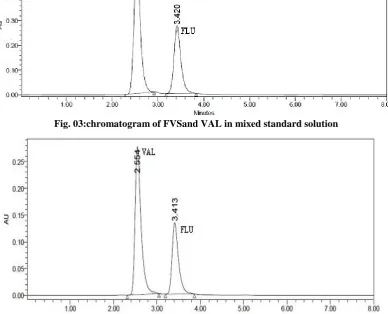
(4) Prakash Sarigomula. et al., Int. J. Pharm & Ind. Res., Vol.–03 (02) 2013 [152 - 157]. 155. Fig. 03:chromatogram of FVSand VAL in mixed standard solution. Fig. 04: chromatogram of FVSand VAL in sample solution Table No. 01: assay of tablet formulation Replicate 1 2 3 4 5 6 SD %RSD SE. amount found(mg) FVS VAL 80.20 79.92 79.20 79.12 78.32 80.20 78.40 79.84 78.96 79.36 79.84 79.20. %label claim FVS VAL 100.25 99.90 99.00 98.90 97.90 100.25 98.00 99.80 98.70 99.20 99.80 99.00 0.946 0.549 0.956 0.551 0.549 0.245. Label claim: FVS 80mg/tablet & VAL 160mg/tablet, SD: standard deviation, %RSD: relative standard deviation, SE: standard error Table No. 02: linearity results of standard drug S. no 1 2 3 4 5. FVS (conc) VAL (conc) 20 40 30 60 40 80 50 100 60 120 Correlation coefficient. FVS (area) 1387035 2106996 2882231 3470152 4180508 0.999. www.ijpir.com. VAL (area) 2602344 3914138 5291958 6385532 7730420 0.999.
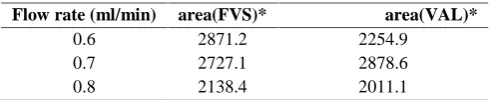
(5) 156. Prakash Sarigomula. et al., Int. J. Pharm & Ind. Res., Vol.–03 (02) 2013 [152 - 157]. Table No. 03: system suitability parameters Property Retention time Tailing factor Capacity factor No of theoretical plates Resolution. FVS 3.413 1.4 2.062 2714.8 3.2. VAL 2.554 1.4 2.357 2840.8 2.3. Table04: Recovery studies Drug 50%. 100%. 150%. Amount added (mg) FVS VAL 4.90 4.95 4.91 4.88 4.81 4.90 9.80 9.90 9.77 9.79 9.88 9.81 14.8 14.2 14.6 13.9 14.7 14.1. Amount found (mg) FVS VAL 4.81 4.88 4.92 4.95 4.91 4.88 9.77 9.79 9.88 9.81 9.80 9.82 14.6 13.9 14.8 14.1 14.9 14.2 Mean % COV. % recovery FVS VAL 98.1 98.50 100.2 101.40 102.0 99.59 99.6 98.80 101.1 100.20 99.1 100.10 98.6 97.80 101.3 101.40 101.3 100.70 100.14 99.83 1.366 1.271. Table No. 05: Intra day & inter day precision. Day - I. Day - II. Day - III. Amount found (mg) FVS VAL 80.20 79.92 79.20 79.12 78.30 80.20 78.40 79.84 78.96 79.36 79.84 79.20 79.20 79.12 78.32 80.20 79.84 79.20 Mean %COV. %label claim FVS VAL 100.25 99.90 99.00 98.90 97.90 100.25 98.00 99.80 98.30 99.20 99.80 99.00 99.00 98.00 97.90 100.25 99.80 99.00 98.92 99.35 0.776 0.746. Label claim: FVS 80mg/tablet and VAL 160mg/tablet, SD: standard deviation, %COV: coefficient of variance Table No. 06: Robustness for organic solvent strength (ACN:Buffer) Ratio (ACN:Buffer) 30:70 50:50 60:40. area(FVS)* 355.53 1173.98 2727.10. area(VAL)* 640.16 1335.99 2878.60. *mean of three readings. Table No. 07: Robustness for pH studies pH 4 5 5.5. area(FVS)* 1173.9 2727.1 1235.0. area(VAL)* 1335.0 2879.9 1326.0. *mean of three readings. Table No. 08: Robustness for flow rate studies Flow rate (ml/min) 0.6 0.7 0.8. area(FVS)* 2871.2 2727.1 2138.4. *mean of three readings.. www.ijpir.com. area(VAL)* 2254.9 2878.6 2011.1.
(6) Prakash Sarigomula. et al., Int. J. Pharm & Ind. Res., Vol.–03 (02) 2013 [152 - 157]. Discussion HPLC method development preliminary study for column selection revealed that C18 column gave a better resolution and run time than C8 column hence C18 column was selected as stationary phase. Mobile phase and flow rate selection was based on the peak parameters (height, area, tailing, theoretical plate count, capacity factor and resolution) and run time. Good separation could obtained by use of 60:40v/v ratio of acetonitrile: buffer pH-5 (potassium dihydrogen ortho phospophate) with flow rate of 0.7 ml/min. U.V spectrum of FVS exhibited absorption maximum at about 305 nm, where as VAL exhibited absorption maximum at about 250 nm, considering the absorptivity of the drug and their relative quantity in formulation, 237nm was selected as detector wavelength. From the overlain UV spectra at (shimadzu-1700), suitable wavelength considered for monitoring the drug was 237nm. (fig-01) under the optimized chromatographic condition the drug peaks are well separated and there was no interfering peaks from placebo (fig-02), thus the method has accquired specificity. The retention time obtained for FVS and VAL were 3.5 and 2.5, respectively as shown in (fig-03&04). The capacity factor, tailing factor, theoretical plates count and resolution are within the acceptance criteria table03. From the physical mixture analysis, the calibration curve results were found to be within the range of acceptance i.e. as mentioned in linearity of standard drug in table-02. The mean recovery was 98.1-101.3% and 97.8101.4% for FVS and VAL respectively which confirms the accuracy of method the statistical results were found to be within the range of acceptance i.e % COV (table-04). Small changes in the experimental parameters did not affect the chromatographic behavior hence the method is robust at different parameters as in table-06, 07 &08.. Conclusion. 157. time are relatively short, i.e, 3.5 and 2.4min for FVS and VAL respectively. The method developed was specific, accurate, precise and robust by proven validated results which are reliable and reproducible. This enables rapid determination of any samples of FVS & VAL in routine quality control analysis of tablet formulations. Hence the proposed method can be applied by pharmaceutical industry and scientific community to analyze tablet formulation containing FVS and VAL on RPHPLC technique.. References 1. Clinical trilals.gov; Identification no: NCT00171327; Efficacy and Safety of Fluvastatin 80 mg or Valsartan 160 mg and Their Combination in Dyslipidemic Patients With Arterial Hypertension and Endothelial Dysfunction. 2. Liangdi et al., Effects of fluvastatin on vascular endothelium dependent vasodilatation function in hypertensives 2003, Am J Hypertens (2003) 16, 149A–149A 3. www.drugbank.com. 4. Pharmacology: action of statins 5th edition by H.P Rang & M.M Dale, page-310. 5. Ivo Abraham et al.., Real-world effectiveness of valsartan on hypertension and total cardiovascular risk: review and implications of a translational research program, Kidney Int 2002; 61:387–395. 6. Della Grace Thomas.., A validated stability indicating HPLC method for the determination of Valsartan in tablet dosage forms. Journal of Applied Pharmaceutical Science 01 (04); 2011: 97-99 7. Bhatia M et al.., Determination and validation of valsartan and its degradation products by isocratic HPLC, J. Chem. Metrl. 3:1 (2009) 112. 8. J.Saminathan et al ..,Validated RP-HPLC method for fluvastatin sodium in bulk and its dosage form, Journal of Pharmaceutical Sciences and Research, /J. Pharm. Sci. & Res. Vol.1(3), 2009, 90-96. 9. Bodela Narendra Reddy et al.., RP-HPLC method development and validation of Valsartan tablet dosage form, J. Chem. Pharm. Res., 2010, 2(4):878-886.. A new, simple, rapid, isocratic RP-HPLC method has been developed for simultaneous analysis of FVS and VAL in tablet formulations. As retention. www.ijpir.com.
(7)
Figure
Related documents
A substitution is a mapping from term variables to terms, from sequence variables to sequences, from function vari- ables to functors and from context variables to contexts,
AGDL: Agglomerative clustering on a directed graph; AGMFit: Affiliation graph model fitting; CD: Community discovery; CDlib: Community discovery library; CDTB: Community
attenuated virus, as it is clear from the tissue culture studies that this virus replicates well; direct comparisons in which the two isolates are used to infect a compatible cell
At a time when research is promoted as a core activity within national health care systems, it is ironic that the bureaucratic complexity of research governance in the United
Prenatal signs typically associated to PCH were reported in 10 children: microcephaly was detected in 4 children by cranial ultrasound at a gestational age between 32 and 35 weeks, in
This study was conducted to examine the difference in shape of male and female upper and lower dental arches, as well as the difference in their transversal and longitu- dinal
In this paper we describe how a participatory, multi- method, continuous informed consent process developed by researchers, study participants and community stake- holders during
• The cattle that showed clinical signs before day 16 (early cases) stayed for a long time in the herd, and were culled only after a few days, while cattle that became sick later
