824
Copyright © 2011-15. Vandana Publications. All Rights Reserved.
Volume-5, Issue-3, June-2015
International Journal of Engineering and Management Research
Page Number: 824-831
An Analysis of Non- Performing Assets of Commercial Banks in India
Dr.N.Nagaraja1, Naveen Kumar P2
1Associate Professor, DoS in Commerce, University of Mysore,Manasagangotri, Mysore, INDIA 2
Assistant Professor, BET Academy of Higher Education, Bharathinagar, Mandya, INDIA
ABSTRACT
Banking sector is one of the constituents of financial system of the nation. Economy sustenance can be measured based on the sustenance of the banking sector of a particular nation and the prosperity of the nation’s economy depends on the banking system. Here, in the banking system a perspective Non Performing Assets (NPAs), this has been threatening the harmony of the banking system operations. At present NPA in the banking sector is debate topic because NPA is increasing year by year particularly in nationalized banks The Gross Non-Performing Assets (GNPAs) of Nationalized Banks as on June 2012 were Rs.73,038 crore which amount to 2.94% of Gross Advances. Since, the banks are acting like a agent between the savers and the seekers they should be very cautious in channelizing deposits to needy people as loans and advances. In this study researcher has made an attempt to analysis the Non Performing Assets of the Commercial banks of India for a period of fifteen years starts from 1996-97 to 2011-12. Findings of the study reveal that year by year NPAs of Commercial Banks are increasing and many internal and external factors are insisting the growth of NPAs in this sector. Researchers suggest to take corrective actions to get control over the NPAs of commercial Banks.
Keywords---- Banking Sector, Gross NPAs, Net NPAs.
I.
INTRODUCTION
A Non-performing asset (NPA) is defined as a installment ofhas remained ‘past due’ for a specified period of time. In India NPA is defined as an asset, including a leased asset, becomes non-performing when it ceases to generate income for the bank. A ‘Non-Performing Asset’ (NPA) was defined as a credit facility in respect of which the interest and/ or installment of principal has remained ‘past due’ for a specified period
of time. The specified period was reduced in a phased manner as under:
With a view to moving towards international best practices and to ensure greater transparency, it has been decided to adopt the ‘90 days’ overdue’ norm for identification of NPAs, from the year ending March 31, 2004. Accordingly, with effect from March 31, 2004, a non-performing asset (NPA) shall be a loan or an advance where;
i. interest and/ or instalment of principal remain overdue for a period of more than 90 days in respect of a term loan,
ii. the account remains ‘out of order’ for a period of more than 90 days, in respect of an Overdraft/Cash Credit (OD/CC),
iii. the bill remains overdue for a period of more than 90 days in the case of bills purchased and discounted, iv. interest and/or instalment of principal remains overdue for two harvest seasons but for a period not exceeding two half years in the case of an advance granted for agricultural purposes, and
v. any amount to be received remains overdue for a period of more than 90 days in respect of other accounts.
II.
REVIEW OF LITERATURE
In this part some of the literatures related to the present study selected from the plethora literatures have been presented.
825
Copyright © 2011-15. Vandana Publications. All Rights Reserved.
as an indicator showing the credit risks & efficiency ofallocation of resource. NPA involves the necessity of provisions, any increase in which bring down the overall profitability of banks. An excessive rise in interest rates over the past 18 months has led to a sharp increase in non-performing assets. This not only affects the banks but also the economy as a whole. This paper deals with understanding the concept of NPA, the causes and overview of different sectors in India.
Over the few years Indian banking, attempts to integrate with the global banking has been facing lots of hurdles in its way due to certain inherent weakness, despite its high sounding claims and lofty achievements. In a developing country, banking is seen as an important instrument of development, while with the demanding Non-Performing Assets (NPAs), banks have become burden on the economy. Non-Performing Assets are not merely non remunerative, but they add cost to the credit Management. The fear of Non-Performing Assets permeates the psychology of bank managers in entertaining new projects for credit expansion. Non-Performing Assets is not a dilemma facing exclusively the bankers; it is in fact an all pervasive national scourge swaying the entire Indian economy. Non Performing Asset is a sore throat of the Indian economy as a whole. Non Performing Assets have affected the profitability, liquidity and competitive functioning of banks and developmental of financial institutions and finally the psychology of the bankers in respect of their disposition towards credit delivery and credit expansion. NPAs do not generate any income for the banks, but at the same time banks are required to make provisions for such NPAs from their current profits. Apart from internal and external complexities, increases in NPAs directly affects banks' profitability sometimes even their existence.
Meeker Larry G. and Gray Laura (1987) in 1983, the public was given its first opportunity to review bank asset quality in the form of non-performing asset information. The purpose of this study is to evaluate that information. A regression analysis comparing the non-performing asset statistics with examiner classifications of assets suggests that the non-performing asset information can be a useful aid in analyzing the asset quality of banks, particularly when the information is timely.
PaulPurnendu , Bose,Swapan and Dhalla, Rizwan S.(2011) In this paper we attempt to measure the relative efficiency of Indian PSU banks on overall financial performances. Since, the financial industry in a developing country like India is undergoing through a very dynamic pace of restructuring, it is imperative for a bank to continuously monitor their efficiency on Non-Performing Assets, Capital Risk-Weighted Asset Ratio, Business per Employee, Return on Assets and Profit per Employee. Here, Non-Performing Assets is a negative financial indicator. To prove empirically, we propose a framework to measure efficiency of Indian public sector banks.
Veerakumar, K.(2012) The Indian banking sector has been facing serious problems of raising Non-Performing Assets (NPAs). Like a canker worm, NPAs have been eating the banking industries from within, since nationalization of banks in 1969. NPAs have choked off quantum of credit, restriction the recycling of funds and leads to asset-liability mismatches. It also affected profitability, liquidity and solvency position of the Indian banking sector. One of the major reasons for NPAs in the banking sector is the 'Direct Lending System' by the RBI under social banking motto of the Government, under which scheduled commercial banks are required to lend 40% of their total credit to priority sector. The banks who have advanced to the priority sector and reached the target suffocated on account of raising NPAs, since long. The priority sector NPAs have registered higher growth both in percentage and in absolute terms year after year. The present paper is an attempt to study the priority sector advances by the public, private and foreign bank group-wise, target achieved by them and a comparative study on priority and non-priority sector NPAs over the period of 10 years between 2001-02 and 2010-11. This paper also aims to find out the categories of priority sector advances which contribute to the growth of total priority sector NPAs during the period under study.
Murthy, K. V. Bhanu Gupta, Lovleen.(2012) One of the major reasons cited for this state of health of banking industry has been the persistence of 'Non-performing Assets' (NPAs). In this study the focus is on the impact of liberalization on the non-performing assets of the four banking segments, namely, public sector, old private sector, new private sector and foreign banks by studying the overall trends in NPAs. We have used the Structure- Conduct-Performance (S-C-P) approach that shows the relationship between competition and conduct, concentration and growth in NPAS. Our results show that on an average across the banking industry segments, average non-performing assets in the past 11 years have been declining at the rate of 13% p.a. compounded growth rate. The old private sector banks' nonperforming assets have reduced at the rate of 11.98% and that of public sector banks have declined at the rate of 18% and foreign banks at 11.4%. Though new private sector banks and the foreign banks seem to be more efficient but their conduct does not show consistency and stability
826
Copyright © 2011-15. Vandana Publications. All Rights Reserved.
design of CBZ Bank Limited was employed. Interviewsand questionnaires were used to collect data for the study. The paper revealed that external factors are more prevalent in causing non-performing loans in CBZ Bank Limited. The major factors causing nonperforming loans were natural disasters, government policy and the integrity of the borrower.
Toor N.S. (1994) stated that recovery of non-performing as-sets through the process of compromise by direct talks rather than by the lengthy and costly procedure of litigation. He suggested that by constant monitoring, it is possible to detect, the sticky accounts, the incipient sickness of the early stages itself and an attempt could be made to review the unit and put it back on the road to recovery
S.N. Bidani (2002) Non-performing Assets are the smoking gun threatening the very stability of Indian banks. NPAs wreck a bank‟s profitability both through a loss of interest income and write-off of the principal loan amount itself. This is definitive book which tackles the subject of managing bank NPAs in it‟s ent irely, starling right from the stage of their identification till the recovery of dues in such ac-counts.
Debarsh and Sukanya Goyal (2012) emphasized on management of non-performing assets in the perspective of the public sector banks in India under strict asset classification norms, use of latest technological platform based on Core Banking Solution, recovery procedures and other bank specific indicators in the context of stringent regulatory framework of the RBI. Non-performing Asset is an important parameter in the analysis of financial performance of a bank as it results in decreasing margin and higher provisioning requirements for doubtful debts. The reduction of non-per-forming asset is necessary to improve profitability of banks and comply with the capital adequacy norms as per the Basel Accord.3
Kavitha. N (2012), emphasized on the assessment of non-performing assets on profitability its magnitude and impact. Credit of total advances was in the form of doubtful assets in the past and has an adverse impact on profitability of all Public Sector Banks affected at very large extent when non-performing assets work with other banking and also affect productivity and efficiency of the banking groups. The study observed that there is increase in advances over the period of the study.
III.
STATEMENT OF THE PROBLEM
Banks are the major source of financial resources for needy people. Lending capacity of any bank is restricted and depends on quantum of financial resources that a bank has and the capacity of recovering the loans and advances had given to the customers respectively. At the mean while it is important to understand if bank is not having sufficient financial resources in the sense the Bank is miserably fail to recover loans and advances sanctioned to customers,
this leads to NPAs. Hence, it grabs the pivotal importance to address this problem properly.
Reasons for Creation of Non-Performing Assets NPAs result from what are termed “Bad Loans” or defaults. Default, in the financial parlance, is the failure to meet financial obligations, say non-payment of a loan installment. These loans can occur due to the following reasons:
• Usual banking operations /Bad lending practices
• A banking crisis (as happened in South Asia and Japan)
• Overhang component (due to environmental reasons, business cycle, etc.)
• Incremental component (due to internal bank management, like credit policy, terms of credit, etc...)
IV.
OBJECTIVES OF THE STUDY
1. To understand the concept of Non-performing assets (NPA).
2. To study the Non-performing assets at Commercial banks.
3. To find the general reasons for assets to become Non-performing assets.
4. To offer suggestions based on findings of the study.
V.
SCOPE OF THE STUDY
The present study of Non-performing assets is sheds light on a period of fifteen years since from the 1996-97 to 2011-12.
Data Collection
To achieve aforesaid objectives the study is extensively based on the published sources of information such as RBI bulletins, research papers etc. Tools of Data Analysis
827
Copyright © 2011-15. Vandana Publications. All Rights Reserved.
VI.
DATA ANALYSIS
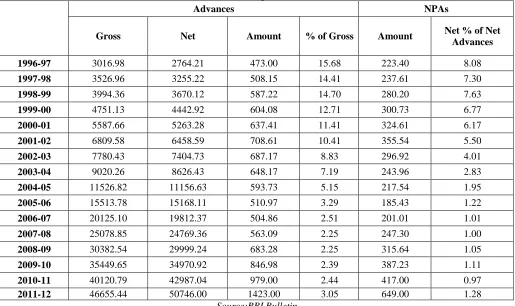
Table No.1.
Table Showing the Gross and Net Advances and NPAs of Scheduled Commercial Banks (Amount in Rupees Billion)
Advances NPAs
Gross Net Amount % of Gross Amount Net % of Net
Advances
1996-97 3016.98 2764.21 473.00 15.68 223.40 8.08
1997-98 3526.96 3255.22 508.15 14.41 237.61 7.30
1998-99 3994.36 3670.12 587.22 14.70 280.20 7.63
1999-00 4751.13 4442.92 604.08 12.71 300.73 6.77
2000-01 5587.66 5263.28 637.41 11.41 324.61 6.17
2001-02 6809.58 6458.59 708.61 10.41 355.54 5.50
2002-03 7780.43 7404.73 687.17 8.83 296.92 4.01
2003-04 9020.26 8626.43 648.17 7.19 243.96 2.83
2004-05 11526.82 11156.63 593.73 5.15 217.54 1.95
2005-06 15513.78 15168.11 510.97 3.29 185.43 1.22
2006-07 20125.10 19812.37 504.86 2.51 201.01 1.01
2007-08 25078.85 24769.36 563.09 2.25 247.30 1.00
2008-09 30382.54 29999.24 683.28 2.25 315.64 1.05
2009-10 35449.65 34970.92 846.98 2.39 387.23 1.11
2010-11 40120.79 42987.04 979.00 2.44 417.00 0.97
2011-12 46655.44 50746.00 1423.00 3.05 649.00 1.28
Source:RBI Bulletin
Figure No.1.
Figure Showing the Gross and Net Advances and NPAs of Scheduled Commercial Banks (Amount in Rupees Billion)
Source: RBI bulletin
Interpretation:
The above figure and table depict the Gross and Net NPAs Scheduled Commercial Banks Scheduled Commercial Banks from 1996-97 to 2011-12. It can be inferred that there is a progress in Gross advance, net advances. But Non Performing Assets rate has been decreasing in the Scheduled commercial banks.
828
Copyright © 2011-15. Vandana Publications. All Rights Reserved.
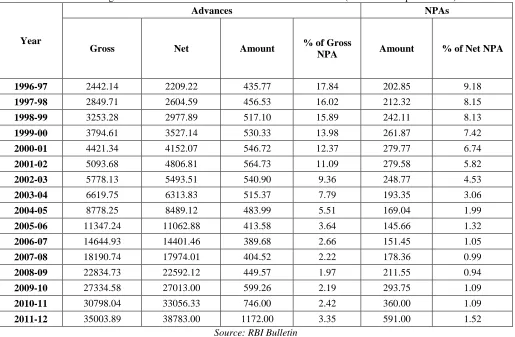
Table showing the Gross and Net NPAs Scheduled Public Sector Banks (Amount in Rupees Billion)Year
Advances NPAs
Gross Net Amount % of Gross
NPA Amount % of Net NPA
1996-97 2442.14 2209.22 435.77 17.84 202.85 9.18
1997-98 2849.71 2604.59 456.53 16.02 212.32 8.15
1998-99 3253.28 2977.89 517.10 15.89 242.11 8.13
1999-00 3794.61 3527.14 530.33 13.98 261.87 7.42
2000-01 4421.34 4152.07 546.72 12.37 279.77 6.74
2001-02 5093.68 4806.81 564.73 11.09 279.58 5.82
2002-03 5778.13 5493.51 540.90 9.36 248.77 4.53
2003-04 6619.75 6313.83 515.37 7.79 193.35 3.06
2004-05 8778.25 8489.12 483.99 5.51 169.04 1.99
2005-06 11347.24 11062.88 413.58 3.64 145.66 1.32
2006-07 14644.93 14401.46 389.68 2.66 151.45 1.05
2007-08 18190.74 17974.01 404.52 2.22 178.36 0.99
2008-09 22834.73 22592.12 449.57 1.97 211.55 0.94
2009-10 27334.58 27013.00 599.26 2.19 293.75 1.09
2010-11 30798.04 33056.33 746.00 2.42 360.00 1.09
2011-12 35003.89 38783.00 1172.00 3.35 591.00 1.52
Source: RBI Bulletin
Figure No.2
Figure showing the Gross and Net NPAs Scheduled Public Sector Banks (Amount in Rupees Billion)
Interpretation:
The above table and figure depict the Gross and Net NPAs Scheduled Public Sector Banks from 1996-97 to 2011-12. There is a progress in Scheduled Public banks’ Gross advance, net advances, and Non Performing Assets has been decreasing.
Table No. 3
Table Showing the Gross and Net Advances and NPAs of Scheduled Private Sector Banks (Amount in Rupees Billion)
Year
Advances NPAs
Gross Net Amount % of Gross Amount Net % of Net
829
Copyright © 2011-15. Vandana Publications. All Rights Reserved.
1996-97 217.02 208.32 23.25 10.71 13.85 6.65
1997-98 255.80 243.53 27.94 10.92 15.72 6.46
1998-99 289.79 260.17 37.84 13.06 23.32 8.96
1999-00 354.04 338.79 38.15 10.78 23.93 7.06
2000-01 397.38 379.73 43.46 10.94 27.71 7.30
2001-02 440.57 422.86 48.51 11.01 30.13 7.13
2002-03 513.29 494.36 45.50 8.86 25.98 5.26
2003-04 579.08 556.48 43.98 7.59 21.42 3.85
2004-05 704.12 677.42 42.00 5.96 18.59 2.74
2005-06 851.54 829.57 37.59 4.41 13.75 1.66
2006-07 948.72 928.87 26.69 2.81 8.91 0.96
2007-08 1134.40 1116.70 25.57 2.25 7.40 0.66
2008-09 1303.52 1285.04 30.72 2.36 11.59 0.90
2009-10 1563.57 1541.36 36.22 2.32 12.71 0.82
2010-11 1872.96 1846.47 36.00 1.92 9.00 0.49
2011-12 2329.18 2301.00 42.00 1.80 13.00 0.56
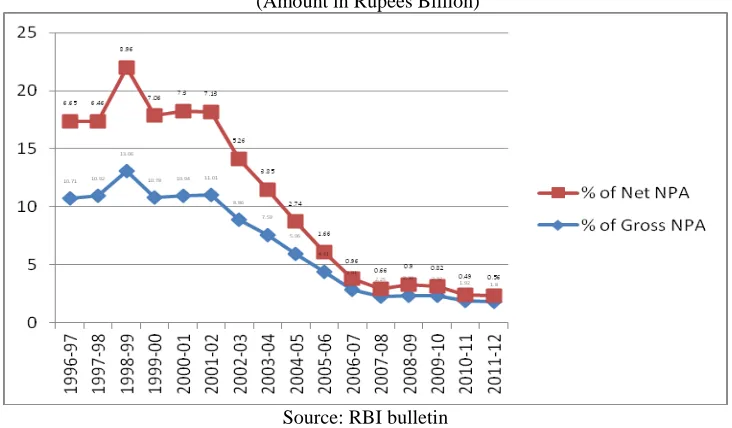
Figure No.3
Figure Showing the Gross and Net Advances and NPAs of Scheduled Private Sector Banks (Amount in Rupees Billion)
Source: RBI bulletin
Interpretation:
The above table and figure depict the gross advances, net advances and NPAs’ of Private Sector Banks in India since 1996-97 to 2011-12. There is a progress in Scheduled Private Sector Banks’ Gross advance, Net advances, and Non Performing Assets has been decreased.
Table No. 4
Table showing the Gross and Net Advances and NPAs of Scheduled Foreign Banks in India (Amount in Rupees Billion)
Advances NPAs
Year Gross Net Amount % of Gross Amount Net % of Net Advances
1996-97 275.25 268.53 11.81 4.29 5.16 1.92
1997-98 309.72 296.52 19.76 6.38 6.66 2.25
830
Copyright © 2011-15. Vandana Publications. All Rights Reserved.
1999-00 374.32 355.43 26.14 6.98 8.55 2.41
2000-01 453.95 430.63 31.06 6.84 7.85 1.82
2001-02 506.31 487.05 27.26 5.38 9.20 1.89
2002-03 541.84 521.71 28.45 5.25 9.03 1.73
2003-04 626.32 605.06 28.94 4.62 9.33 1.54
2004-05 770.26 753.54 21.92 2.85 6.39 0.85
2005-06 989.65 975.62 19.28 1.95 8.08 0.83
2006-07 1278.72 1263.39 22.68 1.77 9.27 0.73
2007-08 1629.66 1611.33 28.59 1.75 12.47 0.77
2008-09 1697.16 1653.85 64.44 3.80 29.96 1.81
2009-10 1674.37 1632.60 71.33 4.26 29.77 1.82
2010-11 1993.21 1955.39 50.00 2.51 12.00 0.61
2011-12 2347.10 2298.00 62.00 2.64 14.00 0.61
Source: RBI Bulletin
Figure No. 4
Figure showing the Gross and Net Advances and NPAs of Scheduled Foreign Banks in India (Amount in Rupees Billion)
Interpretation:
The above table depicts the gross and net NPAs of Foreign Banks in India since 1996-97 to 2011-12. It can be inferred that there is a progress in Gross advance, net advances, and Non Performing Assets has been fluctuating since from 1996-97 to 2011-12 in the Foreign Banks in India.
VII.
CONCLUSION
Banks have been framing rigid rules and regulations for lending year by year and they are monitoring the borrowers constantly, so the NPAs of banks have been decreasing year by year as evidenced in the above analysis. On the other side the though the quantum of loan sanctioned is increasing so far that is very less compare to the previous based on purchasing power of the money. Hence, it seems banks are abstaining from lending to public which is non creditworthy. Since they are under the central bank (RBI) subordinate banks are following the guidelines of the RBI. Finally, as bankers it can be infer the performance of the banks are doing well. As borrower I
thought the banks are following very rigid rules and regulations which cannot be satisfied by the majority of needy customers.
REFERENCES
[1] Chaitanya V Krishna (2004). Causes of Non-performing Assets in Public Sector Banks. Economic Research, 17 (1): 16-30.
[2] King, R G and R Levine (1993). Finance and Growth: Schumpeter Might Be Right. Quarterly Journal of Economic, 108 (3): 717-37.
831
Copyright © 2011-15. Vandana Publications. All Rights Reserved.
conference on Money and Finance in the IndianEconomy, at IGIDR, Mumba
[4] Baiju, S. and Tharril, G.S. (2000), “Performance Banks with Non-performing Assets: An Analysis of NPAs, Yojna, March 2000, PP 5-9.
[8] Satyanarayana, K. & Subrahmanyam, G. (2000), “Anatomy of NPAs of Commercial
Banks, Applied Finance, Volume 6, No.3, July, 2000, pp 14-26.
[9] Ammannaya, K.K. (2004), “ Indian Banking: 2010”, IBA Bulletin, March 2004, P 156
[10] Dash, MK., & Kabra, G. (2010). The Determinants of Non-Performing Assets in Indian Commercial Banks: an Econometric Study, Middle Eastern Finance and Economics, Issue 7 (2010).
[11] Karunakar, M., Vasuki, K., & Saravanan, S. (2008). Are non - Performing Assets Gloomy or Greedy from Indian Perspective?, Research Journal of Social Sciences, 3: 4-12, 2008
[12] Reserve Bank of India, Report on Trend and Progress of banking in India, Various issues, Bombay, India. Reserve Bank of India (2010), Trend and Progress of Banking in India.
[5] Rajaraman, I & Vashistha, G (2002): „Non-Performing Loans of Indian Public Sector Banks -Some Panel Results‟, Economic & Political Weekly, February 13, 2002.
[6] Sudhakar, V.K. (1998), “Managing NPA Menace in Banks”, IBA Bulletin, April 1998, PP 27-30.
[7] Vallabh, G., Mishra, S. and Bhatia, A. (2007), “Non-Performing Assets of Indian Public,
[13] Private and Foreign Sector Banks: An Empirical Assessment”, ICFAI Journal of Bank