Kothuri et al. World Journal of Pharmaceutical and Life Sciences
IMPROVEMENT OF POWER QUALITY OF DISTRIBUTION SYSTEM USING
ANN-LMBNN BASED D-STATCOM
Kothuri Ramakrishna*, Dr. Basavaraja Banakara and Subramanyam P. S.
India.
Article Received on 03/01/2018 Article Revised on 2 4/01/2018 Article Accepted on 14/02/2018
INTRODUCTION
In power utility sector PQ problem is serious concern for consumers. In power distribution system the detection of PQ problems is very much difficult. At consumer premises need to maintain ideal voltage and frequency but supply voltage receiving is deviating from normal voltage. PQ problems affects more seriously to the end user. There PQ problems classified as impulsive transients, oscillatory transients. Impulsive transients occur for small duration of time.osillatary transients occurs for long duration of time, which can damage power line insulators in distribution and transmission systems. Impulsive transients are suppressed by surge arrester. Apart from this there are different types of power quality problems. Short duration power quality problem like voltage sag and voltage swell, which lead to change in magnitude of voltage for small duration of time. Voltage sag leads to tripping of motors and malfunction of its controller and production failures in bulk industries. The voltage swell caused more electrical stress on electrical home appliances. Voltage flickers at consumer premises are another power quality problem due to are lamps and arc furnaces. It is well understood that if we are not maintain certain power quality standards at consumer point of view there will be more loss of production, damage of equipment, to mitigate these PQ issues in distribution system the Custom Power Devices(CPD) are introduced. These CPDs such as DVR, D-STATCOM effectively improves power quality at consumer side. The distribution system suffers from serious power quality disturbances due to nonlinear loads, which drawing harmonic currents from supply mains. D-STATCOM is a suitable CPD to address the
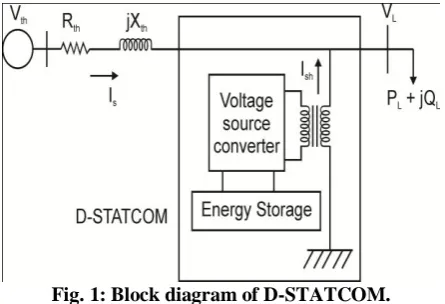
PQ issues of an unbalanced distribution system and efficient device to resolve power quality issues, D-STATCOM consisting of a Voltage Source Converter (VSC) and a shunted DC link capacitor.[9-10] A D-STATCOM is reactive source, generating and absorbing reactive power. In this paper a 13-bus unbalanced distribution system is considered to address power quality problem and a D-STATCOM is connected at bus number 632.
Fig. 1: Block diagram of D-STATCOM.
In section II, D-STATCOM with PI controller is discussed. In section III, DSTATCOM with ANN controller discussed. Simulations results are discussed in section-IV.Conclutions are given in section-V.
World Journal of Pharmaceutical and Life Sciences
WJPLS
www.wjpls.org SJIF Impact Factor: 5.088
*Corresponding Author: Kothuri Ramakrishna
India.
ABSTRACT
In distribution system due to nonlinear loads causes voltage unbalancing lead to Power Quality (PQ) problems such as swell, sag and THD, to mitigate these PQ issues a Levenberg-Marquardt Back propagation (ANN-LMBNN) based D-STATCOM is proposed. The effectiveness of ANN based D-STATCOM is demonstrated on 13-bus distribution system by introducing D-STATCOM at node no-632.The efficacy of D-STATCOM with intelligent controller compared to D-STATCOM with.
Fig. 2: IEEE-13 bus unbalanced distribution system with D-STATCOM.
Conventional Control of D-Statcom
Fig. 3: 13-Bus unbalanced Distribution System with D-STATCOM with PI Control Mechanism.
D-Statcom with Ann Controller
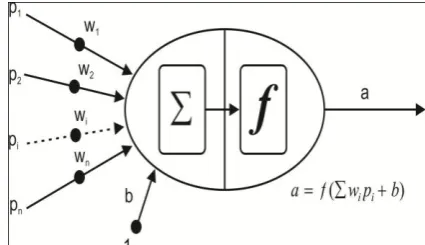
The ANN is a mathematical model composed of simple elements operating in parallel. The ANN function is nothing but connection between the elements, by altering the weights we can train a neural network for particular task.[17]
In Fig-4 shows an artificial neuron with one input and bias is the scalar input transmitted through connections that multiply with scalar weight product of . The summation of all weight becomes and additionally adding bias input The result is the arrangement of transfer function Fig-4, which produces the output .We can get desired output by adjusting weights and bias of the NN.[17]
Fig. 4: An artificial neuron with one input and biases.
Neural networks consisting of different types of architectures the commonly used ANN model are multi layer perception (MLP) and radial bias function (RBF) networks.
A MLP consisting of input layer, hidden layer and output layer. In Fig-5 suffix-i indicates a neuron. Numbers of input neurons are summed at summer and g is an activation function.
Fig. 2: Single node in a Multi-Layer Perceptron network
Output of the ith neuron
= = g[ (1)
The feed forward neural network consisting of input layer, hidden layer and output layer. The training algorithm used is iterative gradient algorithm (trainlm algorithm) to minimize the mean square error between reference signal and actual signal. The input and output at the hidden layer are designated as ynet-j and yout-j respectively. The suffix j indicate jth hidden layer. The input and output layer are designated as Unet and Uout respectively.[19]
(2)
(3) i = 1,2,3,… n.
(4) i = 1,2,3,… n.
(5)
(6)
= means of the weights between the neurons of
input layer and hidden layer.
= weight of ith input layer neuron to the jth hidden
Fig. 7: Structure of ANN.
Neural Network Training Algorithm Levenberg-Marquardt ANN Algorithm
In ANN there are three popular learning algorithms namely Back Propagation Algorithm (BPA), Quasi-newton (trainbfg) and Levenberg-Marquardt (trainlm), the output of the network compared to desired reference target to minimize the error by adjusting the weights and biases.[17] This is the only algorithm which gives best regression accuracy. In this method global error E is defined as.[17]
E=
Where tj is targeted output and is the actual output. This algorithm is a combination of steepest descent method and the Gauss-Newton algorithm.
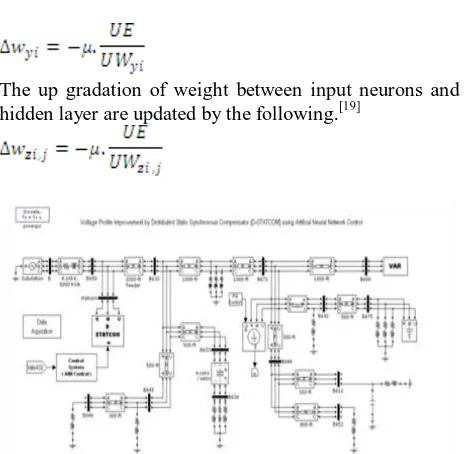
The weight up gradation[19] can be represented by
The up gradation of weight between input neurons and hidden layer are updated by the following.[19]
Fig. 5: 13-Bus unbalanced Distribution System with D-STATCOM with ANN Control Mechanism.
SIMULATION RESULTS
In this work a D-STATCOM with ANN control controller have been proposed to improve power quality
(voltage swell, voltage sag) of 13-bus IEEE distribution system. Simulations are performed using MATLAB SIMULINK.The performance of proposed D-STATCOM with ANN control technique is compared to D-STATCOM with PI control technique.
Fig. 6: Illustrates mitigation of voltage sag of phase-A from source side using D-STATCOM with PI control mechanism.
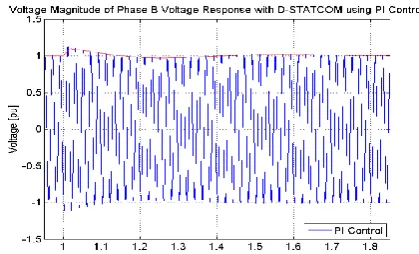
Fig. 7: Illustrates mitigation of voltage sag of phase-B from source side using D-STATCOM with PI control mechanism.
Fig. 9: Illustrates mitigation of voltage sag of phase-A from source side using D-STATCOM with ANN control mechanism.
Fig. 10: Illustrates mitigation of voltage sag of phase-B from source side using D-STATCOM with ANN control mechanism.
Fig. 11: Illustrates mitigation of voltage sag of phase-C from source side using D-STATphase-COM with ANN control mechanism.
Fig. 12: Illustrates mitigation of voltage sag of phase A, B, C from source side using D-STATCOM with PI & ANN control.
Fig. 13: Illustrates mitigation of voltage swell of phase-A from load side using D-STATCOM with PI control mechanism.
Fig. 15: Illustrates mitigation of voltage swell of phase-C from load side using D-STATCOM with PI control mechanism.
Fig. 16: Illustrates mitigation of voltage swell of phase-A from load side using D-STATCOM with ANN control mechanism.
Fig. 18: Illustrates mitigation of voltage swell of phase-C from load side using D-STATCOM with ANN control mechanism.
Fig. 19: Illustrates mitigation of voltage swell of phase A, B, C from load side using D-STATCOM with PI & ANN control.
Table 1: Comparison of power quality parameters when sag occurs in the distribution system.
Voltage sag with different controllers
Phase- A Phase- B Phase- C
Overshoot(sec) %THD Overshoot(sec) %THD Overshoot(sec) %THD
PI controller 18.38 3.02 20.14 5.23 16 5.04
LMBNN-ANN Controller 0.699 1.35 1.8264 1.24 1.84 1.69
Table 2: Comparison of power quality parameters when swell occurs in the distribution system.
Voltage Swell with different controllers Phase A Phase B Phase C
Overshoot %THD Overshoot %THD Overshoot %THD
PI controller 18.3802 6.38 20.1392 6.02 16 3.28
LMBNN- ANN Controller 13.5565 1.19 17.3809 1.07 14.6 0.4
CONCLUSION
In this paper for enhancement of power quality of distribution system a 13- bus system is considered. An ANN control based D-STATCOM is introduced at bus number-632 of 13-bus IEEE test feeder system. The performance of proposed method is compared with PI based D-STATCOM. Simulation results revealed that the proposed intelligent control methodology based D-STATCOM can tackle power quality issues such as voltage sag, voltage swell at all bus considerably. An ANN based D-STATCOM is quite capable of
suppressing voltage swell and voltage sag compared to PI based D-STATCOM.
REFERENCES
2. Nair, D, Nambiar, A. Raveendran, M, Mohan, N.P “Mitigation of power quality issues using DSTATCOM” Emerging Trends in Electrical Engineering and Energy Management (ICETEEEM), International Conference, 2012; 3-15: 65 – 69.
3. Suvire, G.O, San Martin, Argentina, Mercado, P.E, “Improvement of power quality in wind energy applications using a DSTATCOM coupled with a Flywheel Energy Storage System” Power Electronics Conference, COBEP '09. Brazilian, 2009; 58 – 64.
4. Zaveri, T, Bhavesh, B. Zaveri, N, “Control techniques for power quality improvement in delta connected load using D-STATCOM” International, 1397 –1402.
5. K. H. Kuypers, R. E. Morrison and S. B. Tennakoon, “Power Quality Implications Associated with a Series FACTS Controller,” IEEE Harmonics and Quality of Power, 2000; 1: 176-181.
6. Akwukwaegbu I. O, Okwe Gerald Ibe, “Concepts of Reactive Power Control and Voltage Stability Methods in Power System Network” IOSR Journal of Computer Engineering, (IOSR-JCE), 2013; 11(2): 15-25.
7. M. A. Pai, “Power Quality Enhancement using Custom Power Devices”, The Kluwer International Seriesin Engineering and Computer Science. 8. Sung-Min Woo; Dae-Wook Kang ; Woo-Chol
Lee ; Dong-seok Hyun, “The distribution STATCOM for reducing the effect of voltage sag and swell”, Industrial Electronics Society, IECON'01. The 27th Annual Conference of the IEEE, 2001; 2: 1132 – 1137.
9. Molina, M. G.; Mercado, P.E. “Control Design and Simulation of DSTATCOM with Energy Storage for Power Quality Improvements” Transmission & Distribution Conference and Exposition: Latin America, 2006; 7.
10. Yubin Wang ; Jiwen Li ; Lv, Y.; Xuelian Liu, “Modeling and Controller Design of Distribution Static Synchronous Compensator”, Power System Technology, 2006. Power Con. International Conference, Publication Year, 2006; 1-6.
11. Virulkar, V.; Aware, M., “Analysis of DSTATCOM with BESS for mitigation of flicker”, Control, Automation, Communication and Energy Conservation, INCACEC. International Conference, Publication, 2009; 1 – 7.
12. Ying Bai and Dali Wang,’’ fundamentals of Fuzzy Logic Control–Fuzzy Sets, Fuzzy Rules and Defuzzifications,’’ a text book on fuzzy logic applied to engineering.
13. Singh, B.; Kumar, S. ,“Modified Power Balance Theory for control of DSTATCOM”, Power Electronics, Drives and Energy Systems (PEDES) & Power India, Joint International, Publication, 2010; 1-8.
14. Choma, K. N.; Etezadi-Amoli, M. “The application of a DSTATCOM to an industrial facility”, Power Engineering Society Winter Meeting, IEEE, 2002; 2: 725 -728.
15. Mishra, M.K. ; Karthikeyan, K., “A Fast-Acting DC-Link Voltage Controller for Three-Phase DSTATCOM to Compensate AC and DC Loads”, Power Delivery, IEEE Transactions on Volume: 24 , Issue: 4 , Publication, 2009; 2291 – 2299.
16. Muni,B.P. ; EswarRao,S. ; Vithal,J.V.R.“SVPWMS witched DSTATCOM for Power Factor and Voltage Sag Compensation”, Power Electronics, Drives and Energy Systems PEDES’06. International Conference, Publication Year, 2006; 1 – 6.
17. Heikki N. Koivo, Neural Networks Basics using MATLAB Neural Network Toolbox, 2008.
18. Kuryati Kipli, Mohd Saufee Muhammad, Sh. Masniah Wan Masra, Nurdiani Zamhari, Kasumawati Lias, Dayang Azra Awang Mat “Performance of Levenberg-Marquardt Back propagation for Full Reference Hybrid Image Quality Metrics, proceedings of international multi-conference of engineers and computer scientists, March14-16, 2012; 1: IMECS-2012.