in the population sciences published by the Max Planck Institute for Demographic Research Konrad-Zuse Str. 1, D-18057 Rostock · GERMANY www.demographic-research.org
DEMOGRAPHIC RESEARCH
VOLUME 19, ARTICLE 3, PAGES 15-46
PUBLISHED 01 JULY 2008
http://www.demographic-research.org/Volumes/Vol19/3/ DOI: 10.4054/DemRes.2008.19.3
Research Article
Overview Chapter 1:
Fertility in Europe:
Diverse, delayed and below replacement
Tomas Frejka
Tomáš Sobotka
This publication is part of Special Collection 7: Childbearing Trends and Policies in Europe (http://www.demographic-research.org/special/7/)
© 2008 Frejka & Sobotka.
1 Background 16
2 The spread of very low period fertility and the emergence of new fertility divides in Europe
17
3 Delayed childbearing and tempo distortions in period fertility rates 20
4 Completed cohort fertility levels and trends 27
5 Childbearing of cohorts in the midst of their reproductive period 30
6 Conclusions 41
Overview Chapter 1:
Fertility in Europe: Diverse, delayed and below replacement
Tomas Frejka1
Tomáš Sobotka2
Abstract
Early in the 21st century, three-quarters of Europe’s population lived in countries with
fertility considerably below replacement. This general conclusion is arrived at irrespective of whether period or cohort fertility measures are used. In Western and Northern Europe, fertility quantum was slightly below replacement. In Southern, Central and Eastern Europe, fertility quantum as measured by the period total fertility rate (TFR) and its tempo-adjusted version was markedly below replacement; in many countries it was around 1.5, and in some populations it was as low as 1.3 to 1.4 births per woman. Throughout Europe, a historic transformation of childbearing patterns characterised by a pronounced delay of entry into parenthood has been taking place. This secular trend towards later childbearing has greatly contributed to the decline and fluctuations in period fertility rates. Delayed births were being recuperated, especially among childless women, but the extent of recuperation differs by country and region. All in all, despite a recent upward trend in the period TFR, European fertility early in
the 21st century was at its lowest point since the Second World War.
1 E-mail: [email protected]
1. Background
In contemporary Europe, fertility levels and trends are of grave concern—and for good reasons. There was not a single European country in 2005 with a total fertility rate at or
above the replacement level (Eurostat 2007)3. In the absence of migration, sustained
fertility at or below 1.5 births per woman would lead to such a rapidly declining and ageing population that, as a demographic outlook, it “might well be judged unacceptable” (Demeny and McNicoll 2006: 281). The resulting large proportions of the old and very old would signify major burdens for individuals and societies, including costly health care and large pension expenditures. In addition, any influx of immigrants large enough to offset very low fertility levels would be of dimensions likely to make their integration difficult, and could cause serious social and political tensions and problems.
There is a general consensus among scholars that “maintaining fertility at a level that does not fall much below a two-child average – say, around 1.7 – 1.8” (Demeny and McNicoll 2006: 281), would make population ageing and the eventual population decline easier to manage. It is within this framework that the present project has set out to assess and discuss levels, trends, and prospects of childbearing in Europe.
This chapter provides an overview of period and cohort fertility rates in Europe during recent decades, and discusses crucial relevant issues. Section 2 provides an overview of period fertility levels and trends during the past half century. Using period data, Section 3 discusses childbearing postponement, and the extent to which fertility delays lead to distortions in period total fertility rates. Methods that might be used to overcome these distortions are briefly reviewed and adjusted period TFRs for European regions are also presented. Levels and trends in completed cohort fertility rates are discussed in Section 4. In Section 5, childbearing patterns of cohorts that were in different stages of their reproductive periods early in the 21st century are utilized to illustrate the extent of actual recent birth delays and recuperation. Section 6 summarizes conclusions.
3 In this chapter Europe is defined by particular geopolitical boundaries, which include the Asian part of
2. The spread of very low period fertility and the emergence of new
fertility divides in Europe
As a consequence of the multiple constraints childrearing imposes on parents, combined with a smaller desired family size and a strong trend towards postponement of parenthood, many European countries have experienced a decline of the period total fertility rate (TFR) to ‘very low’ (below 1.5), or ‘lowest-low’ (below 1.3) levels. This process has been particularly rapid during the 1990s, when most post-socialist societies of Central and Eastern Europe joined the latter group during their complex societal transformation (see Overview Chapter 5). In 2002, 16 out of 39 European countries with populations above 100,000 (excluding Turkey) recorded period TFR below 1.3, and 25 countries recorded period TFR below 1.5 (Figure 1). The ‘lowest-low’ fertility – first analyzed extensively by Kohler, Billari and Ortega (2002) – spread throughout Europe with breathtaking speed, affecting countries with more than one half of the European population by 2002 (Figure 2), up from nil in the early 1990s. This proportion has subsequently declined as the TFR in several large countries (Italy, Russia, and Spain) has bounced back above the threshold of 1.3, or fluctuated around that level. Almost three-quarters of Europeans currently live in societies with a TFR below 1.5, whereas the remaining one-quarter live in countries with a TFR above 1.7 (Figure 2). Although these thresholds are arbitrary, they enable us to identify societies where sustained low fertility might become a serious social and economic problem in the future. In the absence of sizeable immigration, an extended period of several decades of
‘lowest-low’ fertility would inevitably result in a long-term population decline.4
While all European societies currently experience sub-replacement fertility rates, the contemporary European fertility map is characterized by sizeable regional contrasts that have crystallized after 1990 (Figure 3). Larger European regions seem to form relatively coherent units, within which different countries experience similar fertility levels and trends. Countries of Western and Northern Europe (excluding the German-speaking countries) form a ‘higher-fertility belt’ in Europe, with total fertility rates that are relatively close to the replacement level threshold, ranging in 2006 between 1.7 (the Netherlands and Belgium) and 2.0 (France). Fertility levels in these countries also come close to that of the United States, where period fertility rates have never fallen much below two children per woman, and the period TFR bounced back to 2.10 in 2006
4 A stable population with no external migration experiences an annual population decline of 1.5 percent
Figure 1: Number of European countries with a period TFR below 1.7, 1.5, and 1.3 in 1970-2005 (out of 39 countries with population above 100,000)
0 5 10 15 20 25 30 35
1970 1975 1980 1985 1990 1995 2000 2005
N u m b e r o f c o u n tr ie
s TFR 1.70 or more
TFR below 1.70
TFR below 1.50
TFR below 1.30
Source: Authors’ computations based on Eurostat (2006, 2007) and Council of Europe (2006).
Note:Montenegro counted as a part of the former republic of Serbia-Montenegro.
Figure 2: Proportion of Europeans living in countries with a period TFR below 1.7, 1.5, and 1.3 (1970-2005)
0 10 20 30 40 50 60 70 80 90 100
1970 1975 1980 1985 1990 1995 2000 2005
P ro p o rt io n o f E u ro p e a n p o p u la ti o n
TFR below 1.30 TFR below 1.50
TFR below 1.70 TFR 1.70 or more
(Hamilton, Martin and Ventura 2007). This ‘high’ fertility is an outcome of considerable regional, social, religious, and ethnic diversity in fertility patterns (Morgan 1996, Frejka 2004, Lesthaeghe and Neidert 2006). All other regions of Europe have low period TFRs, ranging between 1.2 and 1.5 (several countries and regions of Southeastern Europe, including Albania and Kosovo, constitute an exception). These new regional differences in period fertility gave rise to various explanations of this divide, including those centered on differences in the character of family and gender equality (McDonald 2000, see also Italy chapter), and, more generally, on differences in welfare state regimes and family policies (e.g., France chapter). McDonald (2006) suggests that there is a ‘cultural divide’ between countries with very low fertility and those with ‘moderately low fertility,’ where the total fertility rate of 1.5 constitutes a dividing threshold. He further argues that countries with very low fertility should
consider policy action to increase fertility rates5 (see also discussion on fertility policies
in Overview Chapter 8).
The argument about a possible cultural divide has an inherent limitation, because it
is based on period measures which are influenced by the tempo effect—i.e., the
distortion caused by shifts in the timing of childbearing6—rather than on completed
fertility of specific cohorts. Thus, some countries may have experienced a very low period TFR level due to a rapid shift in childbearing ages, rather than because of a very low ‘underlying’ fertility level. As Figures 6 and 7 indicate, relatively few countries are likely to reach a completed fertility rate below 1.5 in the foreseeable future. Although it is reasonable to expect that the current European divides in low fertility will persist in the next two decades, past experience of sudden shifts and reversals in period fertility suggest that the future may not be entirely free of surprises. Since 1950, the ranking of European regions with respect to their fertility levels has undergone several sharp reversals. The former state socialist societies of Central and Eastern Europe, where fertility trends often run in the opposite direction of trends in other regions of Europe, shifted from being the highest fertility region of Europe in the 1950s, to become the lowest fertility region of Europe in the early 1960s, and then again the highest fertility
5
This call for policy action also rests on a hypothesis of a ‘low fertility trap,’ formulated by Skirbekk, Lutz and Testa (2006), which posits that, once the fertility level falls below a certain threshold, fertility decline may become self-reinforcing and almost impossible to reverse.
6 A tempo effect can either inflate or depress period fertility rates. The inflation is caused by an advancement
of childbearing, which implies that women are bearing children at progressively younger ages and
region by the mid-1980s, and the lowest fertility region by the early 2000s. The relative position of the Nordic countries has also shifted repeatedly, albeit to a smaller extent (Figure 3).
As D. Glass (1937) pointed out at a time when many European countries first experienced an unprecedented decline of period fertility, any evaluation of how serious such observed trends are requires us to reflect on their likely persistence. There is a general agreement among researchers that low fertility (i.e., below-replacement fertility) is likely to persist for the coming decades (e.g., Lesthaeghe and Willems 1999). However, very low levels of the period TFR are typically a result of a combination of quantum and tempo effects, and may thus be a temporary phenomenon in many societies – in this case, ‘temporary’ could also mean several decades (see also below). Nevertheless, even such a time-limited rapid fall in the period TFR to very low levels has serious consequences for the respective society, as it usually brings a distinct decrease in the number of births. Thus a decline in the period TFR, though limited in duration, can nonetheless affect the future generation size and create imbalances in the age structure of a population.
3. Delayed childbearing and tempo distortions in period fertility
rates
Delayed entry into parenthood has become a universal feature of European fertility trends (Kohler, Billari and Ortega 2002; Sobotka 2004a; Frejka and Sardon 2004, 2005, 2006, and 2007). By the early 2000s, practically all European societies, including the countries of the former Soviet Union, experienced the onset of fertility postponement (Figure 4). In many countries of Western, Northern, and Southern Europe, women now enter motherhood at an average age of 28-29 years, up from age 24-25 in the early 1970s. Spanish and Swiss women have become the oldest first-time mothers in Europe (with a mean age of 29.3 in 2005; see the chapter on Spain in this volume). Women in the post-communist countries of Central and Eastern Europe have children at an earlier age, but Central European countries, in particular, have seen an intensive trend towards postponement of childbearing since the mid-1990s (e.g., the Czech Republic chapter). Interestingly, the shift to later childbearing has progressed with a much higher intensity in most parts of Europe than in the United States (Figure 4), which records considerably higher teenage childbearing rates and marked social status heterogeneity in childbearing patterns.
exception of the United Kingdom, and, to a smaller extent, also Ireland and Portugal), and fertility rates below age 25 have fallen drastically. In many countries, less than one-fifth of births are to women under the age of 25 (Figure 5). In parallel, the peak of childbearing is shifting to ages 30-32 in many populations: in Italy and Spain, women over age 30 contribute almost 60 percent to the overall period total fertility. Whereas the age schedule of fertility is shifting in all parts of Europe, the absolute increase in fertility rates past ages 28-30 differs greatly between countries, indicating wide differences in the pace of fertility recuperation, and contributing greatly to regional heterogeneity in fertility levels (e.g., Lesthaeghe and Willems 1999, see also below). Childbearing rates also increase rapidly at very late childbearing ages (40+), but, all in all, very late fertility still remains rather marginal (Sobotka, Kohler, and Billari 2007).
Figure 3: Period total fertility rate in major regions of Europe and in the United States, 1950-2006
1.0 1.5 2.0 2.5 3.0 3.5
1950 1955 1960 1965 1970 1975 1980 1985 1990 1995 2000 2005
P
e
ri
o
d
T
F
R
Europe Northern Europe Southern Europe Central-Eastern Europe German-speaking Western Europe Eastern Europe United States
Lowest-low fertility Replacement threshold
Source: Authors’ computations based on Eurostat (2006, 2007), Council of Europe (2006), Festy (1979), Chesnais (1986) and
national statistical data.
Notes:Data are weighted by the population size of given countries and regions.
Countries are grouped into regions as follows:
Western Europe: Belgium, France, Ireland, Luxembourg, the Netherlands, and the United Kingdom; German-speaking countries: Austria, Germany, and Switzerland;
Northern Europe: Denmark, Finland, Iceland, Norway, and Sweden; Southern Europe: Cyprus, Greece, Italy, Malta, Portugal, and Spain;
Central-Eastern Europe: Croatia, Czech Republic, Estonia, Hungary, Latvia, Lithuania, Poland, Slovakia, Slovenia, Bosnia-Herzegovina, Bulgaria, Macedonia, Montenegro, Romania, and Serbia & Kosovo;
Figure 4: Mean age of women at first childbirth in selected countries and regions of Europe and in the United States, 1960-2005 (arithmetic averages)
20 21 22 23 24 25 26 27 28 29 30
1980 1985 1990 1995 2000 2005
M
e
a
n
a
g
e
a
t
fi
rs
t
c
h
ild
b
ir
th
(
y
e
a
rs
)
Spain
Western & Northern Europe (8 countries)
Central-eastern Europe (9 countries) Russia United States
Source: Authors’ computations based on Council of Europe (2006), Eurostat (2006, 2007) and national vital statistics data.
Note: See Figure 3 for the specification of regional groupings of individual countries.
Figure 5: Fraction of period total fertility rates contributed by women below age 25 in selected countries and regions of Europe and in the United States, 1960-2004 (arithmetic averages)
0 10 20 30 40 50 60
1960 1965 1970 1975 1980 1985 1990 1995 2000
F
ra
c
ti
o
n
o
f
to
ta
l
fe
rt
ili
ty
b
e
lo
w
a
g
e
2
5
(
in
p
e
rc
e
n
t)
Russia South-eastern Europe
(4 countries)
Central Europe (9 countries)
Western & Northern Europe (10 countries) Spain & Italy
United States
Source: Authors’ computations based on Council of Europe (2006) and national vital statistics data.
Note: Regional grouping differs partly from the grouping in Figure 4 as Central-Eastern Europe is split into two regions, Central
Europe and Southeastern Europe. See Table 1 below for the specification of regional groupings of individual countries.
childbearing shifts towards later ages, i.e., the premise that, in a given period, women of all age categories ‘postpone’ or ‘advance’ births to the same extent.
controlling for parity and age; chapters on the Czech Republic, Poland, and Slovakia), and period parity progression ratios (England and Wales); to a fertility index based on age-specific childbearing intensities for first births, and duration-specific fertility rates for second and higher-order births (Period Average Parity, PAP; chapters on Austria and France).
While the adjustment proposed by Kohler-Ortega is methodologically superior to the Bongaarts-Feeney method; and, while the PAP provides an ‘adjustment-free’ alternative to the TFR, their computation is data intensive and cannot be provided for a large number of European countries and regions. Consequently, to make a European-wide comparison of the recent levels of period fertility adjusted for tempo effects, we utilize estimates of the Bongaarts-Feeney adjusted TFR for the period 2001-2003
provided by the Vienna Institute of Demography (VID 2006)7. These results are
grouped in Table 1 for the main regions of Europe and compared to the conventional TFR in 2002, as well as to the Bongaarts-Feeney tempo-adjusted TFR estimated for 1995-2000 (Sobotka 2004b). This exercise confirms that, even if tempo distortions are taken into account, all European regions have sub-replacement fertility, and considerable heterogeneity among countries and regions prevails. In addition, this cross-country variability has increased slightly since 1995-2000 due to the decline in the adjusted TFR in Southern Europe to the low level of 1.43, and due to a lesser decline in Central-Eastern Europe to 1.66.
The ‘higher-fertility’ regions of Western and Northern Europe (except for the German-speaking countries) retain a stable level of the adjusted TFR above 1.8, with some countries surpassing 2.0 (Ireland, 2.22; Norway, 2.07; France, 2.02). By contrast, some of the ‘lowest-fertility’ countries, such as Italy, Poland, and Spain, have seen a further drop in the adjusted TFR. Thus, the division of Europe into a group of countries with ‘moderately low’ fertility, and a group of countries with ‘very low fertility,’ as suggested by the unadjusted TFR, is also mirrored in the adjusted TFR levels. However, a number of countries do not fit completely in this division. Most countries of Central-Eastern Europe, where the tempo effect is currently the largest in Europe, have reached
extremely low TFR levels of 1.2-1.38 but only moderately low levels of the adjusted
TFR at 1.6-1.7. The estimated tempo-adjusted level of fertility is much lower in the European countries of the former Soviet Union, where it averaged 1.45 (figures for this region are less reliable, however, due to a lack of availability of order-specific fertility data).
7 Displaying the Bongaarts-Feeney adjusted TFR for larger groups of countries also decreases the risk that the
adjTFR would be affected by short-term fluctuations and irregularities, and reduces the potential error caused by the violations of the underlying assumptions behind this adjustment method.
8 Cf. Overview chapter 5, Section 5 Effects of changing cohort fertility age patterns, where the extraordinarily
Table 1: Period TFR and the estimated level of tempo-adjusted TFR in main European regions in 2001-2003 and 1995-2000
Population size, millions (2002)
TFR (2002)
Adj. TFR
(2001–2003)
Tempo effect
Adj. TFR
(1995–2000)
Western Europe 149.3 1.75 1.92 -0.17 1.88
Northern Europe 24.3 1.70 1.96 -0.26 1.94
German-speaking countries 97.8 1.32 1.53 -0.21 1.52
Southern Europe 120.4 1.28 1.43 -0.15 1.59
Central Europe 77.6 1.25 1.66 -0.41 1.74
Southeastern Europe 43.7 1.33 1.64 -0.31 1.67
Eastern Europe 205.8 1.25 1.45 -0.19 1.46
EUROPE
EU-15 378.6 1.49 1.67 -0.18 1.70
EU-12 new (2004 & 2007 accession)
104.1 1.24 1.63 -0.39 1.67
EU-27 482.6 1.44 1.66 -0.22 1.69
Europe 722.0 1.39 1.61 -0.22 1.63
Sources:Authors’ computations based on VID (2006) and Sobotka (2004b)
Notes:Data are weighted by population size of given countries and regions.
Regional grouping differs partly from the grouping in Figure 3 as Central-Eastern Europe is split into two regions, Central Europe and Southeastern Europe. Countries are grouped into regions as follows:
For Western Europe, German-speaking countries, Northern Europe, and Southern Europe see notes below Figure 3 above. Central Europe: Croatia, Czech Republic, Estonia, Hungary, Latvia, Lithuania, Poland, Slovakia, Slovenia;
South-Eastern Europe: Bosnia-Herzegovina, Bulgaria, Macedonia, Montenegro, Romania, Serbia & Kosovo. Eastern Europe: Belarus, Moldova (excluding Transnistria), Russia (including Asian part), Ukraine.
of fertility postponement.9 The recent increase in this indicator in many European countries—including Bulgaria, the Czech Republic, Estonia, Italy, France, the Netherlands, Spain, Sweden, and the United Kingdom—is largely attributable to fertility ‘recuperation’ among women past age 30, and the declining tempo effect in the TFR. In addition, the increasing size of immigrant populations with higher fertility rates has also played an important role in the observed rise in the TFR in some countries, including Italy, France, Spain, and the United Kingdom (see Overview Chapter 7). However, in each of these countries, ‘native’ women also experienced rising fertility rates (Dunnell 2007, Héran and Pison 2007, Gabrielli, Paterno and Strozza 2007, Roig Vila and Castro Martín 2007).
On an individual level, later timing of parenthood is associated with lower completed fertility because infertility increases with age, and women have fewer years left to attain their desired family size (Toulemon 2004, see also estimates in the model presented by Billari and Borgoni 2005). However, the aggregate effects of delayed childbearing on completed fertility may still be relatively minor, partly because most
women achieve their first pregnancy at an age well before the onset of their infertility,10
and thus can achieve their childbearing goals (at least from a biological perspective); but also partly because other factors can compensate for fertility-inhibiting effects of later motherhood. Interestingly, two chapters in this book offer a contrasting evaluation of these effects. Whereas the authors of the chapter on Spain argue that the drastic reduction of fertility rates at birth orders three and higher is “primarily the result of the late age at first motherhood,” the case of France provides an indication that the shift to a late childbearing pattern does not necessarily reduce completed fertility (France chapter). Together with Sweden, France has one of the highest ages at first motherhood in Europe, and relatively stable levels of the completed cohort TFR, which remains close to the replacement threshold. This evidence indicates that, besides inducing tempo distortions of period fertility rates, the delayed entry into parenthood has so far played only a minor role in the observed shift to low and very low fertility levels in many parts of Europe (see also Overview Chapter 4).
9 It should be noted, however, that the adjusted TFR is—as any other period measure of fertility—changing
over time. This limits its usefulness for projecting future trends in the conventional period TFR or cohort TFR. Although one could assume that once the shift towards later childbearing stops, the conventional TFR would increasingly get close to the level of the adjusted measure, some countries may also experience a further decline in fertility quantum (and thus in the adjusted TFR), counterbalancing any increasing effects of the end of fertility postponement (Bongaarts 2002).
10 Goldstein’s (2006) analysis of cohort age schedules of first births concluded that the current populations of
4. Completed cohort fertility levels and trends
We now turn to the exploration of cohort fertility, which has the advantage of measuring fertility quantum in an unadulterated way. The problem with completed cohort fertility rates is that these provide information about childbearing behaviour with a certain time lag. In contemporary low-fertility countries, where almost all childbearing is completed by about age 40, the time lag is approximately 10 to 15
years11. Nonetheless, trends of total cohort fertility rates (TCFRs) set a historical
framework by illustrating long-term trends of the real quantum of fertility, i.e., average
parity12. The shortcoming of investigations based on TCFRs can be overcome by
analyzing cohort fertility patterns of generations that are in the middle of their childbearing years. This is done below in Section 5 of this chapter. Recent studies (e.g., Frejka, Sardon 2004, 2006, and 2007; Sobotka 2004a) have proven that such research can provide useful insights about contemporary fertility behaviour.
Two broad groupings of countries of almost equal size provide an appropriate illustration of long-term cohort fertility trends in Europe during the past half century, namely, (i) Western Europe, and (ii) the former socialist countries of Central and
Eastern Europe.13
With some exceptions, cohort fertility in Western European countries generally increased among 1920s cohorts, reaching a peak among 1930s cohorts (Figure 6). This was followed by a decline among 1940s birth cohorts, which, in a number of countries, such as France and Sweden, was interrupted among the 1950s cohorts. In other countries, such as Austria, West Germany, and Spain, the descent continued in the cohorts of the 1950s and early 1960s. The outstanding feature is that completed cohort fertility was declining in virtually all Western countries among the cohorts of the early
to mid-1960s, i.e., the cohorts finalizing their childbearing early in the 21st century. The
one country in which TCFRs did not decline among the 1960s cohorts was Denmark. The cohort fertility trends in the former socialist countries were even more homogeneous (Figure 7). In most of these countries, the total cohort fertility rates were stable from cohorts of the 1930s through those of the late 1950s. There were a few countries in which cohort fertility was comparatively high among the 1930s cohorts, and in which it declined rapidly from thereon, exemplified by the Slovak Republic and
11
Information provided by total cohort fertility rates (TCFRs) corresponds approximately to the period when the respective birth cohort was in its prime reproductive years. For instance, the TCFR of a 1965 birth cohort in a Western country rendered in 2005 will reflect mainly the level of fertility of the decade of the 1990s; in a former socialist country, the 1965 TCFR reflects mainly fertility levels of the late 1980s.
12 The use of cohort fertility data is also the appropriate tool to analyse real parity distributions as performed
in Overview Chapter 2.
13 These two broad groups correspond to the sum of the first four and the last three categories in Table 1,
Poland in Figure 7. Without exception, TCFRs were declining among the cohorts of the 1960s. Preliminary data indicate a continuing descent among the cohorts of the early 1970s (not shown in Figure 7).
Regional averages of completed fertility of the 1965 cohort ranged from a high of 2.1 in Northern Europe, to lows of 1.6-1.7 in the German-speaking countries and Southern and Eastern Europe (Table 2). A number of countries had TCFRs at 2.0 and above; the larger ones were France (2.03), Ireland (2.19), Norway (2.07), Poland (2.00), and Slovakia (2.04). The lowest 1965 TCFRs were found in Germany (1.51), Austria (1.65), Switzerland (1.66), Italy (1.51), Spain (1.62), Belarus (1.62), Ukraine (1.64), and the Russian Federation (1.65). It is important to realize that all these values
Figure 6: Total cohort fertility rates, selected Western European countries, birth cohorts 1915-1967
1.2 1.4 1.6 1.8 2.0 2.2 2.4 2.6 2.8 3.0
1915 1920 1925 1930 1935 1940 1945 1950 1955 1960 1965
Birth cohort
C
o
m
p
le
te
d
c
o
h
o
rt
f
e
rt
ili
ty
(
C
T
F
R
)
Denmark Sweden France Netherlands Austria Former FRG Spain
England and Wales
Sources: Observatoire Démographique Européen, Festy 1979, Sardon 1991 and Austria chapter.
Note: The completed fertility rates for cohorts of the 1960s contain estimates for women in their late thirties and forties. The values of
Figure 7: Total cohort fertility rates, selected Central and Eastern European countries, birth cohorts 1924-1967
1.2 1.4 1.6 1.8 2.0 2.2 2.4 2.6 2.8 3.0
1915 1920 1925 1930 1935 1940 1945 1950 1955 1960 1965
Birth cohort
C
o
m
p
le
te
d
c
o
h
o
rt
f
e
rt
ili
ty
(
C
T
F
R
)
Czech Republic Slovak Republic Bulgaria Russia Slovenia Lithuania Poland
Sources:Observatoire Démographique Européen, Council of Europe (2006), Avdeev and Monnier (1995), Bolesławski (1993), the
Czech Republic and Slovakia chapters.
Note:The completed fertility rates for cohorts of the 1960s contain estimates for women in their late thirties and forties. The values of
the total cohort fertility rates might be moderately underestimated, but the trends depicted in the graph are affected only to a minor extent.
Table 2: Total cohort fertility rate, European regions, birth cohorts 1955 and 1965
Total cohort fertility rate
Difference between 1955 TCFR and 1965 TCFR
Region 1955 1965 Absolute In percent
Western Europe 2.03 1.92 –0.11 –5.4
Northern Europe 2.07 2.06 –0.01 –0.5
German-speaking countries 1.73 1.61 –0.12 –6.9
Southern Europe 1.94 1.68 –0.26 –13.4
Central Europe 2.04 1.88 –0.16 –7.8
South-Eastern Europe 2.22 2.02 –0.20 –9.0
Eastern Europe 1.87 1.64 –0.23 –12.3
Source: Council of Europe 2006.
Note: Unweighted data. Regional groupings are almost identical to those in Table 2. Data were not available for one or both years for
Cyprus, Malta, Moldova, Ukraine, and Bosnia & Herzegovina.
5. Childbearing of cohorts in the midst of their reproductive period
Parenthood postponement has been a crucial factor in fertility trends in the past several decades in the advanced countries (cf. all chapters in this volume, Kohler et al. 2002, Sobotka 2004a, Frejka and Sardon 2004, 2006, 2007). Specific features of timing of births and changes in age patterns of childbearing differ between regions, from one country to another, and between social strata (e.g., by education).
In the latter part of the 20th century and early in the 21st century, the most
prominent demographic mechanism determining fertility trends has been the extent to which childbearing postponement has been counterbalanced by birth recuperation. In the Western countries, this process started among the cohorts born during the 1940s (i.e., it started in the late 1960s and the early 1970s). In the former socialist countries, this process was initiated much later, among the cohorts of the 1960s. If the amount of childbearing that was presumably postponed by a cohort early in its reproductive period is fully recuperated when these women are older, cohort fertility trends are stable. Alternatively, if only a portion of the postponed births is recuperated later in the reproductive years, cohort fertility declines. The rate of cohort fertility decline will thus depend on the degree to which delayed fertility is eventually recuperated. At the same time, a thorough understanding of cohort fertility changes helps to explain period fertility trends.
The main objective of the present project is to understand contemporary, i.e., late
patterns of cohorts that were in the midst of their childbearing years at that time are explored. While such an investigation gives us important insights, it has an unavoidable shortcoming: the younger the cohort is, the less can be currently known about its lifetime childbearing behaviour. Whereas the 1960 cohort was approaching the end of its reproductive years in 2003—the last year for which data were available for all countries at the time of our analyses— the 1970 birth cohort was, for example, only 33 years old, and the 1975 cohort was only 28.
Figures 8 and 9 display developments in three countries—the Netherlands, Spain, and Bulgaria—regarding the interplay of fertility timing and quantum trends. These countries were selected because many of the typical developments occurred here, and can be well demonstrated. Trends in first and second births are studied separately, as
they provide clearer insights than the investigation of all birth orders lumped together14.
Investigation of higher order births could be added, but the additional acquired knowledge would be marginal because of the relatively small proportion of these births. In 1995-1996, first and second births accounted for 84 percent of all births in advanced low-fertility countries (Frejka and Ross 2002), and since then, this proportion has probably increased further.
In the Netherlands, about 82 percent of women in the 1960 cohort had become
mothers, and the following cohorts were due to reach comparable levels. Women of the 1960s birth cohorts delayed the birth of their first child moderately, but all the delayed first births were recuperated later (Figures 8a and 9a). Women of the 1970s birth cohorts no longer delayed their first births; the curves of the 1970, 1975, and 1980 cohorts are almost identical (as far as the data have been available). As of the mid-2000s, it is not known whether these women will also recuperate all the supposedly delayed first births (compared to the cohorts of the early 1960s), because they are still in the initial stages of their reproductive period. Close to 70 percent of women in the 1960 cohort had a second birth, and the delaying, as well as the recuperating, propensities of subsequent cohorts were similar to first births (Figures 8b and 9b). These processes are reflected in the levels and trends of the period fertility measures by birth order, and of the period TFR. As delaying of parenthood ceased, the TFR increased during the late 1990s from 1.5 in 1996, to 1.7 births per woman in 2000, and remained at that level through 2005.
14 Analyses of the aggregate data and of the birth order data provide complementary information. However,
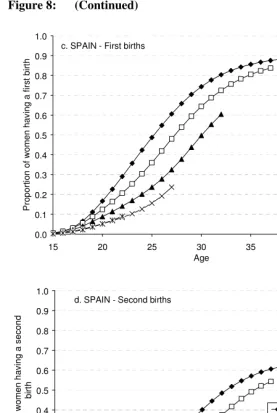
Figure 8: Cumulative progression rate to first and second births; birth cohorts 1960, 1965, 1970, 1975, and 1980; the Netherlands, Spain, and Bulgaria
a. NETHERLANDS - First births
0.0 0.1 0.2 0.3 0.4 0.5 0.6 0.7 0.8 0.9 1.0
15 20 25 30 35 40 45
Age P ro p o rt io n o f w o m e n h a v in g a f ir s t b ir th 1960 1965 1970 1975 1980
b. NETHERLANDS - Second births
0.0 0.1 0.2 0.3 0.4 0.5 0.6 0.7 0.8 0.9 1.0
15 20 25 30 35 40 45
Figure 8: (Continued)
c. SPAIN - First births
0.0 0.1 0.2 0.3 0.4 0.5 0.6 0.7 0.8 0.9 1.0
15 20 25 30 35 40 45
Age P ro p o rt io n o f w o m e n h a v in g a f ir s t b ir th 1960 1965 1970 1975 1980
d. SPAIN - Second births
0.0 0.1 0.2 0.3 0.4 0.5 0.6 0.7 0.8 0.9 1.0
15 20 25 30 35 40 45
Figure 8: (Continued)
e. BULGARIA - First births
0.0 0.1 0.2 0.3 0.4 0.5 0.6 0.7 0.8 0.9 1.0
15 20 25 30 35 40 45
Age P ro p o rt io n o f w o m e n h a v in g a f ir s t b ir th 1960 1965 1970 1975 1980
f. BULGARIA - Second births
0.0 0.1 0.2 0.3 0.4 0.5 0.6 0.7 0.8 0.9 1.0
15 20 25 30 35 40 45
Age P ro p o rt io n o f w o m e n h a v in g a s e c o n d b ir th 1960 1965 1970 1975 1980
Figure 9: Cumulative change in first and second birth progression rates by age, birth cohorts 1960, 1965, 1970, 1975, and 1980; the Netherlands, Spain, and Bulgaria (benchmark cohort 1960)
a. NETHERLANDS - First births
-0.3 -0.2 -0.1 0.0 0.1
15 20 25 30 35 40 45
Age
C
u
m
u
la
ti
v
e
a
b
s
o
lu
te
c
h
a
n
g
e
1960 1965 1970 1975 1980
b. NETHERLANDS - Second births
-0.3 -0.2 -0.1 0.0 0.1
15 20 25 30 35 40 45
Age
C
u
m
u
la
ti
v
e
a
b
s
o
lu
te
c
h
a
n
g
e
Figure 9: (Continued)
c. SPAIN - First births
-0.4 -0.3 -0.2 -0.1 0.0 0.1
15 20 25 30 35 40 45
Age
C
u
m
u
la
ti
v
e
a
b
s
o
lu
te
c
h
a
n
g
e
1960 1965 1970 1975 1980
d. SPAIN - Second births
-0.4 -0.3 -0.2 -0.1 0.0 0.1
15 20 25 30 35 40 45
Age
C
u
m
u
la
ti
v
e
a
b
s
o
lu
te
c
h
a
n
g
e
1960
1965
1970
1975
Figure 9: (Continued)
e. BULGARIA - First births
-0.4 -0.3 -0.2 -0.1 0.0 0.1
15 20 25 30 35 40 45
Age C u m u la ti v e a b s o lu te c h a n g e 1960 1965 1970 1975 1980
f. BULGARIA - Second births
-0.4 -0.3 -0.2 -0.1 0.0 0.1
15 20 25 30 35 40 45
Age C u m u la ti v e a b s o lu te c h a n g e 1960 1965 1970 1975 1980
In Spain, 90 percent of women of the 1960 birth cohort had a first birth by age 42. Each subsequent cohort of the 1960s and 1970s had fewer first births when these women were in their early to mid-twenties (Figures 8c and 9c). For example, by age 27, women of the 1975 cohort had borne 0.37 fewer first births than the 1960 cohort. It appears, nevertheless, that in Spain first birth delay came to a halt among the cohorts of the late 1970s. The curve for the 1980 cohort is equivalent to the 1975 curve, although this is difficult to distinguish in Figure 9c. As women grew older, they had a propensity to recuperate delayed first births; however, so far it cannot be conclusively determined to what extent recuperation has been achieved. Sixty-four percent of Spanish women in the 1960 cohort had a second birth by age 42. Second births were also being delayed when women were young. By the time women of the 1970 cohort were in their early thirties, they had had only about half as many second births as the cohort ten years older. Just as with first births, second births were no longer being delayed among the cohorts of the late 1970s. The propensity to recuperate the delayed second births was also evident, but it was weaker and the eventual outcome yet unknown. Period fertility in Spain had declined to its lowest level by 1999, when the period TFR was at 1.13 births per woman, and it has been gradually rising since then, reaching 1.37 in 2006. This increase was directly related to the fact that childbearing delay was abating.
In Bulgaria, 97 percent of women of the 1960 cohort had had a first birth by age
1.82 births per woman in 1990, to its lowest level of 1.09 in 1997. It increased moderately to 1.30 in 2000, and to 1.38 in 2006.
These three examples, together with evidence presented in the country chapters and other literature (Kohler et al. 2002, Sobotka 2004a, Frejka, Sardon 2004, 2006, 2007), illustrate prevailing contemporary patterns of fertility behaviour. The main features are the following:
In the past two to four decades, the postponement of parenthood was an ongoing process in virtually all European countries, and it continues to be so. The almost universal prevalence of childbearing postponement is confirmed in individual chapters and by selected examples in Table 3. Among the cohorts of the 1960s and early 1970s, childbearing by young women declined in virtually all countries. This decline has been more obvious for second than for first births. In general, the rates of decline have been more pronounced in the countries of Southern, Central, and Eastern Europe, and less so in Western and Northern Europe. In the Netherlands, the fertility of young women no longer declined among the 1970s birth cohorts. This means that childbearing postponement has ceased among Dutch women, at least temporarily, if not permanently. Incipient signs of postponement coming to an end can be detected elsewhere, such as among the cohorts of the late 1970s in Spain and Bulgaria (Figures 8 and 9), but also in France, the United Kingdom, and in the Nordic countries.
There is a propensity to recuperate delayed fertility. Recuperation of second births tends to be weaker than that of first births. Recuperation is particularly strong in Northern Europe and in many Western European countries, but is weaker in Southern, Central, and Eastern Europe (cf. country chapters; Frejka and Sardon 2007).
A crucial yet unanswerable question is the extent to which delayed births of the 1970s cohorts will be recuperated as women get older. The experience of the recent past portrayed in the chapters of this book and from other sources indicates higher rates of recuperation in Northern and Western Europe than elsewhere.
Table 3: First and second birth order cumulated cohort fertility rates (CCFRs) up to 27th birthday, selected low fertility countries, birth cohorts 1940, 1950, 1960, 1970, and 1975 (or latest available)
CCFR up to 27th birthday
Annual change between birth cohorts (percent)
Country
1940 1950 1960 1965 1970 1975*
1940-1950
1950-1960
1960-1965
1965-1970
1970-1975*
First births
Denmark … … 0.539 0.451 0.421 0.350 … … –3.6 –1.4 –3.7
Sweden … … 0.493 0.493 0.427 0.319 … … 0.0 –2.9 –5.9
England &
Wales 0.723 0.630 0.497 0.455 0.433 0.392b –1.4 –2.4 –1.8 –1.0 –2.5 Netherlands 0.665 0.608 0.395 0.324 0.268 0.268 –0.9 –4.3 –4.0 –3.8 0.1
Austria … … … 0.522 0.471 0.407 … … … –2.1 –2.9
Italy 0.604 0.641 0.514 0.391 0.298 0.298a 0.6 –2.2 –5.5 –5.5 ...
Spain … … 0.548 0.419 0.278 0.192 … … –5.3 –8.2 –7.4
Czech
Republic 0.833 0.841 0.842 0.830 0.748 0.536 0.1 0.0 –0.3 –2.1 –6.6 Hungary 0.785 0.797 0.804 0.761 0.661 0.481 0.1 0.1 –1.1 –2.8 –6.4 Bulgaria 0.875 0.893 0.877 0.856 0.787 0.604 0.2 –0.2 –0.5 –1.7 –5.3
Romania … … 0.822 0.770 0.712 0.569 … … –1.3 –1.6 –4.5
Slovenia 0.753 0.810 0.826 0.726 0.584 0.443 0.7 0.2 –2.6 –4.4 –5.5
Second births
Denmark … 0.372 0.213 0.179 0.160 0.140 … –5.6 –3.5 –2.2 –2.7
Sweden … … 0.245 0.247 0.209 0.136 … … 0.2 –3.3 –8.6
England &
Wales 0.465 0.394 0.300 0.257 0.233 0.214b –1.6 –2.7 –3.1 –1.9 –2.2 Netherlands 0.373 0.331 0.189 0.139 0.106 0.101 –1.2 –5.6 –6.2 –5.4 –1.0
Austria … … … 0.249 0.218 0.181 … … … –2.7 –3.7
Italy 0.290 0.304 0.214 0.143 0.097 0.097a 0.5 –3.5 –8.1 –7.8 …
Spain … … 0.215 0.137 0.082 0.054 … … –9.1 –10.2 –8.3
Czech
Republic 0.491 0.560 0.558 0.504 0.394 0.219 1.3 0.0 –2.0 –4.9 –11.7 Hungary 0.356 0.474 0.460 0.429 0.334 0.200 2.9 –0.3 –1.4 –5.0 –10.2 Bulgaria 0.503 0.568 0.560 0.515 0.360 0.227 1.2 –0.1 –1.7 –7.1 –9.2 Romania … 0.513 0.504 0.440 0.297 0.224 … –0.2 –2.7 –7.9 –5.6 Slovenia 0.347 0.400 0.430 0.354 0.252 0.156 1.4 0.7 –3.9 –6.8 –9.6
* or latest available
Source: Frejka and Sardon (2007).
6. Conclusions
Early in the 21st century, about one-quarter of Europe’s population live in countries
with fertility close to the replacement level. Three-quarters live in countries with fertility considerably below replacement. This general conclusion is arrived at irrespective of whether period or cohort fertility measures are used.
Relative stability of fertility trends has been achieved in most parts of Western and Northern Europe during the 1980s through the early 2000s (cf. Figure 3 and respective country chapters), and among the corresponding cohorts of the late 1940s to the 1960s. Similarly, period fertility was relatively stable in many former state socialist countries during the 1970s and 1980s when corresponding cohort fertility was exceptionally even (corresponding country chapters). In both cases, it remained close to replacement.
It is more difficult to determine accurately the underlying quantum of fertility during periods of changing fertility trends when the respective measures and their adjustments should be considered an approximation. That was the case especially in the former state socialist countries during the 1990s and 2000s. In the early 2000s, total period fertility rates were very low there, around 1.3 to 1.4 births per woman (cf. Figure 3), whereas the adjusted TFRs were around 1.5–1.7 (cf. Table 1). There is no information available yet about fertility of the corresponding birth cohorts of the 1970s and early 1980s. Judging from the trends in cohorts that were in the midst of their childbearing careers by the early 2000s, there are clear indications of an incipient and rather pronounced decline in their completed fertility. Cohort fertility has also been declining in the German-speaking countries and in Southern Europe, although it has not
been quite as volatile as in the former state socialist countries. Early in the 21st century,
period total fertility in these regions reached low levels of around 1.3-1.4 and the adjusted TFRs were about 1.4-1.5.
In sum, in the mid- 2000s in Western and Northern Europe fertility quantum was moderately below the replacement level, which has been recently reached in the United States; whereas in Southern, Central and Eastern Europe, fertility quantum was considerably below the replacement level. Across Europe, the mean number of births per woman was close to 1.7, but in many countries the period fertility level was considerably lower and stood around 1.4-1.5 births per woman even when the negative tempo distortions are taken into account.
by changes in the timing of childbearing. Delayed births were eventually being recuperated, especially among childless women, but the extent of recuperation differs by country and region. In Western and Northern Europe, most—at times, all—of the delayed births have been recuperated as women have reached their late twenties and thirties. The extent of recuperation has been notably smaller in the German-speaking countries and in Southern Europe. Thus far, the recuperation of delayed births has been weak in most of the former state socialist countries, especially among second and higher order births.
All in all, despite a recent upward trend in period TFRs, European fertility early in
the 21st century was at its lowest point since the Second World War. Surveys of fertility
References
Avdeev, A., and A. Monnier. 1995. A survey of modern Russian fertility, Population: An English
selection 7: 1–38.
Bolesławski, L. 1993. Polskie tablice dzietności kobiet 1992. Polish fertility tables
1971-1992. Warsaw: Główny urząd statystyczny.
Bongaarts, J. 2002. The end of fertility transition in the developed world, Population and
Development Review 28(3): 419–443.
Bongaarts, J., and G. Feeney. 1998. On the quantum and tempo of fertility, Population and
Development Review 24(2): 271–291.
Chesnais, J.-C. 1986. La transition démographique: étapes, formes, implications économiques. Etude de séries temporelles relatives à 67 pays. Cahier n° 113, Paris: INED-PUF.
Council of Europe. 2006. Recent demographic developments in Europe 2005. Strasbourg:
Council of Europe Publishing.
Demeny, P., and G. McNicoll. 2006. The political demography of the world system, 2000–2050,
in P. Demeny and G. McNicoll (Eds.), Population and Development Review, a
supplement to vol. 32, pp: 254–287.
Dunnell, K. 2007. The changing demographic picture of the UK. National Statisticians annual
article on the population, Population Trends 130: 9–21.
Eurostat. 2006. Population in Europe 2005. First results. Statistics in Focus, Population and Social Conditions, 16/2006. Luxembourg: European Communities.
Eurostat. 2007. Population and Social Conditions. http://epp.eurostat.ec.europa.eu.
Festy, P. 1979. La fécondité des pays occidentaux de 1870 à 1970. Travaux et Documents No. 85.
Paris: INED – PUF.
Frejka, T. 2004. The ‘curiously high’ fertility of the USA, Population Studies 58(1): 88–92.
Frejka, T., and J.-P. Sardon. 2004. Childbearing Trends and Prospects in Low-Fertility countries: A cohort analysis, Dorbrecht: Kluwer Academic Publishers.
Frejka, T., and J.-P. Sardon. 2005. The direction of contemporary fertility trends in the developed countries: further decline, plateau or upswing? Proceedings of the XXV IUSSP International Conference. Tours: France.
Frejka, T., and J.-P. Sardon. 2006. First birth trends in developed countries: persisting parenthood
postponement, Demographic Research 15(6): 147–180. www.demographic-research.org.
Frejka, T., and J.-P. Sardon. 2007. Cohort birth order, parity progression ratio and parity
distribution trends in developed countries, Demographic Research 16(11): 315–374.
www.demographic-research.org.
Frejka, T., and J. Ross. 2001. Paths to sub-replacement fertility: the empirical evidence, in R.
Bulatao and J. B. Casterline (Eds.), Global Fertility Transition. Population and
Development Review, a supplement to vol. 27. pp: 213–254.
Gabrielli, G., A. Paterno, and S. Strozza. 2007. Dynamics, characteristics, and demographic
behaviour of immigrants in some south-European countries. Paper presented at an international conference on “Migration and Development,” Moscow: 13–15 September 2007.
Glass, D. 1937. The population problem and the future, Eugenics Review 29(1): 39–47. Reprinted
Goldstein, J. 2006. How late can first births be postponed? Some illustrative population-level
calculations, Vienna Yearbook of Population Research 2006: 153–165.
Hamilton, B. E., J. A. Martin, and S. J. Ventura. 2007. Births. Preliminary data for 2006.
National Vital Statistics Reports 56(7). December 2007, Atlanta: NCHS and CDC. Héran, F., and G. Pison. 2007. Two children per woman in France in 2006: are immigrants to
blame?, Population and Societies 432. http://www.ined.fr/fichier/t_telechargement/
7659/telechargement_fichier_en_publi_pdf2_pop.and.soc.english.432.pdf.
Kohler, H.-P., and J. A. Ortega. 2002a. Tempo-adjusted period parity progression measures,
fertility postponement and completed cohort fertility, Demographic Research 6(6): 92–
144. www.demographic-research.org.
Kohler, H.-P., F. C. Billari, and J. A. Ortega. 2002. The emergence of lowest-low fertility in
Europe during the 1990s, Population and Development Review 28(4): 641–680.
Lesthaeghe, R., and L. Neidert. 2006. The second demographic transition in the United States:
Exception or textbook example?, Population and Development Review 32(4): 669–698.
Lesthaeghe, R., and P. Willems. 1999. Is low fertility a temporary phenomenon in the European
Union?, Population and Development Review 25(2): 211–228.
Lutz, W., V. Skirbekk, and M. R. Testa. 2006. The low-fertility trap hypothesis: forces that may
lead to further postponement and fewer births in Europe, Vienna Yearbook of Population
Research 2006: 167–192.
McDonald, P. 2000. Gender equity in theories of fertility transition, Population and Development
Review 26(3): 427–439.
McDonald, P. 2006. An assessment of policies that support having children from the perspectives
of equity, efficiency and efficacy, Vienna Yearbook of Population Research 2006: 213–
234.
Morgan, P. S. 1996. Characteristic features of modern American fertility, in.: J. B. Casterline, R.
D. Lee and K. A. Foote (Eds.), Fertility in the United States. New patterns, new theories.
Supplement to Population and Development Review22, New York: Population Council,
pp: 19–63.
Roig Vila, M., and T. Castro Martín. 2007. Childbearing patterns of foreign women in a new
immigration country: The case of Spain, Population-E 62(3): 351–380.
Sardon, J.-P. 1991. Generation replacement in Europe since 1900, Population: An English
Selection 3: 15–32.
Schoen, R. 2004. Timing effects and the interpretation of period fertility, Demography 41(4):
801–819.
Smallwood, S. 2002. The effect of changes in the timing of childbearing on measuring fertility in
England and Wales, Population Trends 109: 36–45. www.statistics.gov.uk/
STATBASE/Product.asp?vlnk=6303.
Sobotka, T. 2003. Tempo-quantum and period-cohort interplay in fertility changes in Europe.
Evidence from the Czech Republic, Italy, the Netherlands and Sweden, Demographic
Research 8(6): 151–214. www.demographic-research.org.
Sobotka, T. 2004a. Postponement of childbearing and low fertility in Europe. Amsterdam: Dutch University Press.
Sobotka, T. 2004b. Is lowest-low fertility explained by the postponement of childbearing?,
Sobotka, T., H.-P. Kohler, and F. C. Billari. 2007. The increase in late childbearing in Europe, Japan, and the United States. Paper presented at the 2007 Annual Meeting of the Population Association of America, New York: 29–31 March 2007.
Testa, M. R. 2007. Childbearing preferences and family issues in Europe: evidence from the
Eurobarometer 2006 survey, Vienna Yearbook of Population Research 2007: 357–379.
Toulemon, L. 2004. Le fécondité est-elle encore naturelle? Application au retard des naissances
et à son influence sur la descendance finale, in Chaire Quetelet 2002, Academia
Bruylant/L’Harmattan, pp: 1–28.
Van Imhoff, E. 2001. On the impossibility of inferring cohort fertility measures from period
fertility measures, Demographic Research 5(2):23–64. www.demographic-research.org.
VID. 2006. European demographic data sheet 2006. Vienna:Vienna Institute of demography,