in the population sciences published by the Max Planck Institute for Demographic Research Doberaner Strasse 114 · D-18057 Rostock · GERMANY www.demographic-research.org
DEMOGRAPHIC RESEARCH
VOLUME 7, ARTICLE 3, PAGES 49-66
PUBLISHED 31 JULY 2002
www.demographic-research.org/Volumes/Vol7/3/
DOI: 10.4054/DemRes.2002.7.3
Research Article
Language-group Differences in
Very Early Retirement in Finland
Jan Saarela
Fjalar Finnäs
1 Introduction 50
2 Data and method 52
3 Results 56
4 Conclusions 60
5 Acknowledgements 61
Notes 62
References 63
Research Article
Language-group Differences in Very Early Retirement in Finland
Jan Saarela 1
Fjalar Finnäs 2
Abstract
The purpose of this paper is to study very early retirement as an indicator for poor health, with focus on a comparison between the two language groups in Finland. Extensive longitudinal data are analysed with the help of random effects probit models. As expected from previous studies of mortality differences, the rate of retirement is lower among Swedish-speakers than among Finnish-speakers, and this cannot be attributed to socio-demographic and regional factors. Swedish-speaking males have a risk of very early retirement that is about 25 per cent lower than that of Finnish-speaking males. Among females the corresponding difference is about 15 per cent. Our results also suggest that not accounting for unobserved individual heterogeneity will bias the effect of native language downwards.
1 Åbo Akademi University, Department of Social Sciences, Vörågatan 9, FIN-65100 Vasa, Finland. Tel.: +358-6-3247476, fax: +358-6-3247457, e-mail: [email protected].
1. Introduction
Finland is a bilingual country with Finnish and Swedish as the official languages. The two language groups are guaranteed similar rights. The Swedish-speakers although account for barely six per cent of the total population. They are geographically concentrated along the southern and western coastlines of the country. In these regions, about half of the Swedish-speaking population form a local majority at municipality level (see the map in Figure 1).
The population registers in Finland provide unique opportunities for detailed language-group comparisons in several demographic respects. Since the mother tongue of each citizen is included in the registers, language groups can be studied separately. From published vital statistics it is evident that age-specific death risks are lower among Swedish-speakers than among Finnish-speakers. In terms of life expectancy, the difference is about two and a half years for males and almost one year for females (Finnäs, 1986). A number of studies have shown that this language-group difference cannot be attributed to socio-demographic and regional factors (Sauli, 1979; Valkonen, 1982a; 1982b; Valkonen et al., 1990; 1992; Koskinen, 1994; Martelin, 1994). There are also some analyses suggesting that the health of Swedish-speakers is better than that of Finnish-speakers (Salminen et al., 1996; Suominen et al., 2000; Hyyppä and Mäki, 2001a).
In this paper, we utilise extensive longitudinal register data, in order to study one factor connected to health and mortality. We will compare the two language groups with regard to retirement at relatively low ages, namely among people aged 30-54. This means that we focus on whether a person is being classified as a pensioner in the central population register, which inevitably means that he or she is outside the labour force.
The purpose of the paper is to study if the pattern observed in mortality analyses is manifested also at early stages of life. We are convinced that very early retirement can be considered as an indicator for poor health, because retiring in these low ages almost inevitably implies that a person receive disability pension (Note 1).
We are consequently not analysing “standard” early retirement programmes, which are all targeted at older individuals (Note 2). The results of Hyyppä and Mäki (1997a; 1997b; 2001b) suggest that there also may be language-group differences in this respect, since Swedish-speakers seem to have a longer active working life than Finnish-speakers.
Figure 1: The geographical concentration of Swedish-speakers in Finland (in 1990)
Per cent
Swedish-speakers
0 - 14 15 - 33 34 - 50 51 - 66 67 - 91 92 - 100
Vaasa
Turku
there are clear indications that mortality is considerably higher among the (young) pensioners than among the others (see the next chapter).
Due to the small size of the Swedish-speaking population in Finland, detailed language-group comparisons of mortality at low ages are difficult to perform. Retirement in ages 30-49 is also rare, but still almost twice as common as death (see e.g. Statistics Finland, 1997, p. 85; Central Pension Insurance Institute, 1997, pp. 39-47). This, as such, therefore offers better opportunities for empirical analysis.
Based on previous studies, we find it reasonable to expect that Swedish-speakers are less likely than Finnish-speakers to retire very early. The purpose is therefore to study if this is the case, and to analyse whether potential disparities remain also after an inclusion of a number of relevant socio-demographic factors. In addition to these variables, the data also offer the opportunity to incorporate a component for unobserved heterogeneity in our econometric models. As a consequence, we may separate between the impact of unobserved variables on the individual level and the true impact of language-group belonging (Note 3). Disregarding such a component is likely to bias the effect of native language.
2. Data and method
We will utilise an extract from the longitudinal census data file compiled by Statistics Finland (see Statistics Finland, 1991). At present, the file contains linked individual information for all Finnish residents from the censuses of 1970, 1975, 1980, 1985, 1990 and 1995. Our data consist of a multidimensional matrix, that includes all individuals and information about their age, gender, native language, marital status, education, socio-economic status, industry of work, place of residence, and type of family.
The data offer no explicit information about the event of retirement. However, by comparing the socio-economic status at consecutive censuses we may conclude whether a person had retired or not. We will study whether a person is classified as a pensioner, conditional on he or she not being classified as a pensioner at the previous census.
Persons who have died or emigrated abroad during a census period are excluded from the analyses, since we have no information about them at the end of the period. The number of such losses amounted to 2.3 per cent of all observations. We have no possibilities to distinguish between migration and death. Most of the losses are although, evidently, due to death, since on the basis of the relevant death risks in Finland, we can assume a reduction of the age groups by almost two per cent. There is a substantial difference between retired and non-retired persons in this respect. As many as 9.5 per cent of those retiring at ages 30-49 were lost during the subsequent five-years periods, in comparison with only 2.2 per cent for those having not retired. We cannot find any reason why (young) retired persons would emigrate more frequently than the others, and therefore consider the above pattern a support for using early retirement as an indicator for (very) poor health.
Since more than 95 per cent of the Swedish-speakers live in the 51 officially bilingual (Note 4) or monolingual Swedish municipalities along the western and southern coastlines of Finland, we will restrict our study to these regions. In order to guarantee anonymity of the data, we had to group these municipalities into 15 larger regions, on the basis of geographical position and urbanisation, upon completion of data transfer from Statistics Finland.
The number of persons with a native language other than Finnish or Swedish was less than one per cent of all observations. Such people were excluded from analysis.
It is plausible to assume that there could be a relationship between very early retirement and geographical mobility. On the one hand, people with underlying health problems may be less likely to move due to practical impediments. On the other hand, people who move may experience a reduction of their social contacts, such as family and friends. This may increase health problems (see e.g. Dalgard and Hålheim, 1998), and imply that mobility increases the probability of very early retirement. The fact that within-country migration among Swedish-speakers is considerably lower than among Finnish-speakers is also a reason for utilising a mobility variable. We consequently attempted to include geographical mobility, both in terms of long-distance migration and short-distance migration, into the analysis. In spite of our large data set, this aspect did not, however, significantly improve the fit of the models. We therefore excluded it from the final models.
with or (4) without present children, ending with previously married (5) with or (6) without present children.
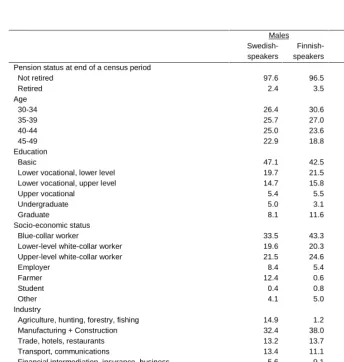
A description of the data, in terms of variable distributions by gender and native language, is provided in Table 1. We can see that the two language groups are similar in most respects. There are, however, differences in some of the socio-demographic characteristics, which may explain some of the overall differences in retirement. Swedish-speakers are on average older and, partly due to this, less educated. Since we concentrate on the formerly dominated areas, almost all farmers are Swedish-speakers. The proportion of blue-collar workers is, as a consequence, higher among Finnish-speakers. It is also interesting to note that Swedish-speaking females to a greater extent than Finnish-speaking females are not economically active. A reason for this is that they to a greater extent are housewives, since many Swedish-speaking males work in agriculture. The high proportion of Swedish-speaking males living with their parents may also be related to differences in industrial distribution between the two language groups.
The proportion of economically not active persons is higher among females than among males, which can be attributed to the substantially higher proportion of females nursing children at home.
Language-group differences in the proportion of people living in the most traditional type of family, a couple with children, are astonishing but in accordance with previous findings. Finnäs (1997) has shown that marital stability is considerably higher among Swedish-speakers than among Finnish-speakers.
All variables refer to conditions at the beginning of the observation period. In addition to the variables shown in Table 1, we have also included the region of residence in the analysis.
Since the dependent variable is binary, a probit specification is used. The model is of the random effects type (see Greene, 2000, pp. 837-839), since the data allow us to account also for unobserved individual-specific effects.
Consequently, we model the probability of early retirement in t+1, subject to that the individual has not retired at t, as
it it it
x
y
*=
β
′
+
ε
, (i=1,...,n),(
t
=
1
,...,
T
i)
(1)1
=
ity
ify
it*>
0
, and 0 otherwise.Each individual is denoted by i, and the period between two censuses by t. A vector of explanatory variables is referred to as x, whereas
β
is its associated vector ofTable 1: Variable distributions (%) by gender and native
Males Females
Swedish-speakers
Finnish-speakers
Swedish-speakers
Finnish-speakers Pension status at end of a census period
Not retired 97.6 96.5 97.3 97.1
Retired 2.4 3.5 2.7 2.9
Age
30-34 26.4 30.6 25.8 29.8
35-39 25.7 27.0 25.4 26.7
40-44 25.0 23.6 24.9 23.7
45-49 22.9 18.8 23.9 19.8
Education
Basic 47.1 42.5 49.3 46.7
Lower vocational, lower level 19.7 21.5 20.7 20.3
Lower vocational, upper level 14.7 15.8 14.1 16.4
Upper vocational 5.4 5.5 5.9 5.0
Undergraduate 5.0 3.1 6.1 4.9
Graduate 8.1 11.6 3.8 6.7
Socio-economic status
Blue-collar worker 33.5 43.3 20.0 26.1
Lower-level white-collar worker 19.6 20.3 45.0 47.8
Upper-level white-collar worker 21.5 24.6 15.2 16.8
Employer 8.4 5.4 5.3 4.0
Farmer 12.4 0.6 10.0 0.6
Student 0.4 0.8 0.7 1.2
Other 4.1 5.0 3.8 3.4
Industry
Agriculture, hunting, forestry, fishing 14.9 1.2 8.3 0.8
Manufacturing + Construction 32.4 38.0 12.2 16.7
Trade, hotels, restaurants 13.2 13.7 14.6 17.4
Transport, communications 13.4 11.1 4.7 4.2
Financial intermediation, insurance, business 5.6 9.1 7.3 10.7
Public and other services 15.9 20.4 31.4 35.3
Not economically active 3.9 5.9 21.1 14.6
Unknown 0.8 0.6 0.4 0.3
Family status (and whether children in the household)
Living with parent(s) 6.2 2.7 1.2 0.6
Single 6.5 10.8 6.2 11.3
Married or consensual union, no children 9.5 12.4 9.2 11.1
Married or consensual union, children 71.2 64.2 71.5 60.3
Previously married or consensual union, no children 4.9 8.2 2.9 4.7
Previously married or consensual union, children 1.8 1.7 9.0 12.1
n 178,351 707,963 168,557 770,671
We specify
i it it
=
v
+
u
ε
. (2)Unmeasured characteristics are thus in part specific to each census period (
v
it), and in part individual-specific and constant across all census periods (u
i). Both components are normally distributed with zero means and independent of one another, so that[ ]
2 2 21
uu v it
Var
ε
=
σ
+
σ
=
+
σ
(3)and
[
]
22
1
,
u u is itCorr
σ
σ
ρ
ε
ε
+
=
=
(4)The parameter to be integrated out, based on Gauss-Hermite Quadrature (see
Lillard and Panis, 2000, p. 103), is
σ
u=
ρ
/(
1
−
ρ
)
. This is the component representing unobserved individual heterogeneity. The estimations are carried out with the software aML 1.04.3. Results
Table 1 also shows that, as expected, very early retirement is less common among Swedish-speakers than among Finnish-speakers. The difference is specifically prominent among males, where the proportion among Swedish-speakers is 2.4 per cent, as compared with 3.5 per cent among Finnish-speakers. For females, the proportions are much more equal: 2.7 per cent for Swedish-speakers and 2.9 per cent for Finnish-speakers. Note also that the retirement rate among Swedish-speakers is higher for females than for males.
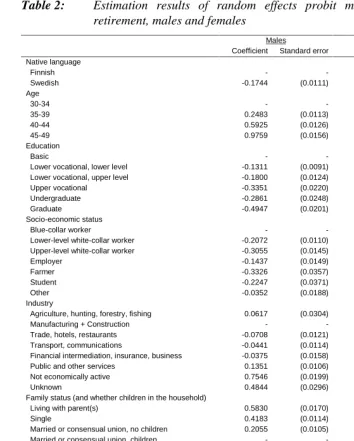
Despite that the variables education, socio-economic status and industry could be considered as reflecting fairly similar issues, our results indicate that they all have independent and statistically significant effects. The estimation results of the final models are presented in Table 2 (Note 6).
As can be seen in the table, even after the inclusion of all the explanatory variables, there remains a significant effect of native language on the probability of early retirement. For males, the probit estimate for native language changed from -0.33 to -0.17 when the impact of socio-demographic and regional factors was taken into account. For females, the control variables had only a marginal impact on the estimate for the effect of native language; the probit estimate remained almost the same (a change from -0.10 to -0.09). The variable with the greatest impact on the estimated effect for native language was socio-economic status.
In corresponding models without unobserved heterogeneity, the estimated effect for native language was -0.1454 for males and -0.0655 for females. A comparison with the parameters in Table 2 (-0.1744 and -0.0914), thus suggests that not accounting for unobserved heterogeneity will bias the effect of native language downwards. This implies that previous language-group comparisons are likely to have understated the effect of native language, since they do not account for the impact of omitted variables.
A few comments can also be made about the effects of the other variables. Age has, naturally, an increasing impact on very early retirement, whereas education and socio-economic status have a decreasing impact. In terms of probabilities, our results suggest that males with a basic education only have a fivefold risk of retirement, in comparison with highly educated males. Correspondingly, the probability of early retirement for female blue-collar workers is more than threefold that of females in upper-level white-collar occupations.
People living with their parents and singles are most likely to retire early, whereas those married or living in consensual unions are least likely. The effect of this variable is larger for males than for females.
There also seem to be some period effects. Early retirement was evidently more common in 1971-1975 than in the subsequent periods. According to Hytti (1993), this may be attributed to an improvement in the population’s overall health status (mainly the decreasing severity of circulatory diseases), and partly due to employment and social security trends. Since we control for a number of background variables, there are no reasons to believe that underlying time trends would affect the estimation results, specifically those pertaining to language-group differences. There are in fact no indications from the data that differences between language groups would differ significantly between time periods.
Table 2: Estimation results of random effects probit models for very early retirement, males and females
Males Females
Coefficient Standard error Coefficient Standard error
Native language
Finnish - - -
Swedish -0.1744 (0.0111) -0.0914 (0.0107)
Age
30-34 - - -
35-39 0.2483 (0.0113) 0.2078 (0.0113)
40-44 0.5925 (0.0126) 0.4820 (0.0120)
45-49 0.9759 (0.0156) 0.8524 (0.0142)
Education
Basic - - -
Lower vocational, lower level -0.1311 (0.0091) -0.1270 (0.0092)
Lower vocational, upper level -0.1800 (0.0124) -0.2363 (0.0122)
Upper vocational -0.3351 (0.0220) -0.4531 (0.0230)
Undergraduate -0.2861 (0.0248) -0.3911 (0.0223)
Graduate -0.4947 (0.0201) -0.4863 (0.0235)
Socio-economic status
Blue-collar worker - - -
Lower-level white-collar worker -0.2072 (0.0110) -0.2861 (0.0090)
Upper-level white-collar worker -0.3055 (0.0145) -0.3475 (0.0148)
Employer -0.1437 (0.0149) -0.1515 (0.0164)
Farmer -0.3326 (0.0357) -0.2319 (0.0306)
Student -0.2247 (0.0371) -0.2248 (0.0321)
Other -0.0352 (0.0188) 0.1640 (0.0156)
Industry
Agriculture, hunting, forestry, fishing 0.0617 (0.0304) 0.2578 (0.0329)
Manufacturing + Construction - - -
Trade, hotels, restaurants -0.0708 (0.0121) 0.0073 (0.0120)
Transport, communications -0.0441 (0.0114) 0.0311 (0.0186)
Financial intermediation, insurance, business -0.0375 (0.0158) -0.0451 (0.0154)
Public and other services 0.1351 (0.0106) 0.0287 (0.0110)
Not economically active 0.7546 (0.0199) 0.5300 (0.0129)
Unknown 0.4844 (0.0296) 0.4999 (0.0450)
Family status (and whether children in the household)
Living with parent(s) 0.5830 (0.0170) 0.8662 (0.0314)
Single 0.4183 (0.0114) 0.4357 (0.0122)
Married or consensual union, no children 0.2055 (0.0105) 0.3460 (0.0105)
Married or consensual union, children - - -
Previously married or consensual union, no children 0.3040 (0.0111) 0.4045 (0.0136) Previously married or consensual union, children 0.2315 (0.0219) 0.2620 (0.0107) Census period
1971-1975 - - -
1976-1980 -0.2287 (0.0106) -0.2571 (0.0103)
1981-1985 -0.3188 (0.0109) -0.2872 (0.0107)
1986-1990 -0.1444 (0.0103) -0.1371 (0.0103)
1991-1995 -0.2255 (0.0105) -0.1688 (0.0104)
Constant -2.3981 (0.0268) -2.4430 (0.0275)
σu 0.5864 (0.0218) 0.5730 (0.0215)
Log likelihood -112,230.7839 -107,364.0570
n 886,314 939,228
residence. Some preliminary results (using interaction terms between native language and region of residence) also suggested that the impact of native language on very early retirement was fairly similar between regions.
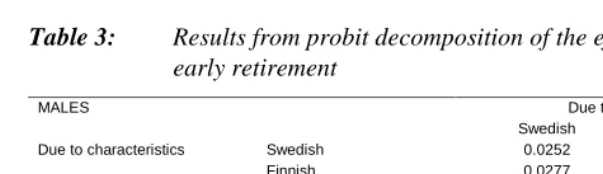
In order to summarise our results, we will, in a similar way to Drinkwater and O’Leary (1997), perform a probit decomposition. This will illustrate how much of the difference in the probability of very early retirement can be attributed to the fact that the language groups differ with regard to how they are equipped to avoid retirement (i.e., differences in characteristics), and how much can be attributed to differing returns on these characteristics between the two groups (i.e., differences in coefficients). Separate probits are now fitted for each language group (and each gender).
Let
I
ˆ
S=
P
(
β
ˆ
S,
x
S)
denote the average predicted probability of early retirement on the basis of both coefficients(
β
ˆ
)
and characteristics (x) for the Swedish-speakers. A decomposition of the difference between the language groups can then be written as[
(
ˆ
,
)
(
ˆ
,
)
] [
(
ˆ
,
)
(
ˆ
,
)
]
ˆ
ˆ
S F S S F S F S F Fx
P
x
P
x
P
x
P
I
I
−
=
β
−
β
+
β
−
β
(5)or
I
ˆ
S−
I
ˆ
F=
[
P
(
β
ˆ
S,
x
F)
−
P
(
β
ˆ
F,
x
F)
] [
+
P
(
β
ˆ
S,
x
S)
−
P
(
β
ˆ
S,
x
F)
]
. (6) The difference in means due to coefficients is represented by the first term in square brackets, and the difference in characteristics by the second term. Equation (5) thus decomposes around Swedish-speakers’ average characteristics and equation (6) around Finnish-speakers’ average characteristics.It is an arbitrary decision as to whose characteristics one chooses to decompose around. The results are presented for both decomposition methods, for males and females respectively, in Table 3. A vertical shift provides the average difference of coefficients between the two groups, whereas a horizontal shift gives the average difference of characteristics. A diagonal shift (left-up to right-down) provides the (total) difference in means.
Among males, the socio-demographic composition of the Swedish-speaking population is somewhat more favourable than that of the Finnish-speaking one. It although amounts to only a minor part of the total language-group difference in the probability of retirement. The difference induced by a differing return on characteristics is thus substantial. Swedish-speaking males have a risk of very early retirement that is about 25 per cent lower than that of Finnish-speaking males (Note 7).
return on characteristics. Swedish-speaking females have a risk of very early retirement that is about 15 per cent lower than that of Finnish-speaking females (Note 8).
Table 3: Results from probit decomposition of the effect of native language on very early retirement
MALES Due to coefficients
Swedish Finnish
Due to characteristics Swedish 0.0252 0.0345
Finnish 0.0277 0.0363
FEMALES Due to coefficients
Swedish Finnish
Due to characteristics Swedish 0.0279 0.0335
Finnish 0.0259 0.0297
The above results represent average predicted probabilities of early retirement.
(Row 1, Column 1) - (Row 1, Column 2) gives the difference due to coefficients, decomposed around the Swedish-speakers’ characteristics.
(2,1) - (2,2) gives the difference due to coefficients, decomposed around the Finnish-speakers’ characteristics. (1,1) - (2,1) gives the difference due to characteristics, decomposed around the Swedish-speakers’ coefficients. (1,2) - (2,2) gives the difference due to characteristics, decomposed around the Finnish-speakers’ coefficients. (1,1) - (2,2) gives the total difference in means, i.e. due to both characteristics and coefficients.
4. Conclusions
The purpose of this paper has been to study very early retirement as an indicator for (very) poor health, with focus on a comparison between the two language groups in Finland. Previous studies have shown that Swedish-speakers live longer than Finnish-speakers. There is although fairly little known about language-group differences in health conditions.
We have argued that very early retirement may be used as a health indicator, and that it also can be assumed to be an objective measure of health. Mortality is, evidently, considerably higher among young retired people than among those not retired.
As expected from differences in mortality, the rate of retirement is lower among Swedish-speakers than among Finnish-speakers. We can see that there are remarkable differences in retirement between various socio-demographic categories. These cannot, however, explain the language-group difference in retirement. In several respects, our results correspond with findings from mortality studies. Swedish-speaking males have a risk of very early retirement that is about 25 per cent lower than that of Finnish-speaking males. Among females, the corresponding difference is about 15 per cent. Thus, in spite of the extensive register data used, we cannot explain or eliminate the language-group difference that can be observed at the aggregate level.
true effect of language-group belonging. The estimation results suggest that not accounting for unobserved individual heterogeneity will bias the effect of native language downwards. The language-group difference in very early retirement consequently increases when we account for the impact of unobservables. This suggests that there are also other, underlying, language-group factor(s), than those observed here, which cause(s) differences in health and mortality between Swedish-speakers and Finnish-speakers. Such aspects could be related to each group’s social and cultural life pattern, which cannot be observed in ordinary data registers.
Due to its size, regional distribution and history, it has been argued that the Swedish-speaking population live in tighter social networks than the Finnish-speakers (see e.g. Saarela and Finnäs, 2002a), and that this, evidently, affects different aspects of life. For example, marital stability is considerably higher, and unemployment much lower, among Swedish-speakers (Finnäs, 1997; Saarela and Finnäs, 2002b). However, on the basis of information available, we do not wish to speculate about such mechanisms.
It should also be pointed out that no study has been able to show that the differences in health and mortality are due to genetic disparities between the two language groups (Nevanlinna 1973; Virtaranta-Knowles et al., 1989; 1991).
In our opinion, the contribution of this paper has been that it demonstrates the existence of differences in health between two population groups that live intermingled and, in most observable respects, are equal (on a par with each other). Language as such cannot, however, offer any explanation to the depicted disparities, other than by serving as an indicator for potential differences in lifestyle.
It is difficult in practice to distinguish subpopulations with respect to lifestyle. In this sense, the language groups in Finland offer a good opportunity. We believe that our study is an illustrative way of pointing out that social and cultural factors, which generally cannot be accounted for, may have considerable impact on health and mortality.
A future avenue for research could be to perform disease-specific analyses for Swedish-speakers and Finnish-speakers separately. This will, however, require other types of data than those utilised here.
5. Acknowledgements
Notes
1. Disability pension is provided both as a part of the national pension scheme, which encompass all permanent residents, and as a part of the employment pension scheme, which cover all employees, self-employed and farmers. In the national pension scheme, disability pension is awarded to “someone who has been found unfit for work”, whereas in the employment pension scheme to “an employee with permanent reduced or lost work capacity, due to illness, defect or injury” (Central Pension Security Institute, 1996, pp. 94-95). Since we focus on whether a person is being classified as a pensioner, there is no need to distinguish between the two schemes. The three most common reasons for disability pension, in the employment pension scheme, are “disorder in moving or supporting organs”, “mental illness”, and “blood circulatory disorder”, which amounted to 35, 27 and 13 per cent, respectively, in 1996 (Central Pension Security Institute, 1997, p. 35).
2. Standard retirement programmes are Individual early retirement pension, Unemployment pension, Early old-age pension, and Front-veteran’s pension (Central Pension Security Institute, 1996, p. 29).
3. Riphahn (1999) was the first in the international literature to use individual-level panel data to study disability retirement.
4. A municipality is classified as bilingual if the minority exceeds 8 per cent or 3,000 inhabitants.
5. The number of individuals observed for one period only is 261,423, for two periods 210,297, for three periods 192,851, and for four periods 141,243.
6. In order to facilitate the interpretation of the results we also, in the Appendix, report predicted probabilities of early retirement in each socio-demographic category, using the parameters of the estimated models.
7. 1-(0.0252/0.0345)=0.2696 or 1-(0.0277/0.0363)=0.2369.
References
Central Pension Security Institute (1996). Statistical Yearbook of Pensioners in Finland 1995. The Central Pension Security Institute, Helsinki.
Central Pension Security Institute (1997). Suomen Työeläkkensaajat Vuonna 1996. The Central Pension Security Institute, Helsinki.
Dalgard, O. S. & Hålheim, L. L. (1998). Psychosocial Risk Factors and Mortality: Prospective Study with Special Focus on Social Support, Social Participation, and Locus of Control in Norway. Journal of Epidemiological Community Health, 52, 476-481.
Drinkwater, S. J. & O’Leary, N. C. (1997). Unemployment in Wales: Does Language Matter? Regional Studies, 31, 583-591.
Finnäs, F. (1986). Den Finlandssvenska Befolkningsutvecklingen 1950-1980 – En Analys av en Språkgrupps Demografiska Utveckling och Effekten av Blandäktenskap. Doctoral Dissertation. Skrifter Utgivna av Svenska Litteratursällskapet i Finland, No. 533. Helsinki.
Finnäs, F. (1997). Social Integration, Heterogeneity, and Divorce: The Case of the Swedish-speaking Population in Finland. Acta Sociologica, 40, 263-277.
Greene, W. H. (2000). Econometric Analysis. Prentice Hall, Upper Saddle River, New Jersey.
Hytti, H. (1993). Työkyvyttömyyseläkkeelle Siirtymisen Yhteiskunnalliset Taustatekijät. Doctoral Dissertation. Publications, No. M:87. The Social Insurance Institution, Helsinki.
Hyyppä, M. T. & Mäki, J. (1997a). Pohjanlahden Rannikon Suomenruotsalaiset Säilyvät Työkykyisinä. Suomen Lääkärilehti, 52, 831-839.
Hyyppä, M. T. & Mäki, J. (1997b). Suomenruotsalaisen Väestön Hyvä Terveys ja Työkyky ”Säästävät” Miljardeja. Suomen Lääkärilehti, 52, 3237-3240.
Hyyppä, M. T. & Mäki, J. (2001a). Individual-level Relationships between Social Capital and Self-rated Health in a Bilingual Community. Preventive Medicine, 32, 148-155.
Hyyppä, M. T. & Mäki, J. (2001b). Why Do Swedish-speaking Finns have Longer Active Life? An Area for Social Capital Research. Health Promotion International, 16, 55-64.
Lillard, L. A. & Panis, C. W. A. (2000). aML Release 1. User’s Guide and Reference Manual. EconWare, Los Angeles.
Martelin, T. (1994). Differential Mortality at Older Ages. Doctoral Dissertation. Publications of the Finnish Demographic Society, No. 16. Helsinki.
Nevanlinna, H. R. (1973). Suomen Väestörakenne. Geneettinen ja Genealoginen Tutkimus. Kansaneläkelaitoksen Julkaisuja, No. A:9. Helsinki.
Riphahn, R. T. (1999). Disability Retirement among German Men in the 1980s. Industrial and Labor Relations Review, 52, 628-647.
Saarela, J. & Finnäs, F. (2002a). Ethnicity and Unemployment in Finland. Research Note. Ethnic Studies Review, forthcoming.
Saarela, J. & Finnäs, F. (2002b). Unemployment and Native Language: The Finnish Case. The Journal of Socio-Economics, forthcoming.
Salminen, S., Johansson, A., Hiltunen, E. & Strømnes, F. (1996). Suomen- ja Ruotsinkielisten Työntekijöiden Tapaturmasuhteet. Työ ja Ihminen, 10, 125-136.
Sauli, H. (1979). Ammatti ja Kuolleisuus 1971-75. Research Reports, No. 54. Statistics Finland, Helsinki.
Statistics Finland (1991). Väestölaskentojen Pitkittäistiedosto 1970-1985. Käsikirja. Statistics Finland, Helsinki.
Statistics Finland (1997). Vital Statistics 1996. Population, No. 12. Statistics Finland, Helsinki.
Suominen, S. B., Välimaa, R. S., Tynjälä, J. A. & Kannas, L. K. (2000). Minority Status and Perceived Health: A Comparative Study of Finnish- and Swedish-speaking Schoolchildren in Finland. Scandinavian Journal of Public Health, 28, 179-187.
Valkonen, T. (1982a). Psychosocial Stress and Sociodemographic Differentials in Mortality from Ischeamic Heart Disease in Finland. Acta Medica Scandinavica, 660, 152-164.
Valkonen, T. (1982b). Sociodemographic Mortality Differentials among Middle-aged Men and Problems in Accounting for Them. Working Papers, No. 25. University of Helsinki, Department of Sociology.
Valkonen, T., Martelin, T. & Rimpelä, A. (1990). Eriarvoisuus Kuoleman Edessä. Research Reports, No. 172. Statistics Finland, Helsinki.
Virtaranta-Knowles, K., Sistonen, P. & Nevanlinna, H. R. (1989). Suomenruotsalaiset Populaatiogeneettisenä Tutkimuskohteena. Bidrag till Kännedom av Finlands Natur och Folk, No. 139. Suomen Tiedeseura, Tammisaari.
Appendix:
Table 4: Predicted probability of very early retirement for males and for females, average for each socio-demographic groupMales Females
Native language
Finnish 0.0362 0.0296
Swedish 0.0252 0.0279
Age
30-34 0.0140 0.0122
35-39 0.0213 0.0176
40-44 0.0393 0.0311
45-49 0.0754 0.0663
Education
Basic 0.0500 0.0419
Lower vocational, lower level 0.0303 0.0253
Lower vocational, upper level 0.0220 0.0168
Upper vocational 0.0135 0.0101
Undergraduate 0.0167 0.0114
Graduate 0.0105 0.0090
Socio-economic status
Blue-collar worker 0.0430 0.0465
Lower-level white-collar worker 0.0230 0.0198
Upper-level white-collar worker 0.0127 0.0140
Employer 0.0293 0.0330
Farmer 0.0235 0.0405
Student 0.0542 0.0312
Other 0.1184 0.0931
Industry
Agriculture, hunting, forestry, fishing 0.0279 0.0375
Manufacturing + Construction 0.0336 0.0316
Trade, hotels, restaurants 0.0217 0.0260
Transport, communications 0.0305 0.0264
Financial intermediation, insurance, business 0.0178 0.0174
Public and other services 0.0277 0.0202
Not economically active 0.1193 0.0568
Unknown 0.0953 0.0797
Family status (and whether children in the household)
Living with parent(s) 0.0605 0.0659
Single 0.0594 0.0344
Married or consensual union, no children 0.0404 0.0464
Married or consensual union, children 0.0232 0.0217
Previously married or consensual union, no children 0.0693 0.0638 Previously married or consensual union, children 0.0478 0.0344 Census period
1971-1975 0.0438 0.0474
1976-1980 0.0337 0.0278
1981-1985 0.0275 0.0230
1986-1990 0.0349 0.0269
1991-1995 0.0327 0.0256
Total 0.0340 0.0293
n 886,314 939,228