Demographic Researcha free, expedited, online journal of peer-reviewed research and commentary
in the population sciences published by the Max Planck Institute for Demographic Research Konrad-Zuse Str. 1, D-18057 Rostock·GERMANY www.demographic-research.org
DEMOGRAPHIC RESEARCH
VOLUME 26, ARTICLE 14, PAGES 319-330
PUBLISHED 18 APRIL 2012
http://www.demographic-research.org/Volumes/Vol26/14/ DOI: 10.4054/DemRes.2012.26.14
Formal Relationship 17
Stationary populations with below-replacement
fertility
Carl P. Schmertmann
c
⃝2012 Carl P. Schmertmann.
2 Proof 320
3 History and related results 322
4 Numerical examples: Austria 323
5 Applications 324
6 Acknowledgements 328
Demographic Research: Volume 26, Article 14
Formal Relationship 17
Stationary populations with below-replacement
fertility
Carl P. Schmertmann
∗Abstract
BACKGROUND
A population with sustained below-replacement fertility and constant immigration even-tually becomes stationary. Stationary-through-immigration (SI) populations have unusual age structures that depend on the distribution of immigrants’ arrival ages.
OBJECTIVE
I summarize known formal relationships between the distribution of immigrants’ entry ages and the long-run size and structure of SI populations. I clarify a previously pub-lished result about SI dependency ratios.
RESULTS
The long-run size and age structure of an SI population depend on the remaining life ex-pectancies of arriving immigrants, but are also sensitive to the expected numbers of native children born after arrival. Numerical calculations with contemporary Austrian data show (1) contrary to previously published results, immigration flows need not be concentrated in early working ages in order to ensure low overall dependency, and (2) the SI depen-dency ratio is minimized when all immigrants are in their mid-30s.
1.
Relationship
With constant immigration flows, there are an uncountably infinite number of stationary populations for any below-replacement fertility schedulef and life tablel. Each corre-sponds to a different pattern of age-specific annual immigrant inflows.
If
• The population is entirely female
• There is no emigration
• l(0) = 1andl(a)is the probability of survival from birth to exact agea
• immigrants adopt local age-specific fertilityf(a)after arrival
• I()is a dummy indicator function
• ωis the maximum life span
• e(z) = 1
l(z) { ∫ ω
0
I(a≥z)l(a)da
}
is the remaining life expectancy of az -year-old,
• v(z) = 1
l(z) { ∫ ω
0
I(a ≥ z)f(a)l(a)da
}
is the reproductive value of az -year-old,
• R=v(0)<1is the net rate of reproduction
• m(z)is the unchanging density of annual immigrants at arrival agez
then the long-run population is stationary, with age structure
(1) N∗(a) =
[ ∫ ω
0
(
v(z) 1−R +
I(z≤a)
l(z) )
m(z)dz
]
l(a)
and total size
(2) N∗=
∫ ω
0
(
e(0)
1−Rv(z) +e(z)
)
m(z)dz
2.
Proof
Demographic Research: Volume 26, Article 14
Denote immigrants as generationg= 0, their native-born daughters asg= 1, grand-daughters asg= 2, and so forth. Consider a constant inflow of one immigrant per year at exact agez. This flow will eventually produce a stationary total of
N0∗(a|z) =I(z≤a)
l(z) l(a)
surviving foreign-born immigrants at agea. This population of z-arrivals is analogous to a standard stationary population with replacement-level fertility (call that theRF stationary population), in which the population at ageais proportional tol(a). In the immigration case constant entries occur by immigration rather than birth, at agezrather than0, and the z-arriving subpopulation spans agesz toω, rather than0 toω. Stationarity of the foreign-born population implies that the annual number of daughters born perz-arriving immigrant,B1∗(z), will eventually become stationary at
B1∗(z) = ∫ ω
0
N0∗(a|z)f(a)da= ∫ ω
0
I(z≤a)
l(z) f(a)l(a)da=v(z)
By the same reasoning, annual granddaughters born per z-arriving immigrant, B2∗(z),
will eventually become stationary at
B2∗(z) = ∫ ω
0
B1∗(z)f(a)l(a)da= ∫ ω
0
v(z)f(a)l(a)da=Rv(z)
Repeating this calculation for great-granddaughters, etc. produces the identity
Bg∗(z) =Rg−1v(z) g= 1,2,3, ...
BecauseR <1, the total number of annual births of native descendants, per unit inflow of immigrants at agez, converges to
B∗(z) = ∞ ∑
g=1
Bg∗(z) = ∞ ∑
g=1
Rg−1v(z) = v(z) 1−R
and the density ofa-year-olds in the stationary population resulting from eachz-arrival is
N∗(a|z) =B∗(z)l(a) +N0∗(a|z) = (
v(z) 1−R+
I(z≤a)
l(z) )
Integrating over the numbers of immigrant arrivals at each agez yields the stationary density:
N∗(a) = ∫ ω
0
N∗(a|z)m(z)dz
= ∫ ω
0
[(
v(z) 1−R +
I(z≤a)
l(z) )
l(a) ]
m(z)dz
= ∫ ω
0
[(
v(z) 1−R +
I(z≤a)
l(z) )
m(z)dz
]
l(a) QED: 1
Integrating over age and reversing the order of integration yields the total population
N∗= ∫ ω
0
N∗(a)da
= ∫ ω 0 [ ∫ ω 0 (
v(z) 1−R +
I(z≤a)
l(z) )
m(z)dz
]
l(a)da
= ∫ ω
0
[(
v(z) 1−R
) ∫ ω
0
l(a)da+ ∫ ω
0
(
I(z≤a)
l(z) )
l(a)da
]
m(z)dz
= ∫ ω
0
[(
e(0) 1−R
)
v(z) +e(z) ]
m(z)dz QED: 2
3.
History and related results
Espenshade, Bouvier, and Arthur (1982) first demonstrated that below-replacement fer-tility and constant immigration streams lead to stationary SI populations. Arthur and Espenshade (1988) showed that the total size of such an SI population was very sensitive to the age distribution of annual immigrant arrivalsm(z).
Demographic Research: Volume 26, Article 14
discrete version of the SI model to analyze relationships between immigrant entry ages and the proportion of an SI population that is foreign-born.
Wu and Li (2003) investigated SI dependency ratios. They concluded that, although SI populations are always older than the RF stationary population, their overall dependency ratios [(children plus retirees) / workers] could be lower than RF populations, provided that immigrant entries were concentrated around the beginning of working life.
Recent research by Feichtinger and colleagues (e.g., Dawid et al. 2009) on the age structures of organizations has investigated related questions, using optimal control mod-els to derive entry age distributions that maximize various demographic objectives for the resulting stationary population. These organizational models are a special case of SI populations in which there is no age-specific fertility or reproduction.
4.
Numerical examples: Austria
Relationships (1) and (2) are useful for analyzing the effects of various immigrant entry age distributions on long-run population structure. For numerical illustrations I use con-temporary data from Austria, disaggregated by single year of age,a= 0,1, ...,110. Life tablelaand1Lavalues come from period schedules for Austrian females in 2008 (Human
Mortality Database [HMD] 2011). Current female population counts by age are from the HMD Austria 2009. Fertility ratesfa are period-by-age data for Austria 2008 (Human
Fertility Database [HFD] 2011). Daughter-only fertility rates are assumed to be (100/205)
fato account for the sex ratio at birth. Female immigration levels by age are from Austria
in 2010 (Statistik Austria 2011), with totals for five-year age groups distributed uniformly across single years of age within the group. These data, and an R program for replicating calculations and plots, are available in supplementary files published with this article.
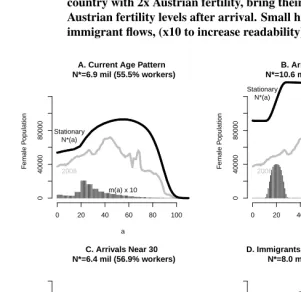
Panels A-D represent four examples of age-specific immigration policies: A. Identical to that observed in Austria 2010
B. Concentrated entirely between ages 11-29, with most immigrants near 20 C. Concentrated entirely between ages 21-39, with most immigrants near 30
D. 30-40 year olds are admitted, with their children, from populations with twice cur-rent Austrian fertility (thus, on arrival they have 2x as many children/woman as Austrians of the same age; after arrival they immediately adopt Austrian fertility levels)
All four stationary age distributions in Figure 1 have similar humped shapes, with a single peak. Because of the integral term in square brackets in (1), all four examples look quite different from a textbook stationary population in whichN∗(a)∝l(a).
As demonstrated by Arthur and Espenshade (1988), total stationary population size is sensitive to the immigrants’ arrival age distribution. In these examples, Austria’s female population would have limiting values between 6.4 million (Panel C) and 10.6 million (Panel B). The large variations in final population size arise almost entirely from differ-ences in reproductive value between younger and older immigrants. In Austria for exam-ple, each additional child born after immigration eventually addse(0)/(1−R) ≈ 260 people to the stationary population.
5.
Applications
One important application is studying immigration’s effects on dependency ratios. Rela-tionships (1) and (2) are theoretical and apply only in the very long run. However, they are a useful starting point for understanding the potentially significant effects of immigration policy on national age structure.
For example, to what extent can countries with below-replacement fertility use age-targeted immigration policies to raise the proportion of the population in working ages? Under what conditions do such immigration policies produce lower dependency ratios than replacement fertility? Wu and Li (2003) raised these important questions and arrived at an interesting result. They concluded that the proportion in working ages (e.g. 20-64) is higher in an SI population than in an RF population with the same mortality schedule, provided that immigrants arrive mostly around the youngest working age.
Relationship(1) and the numerical examples presented here show that Wu and Li’s (2003) conclusion about concentrating immigrants in young working ages needs modifi-cation. Such concentration is a sufficient, but not a necessary, condition for a lower-than-RF dependency ratio. In the Austrian case, for example,45L20/T0= 53.0percent of an
Demographic Research: Volume 26, Article 14
fractions in this age group, as indicated by the "% workers" data in the panel titles. This occurs even when the Wu and Li condition is not satisfied (Panels C and D).
Figure 1: Austrian 2008 female population (grey), and stationary
popula-tions with 46155 annual immigrants and varying distribupopula-tions of
arrival ages (black). TFR=1.41, R=0.68,e0 = 83. Panel A:
ob-served 2010 immigrant distribution. B: All immigrants arrive at ages 11-29 with most near 20. C: All immigrants arrive at ages 21-39 with most near 30. D: 30-40 year old immigrants arrive from a country with 2x Austrian fertility, bring their children, and adopt Austrian fertility levels after arrival. Small histograms represent immigrant flows, (x10 to increase readability)
a
F
emale P
opulation
0 20 40 60 80 100
0
40000
80000
A. Current Age Pattern N*=6.9 mil (55.5% workers)
2008
Stationary N*(a)
m(a) x 10
a
F
emale P
opulation
0 20 40 60 80 100
0
40000
80000
B. Arrivals Near 20 N*=10.6 mil (56.6% workers)
2008
Stationary N*(a)
m(a) x 10
a
F
emale P
opulation
0 20 40 60 80 100
0
40000
80000
C. Arrivals Near 30 N*=6.4 mil (56.9% workers)
2008
Stationary N*(a)
m(a) x 10
a
F
emale P
opulation
0 20 40 60 80 100
0
40000
80000
D. Immigrants 30−40 + Own Children N*=8.0 mil (54.8% workers)
2008
Stationary N*(a)
A variant of Relationship (2) gives the stationary number in working ages, which is useful for analyzing dependency in more detail. Define a dummy variablew(a) =I(20≤
a≤ 65)and defineew(z) = (
∫
w(a)l(a)da)/l(z)as the number of working years ex-pected after entry at agez. Following the same logic as in the proof of Relationship (2), the stationary number of workers is therefore
(3) NW∗ =
∫ ω
0
w(a)N∗(a)da= ∫ ω
0
[
eW(0)
1−Rv(z) +eW(z)
]
m(z)dz
and the stationary proportion in working ages is
NW∗ N∗ =
∫ ω
0
[
eW(0)
1−Rv(z) +eW(z)
]
m(z)dz
∫ ω
0
[
e(0)
1−Rv(z) +e(z)
]
m(z)dz
= ∫ ω
0
F(z)m(z)dz
∫ ω
0
G(z)m(z)dz
whereF(z)≥0andG(z)>0are age-specific functions that depend on the definition of working ages, and on fertility and mortality schedules. This proportion can be rewritten as a weighted mean
NW∗ N∗ =
∫ ω
0
γ(z)F(z)
G(z)dz
with non-negative weightsγ(z) = G(z)m(z)/∫0ωG(z)m(z)dz. Consequently, the sta-tionary proportion in working ages is maximized if all immigration is concentrated as closely as possible to thezvalue at whichF/Gis a maximum (or, if the maximum is not unique, then to any z values at whichF/Gis a maximum).
Figure 2 illustrates theF/Gfunction for the Austrian case and provides some insight about the underlying demographic processes. In Figure 2 the uppermost curve represents the proportion of the long-run foreign-born population in working ages if immigrants arrive at a single agez. This is maximized, as Wu and Li (2003) suggest, when immigrants are concentrated at the youngest working age. Thenative-bornstationary population will have a proportion working,eW(0)/e(0), that is independent of immigration policy; for
the Austrian case this is45L20/T0 = 53.0%, shown in the lower dashed line of Figure
Demographic Research: Volume 26, Article 14
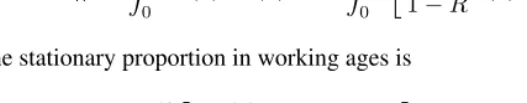
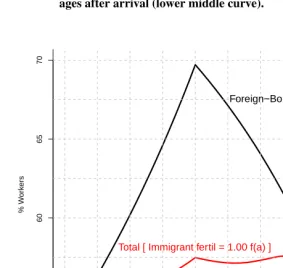
Figure 2: Proportion of the foreign-born, native-born, and total SI
station-ary population in working ages when immigrants are admitted ex-clusively at age z, at contemporary Austrian vital rates. Maximum for the total stationary population occurs at z=34 if immigrants immediately adopt native fertility on arrival (upper middle curve), or at z=35 if immigrant fertility is 150% of native fertility at all ages after arrival (lower middle curve).
0 10 20 30 40
55
60
65
70
Age at Entry (z)
% W
or
k
ers
Foreign−Born
Native−Born
Total [ Immigrant fertil = 1.00 f(a) ]
Total [ Immigrant fertil = 1.50 f(a) ]
the long-run proportion foreign rises enough to compensate for the falling (but higher-than-native) proportion of workers among the foreign-born.
The result for Austria is a long-run maximum proportion in working ages ifz = 34 (orz = 35if immigrants have 150% of native fertility at each age). This is far from the beginning of working life. From the upper middle curve in Figure 2, the highest possible proportion of workers in an SI population for Austria occurs if all immigrants are 34 years old on arrival: this stationary population would have 4.0 million females, with 57.6% in working ages. One can also see from Figure 2 that immigration flows at all ages less than 43 produce stationary populations with higher proportions of workers than the RF stationary population (in which the population is 100% native-born and 53.0% are in working ages).
The Austrian example shows that it is not necessary to concentrate immigrant inflows near age 20 to get a lower long-run dependency ratio. Compared to a return to replacement fertility, in Austria an SI population with any distribution of immigrant arrival ages over 0-43 will produce an equal or higher proportion in working ages and a lower dependency ratio. In other low-fertility countries with similar vital rates, results would be similar.
6.
Acknowledgements
Demographic Research: Volume 26, Article 14
References
Arthur, W. and Espenshade, T. (1988). Immigration policy and immigrants’ ages. Popu-lation and Development Review14(2): 315–326.doi:10.2307/1973574.
Dawid, H., Feichtinger, G., Goldstein, J., and Veliov, V. (2009). Keeping a learned society young.Demographic Research20(22): 541–558.doi:10.4054/DemRes.2009.20.22.
Espenshade, T., Bouvier, L., and Arthur, W. (1982). Immigration and the stable population model.Demography19(1): 125–133.doi:10.2307/2061132.
Feichtinger, G. and Steinmann, G. (1992). Immigration into a population with fertility below replacement level - the case of germany. Population Studies 46(2): 275–284.
doi:10.1080/0032472031000146236.
Human Fertility Database (2008). http://www.humanfertility.org (13 May 2011).
Human Mortality Database (2011). http://www.mortality.org (13 May 2011).
Mitra, S. (1990). Immigration, below-replacement fertility, and long-term national popu-lation trends.Demography29(4): 595–612.doi:10.2307/2061854.
Schmertmann, C. (1992). Immigrants’ ages and the structure of stationary populations with below-replacement fertility. Demography 29(4): 595–612.
doi:10.1080/08898480306715.
Statistik Austria (2011). Außenwanderung 2010 nach Alter, Geschlecht und Staatsange-hörigkeit. http://www.statistik.at/web_de/static/aussenwanderung_2010_nach_alter_ geschlecht_und_staatsangehoerigkeit_022925.xlsx (16 November 2011).
Wu, Z. and Li, N. (2003). Immigration and the dependency ratio of a host population.