2012 NRITLD, National Research Institute of Tuberculosis and Lung Disease, Iran ISSN: 1735-0344 Tanaffos 2012; 11(1): 18-25
Predicted Values of Cardiopulmonary Exercise Testing in
Healthy Individuals (A Pilot Study)
Majid Malek Mohammad 1, Shahdak
Dadashpour 1, Parisa Adimi 2
Background: Cardiopulmonary exercise testing evaluates the ability of one’s cardiovascular and respiratory system in maximal exercise. This was a descriptive cross-sectional pilot study conducted at Masih Daneshvari Hospital in order to determine predicted values of cardiopulmonary exercise testing in individuals with normal physical activity patterns.
Materials and Methods: Thirty four individuals (14 women, 20 men) between 18-57 years of age were chosen using simple sampling method and evaluated with an incremental progressive cycle-ergometer test to a symptom-limited maximal tolerable work load. Subjects with a history of ischemic heart disease, pulmonary disease or neuromuscular disease were excluded from the study. Smokers were included but we made sure that all subjects had normal FEV1 and FEV1/FVC.
This study aimed to compare measured values of VO2, VCO2, VO2/Kg, RER,
O2pulse, HRR, HR, Load, Ant, BF, BR, VE, EQCO2, and EQO2 with previously
published predicted values.
Results: We found that our obtained values for VO2 max, HRR max and HR
max were different from standard tables but such difference was not observed for other understudy variables. Multiple linear regression analysis was done for height, weight and age (due to the small number of samples, no difference was detected between males and females). VO2 max and load max had reverse
correlation with age and direct correlation with weight and height (P<0.05) but the greatest correlation was observed for height.
Conclusion: Due to the small number of samples and poor correlations it was not possible to do regression analysis for other variables. In the next study with a larger sample size predicted values for all variables will be calculated. If the future study also indicates a significant difference between the predicted values and the reference values, we will need standard tables made specifically for our own country, Iran.
1 Tracheal Diseases Research Center, 2 Chronic
Respiratory Diseases Research Center, NRITLD,
Masih Daneshvari Hospital, Shahid Beheshti University of Medical Sciences, Tehran, Iran.
Received: 18 January 2011 Accepted: 8 September 2011
Correspondence to: Adimi P
Address: NRITLD, Shaheed Bahonar Ave,
Darabad, TEHRAN 19569, P.O:19575/154, IRAN Email address: [email protected]
Key words: Cardiopulmonary exercise test, Ergospirometry, Maximal exercise capacity
INTRODUCTION
Oxygen transfer for supporting the energy needs of muscle cells (especially the heart muscles) and excretion of CO2 as a by-product of metabolism have utmost
importance during exercise.
Cardiopulmonary exercise testing (CPET) is used to generally evaluate the response of various organs and cardiovascular, pulmonary, circulatory, neural and musculoskeletal systems to maximal exercise. Assessment
of the function of each of the mentioned systems alone cannot yield such result.
By using this dynamic and relatively non-invasive method we can evaluate one’s physiologic and pathologic response to maximal exercise.
CPET can provide so much information while a simple cardiac exercise test can only determine the presence or absence of myocardial ischemia (1).
Indications of CPET include evaluation of the exercise capacity and reasons why exercise is not tolerated (2, 3), unexplained dyspnea (4-7), evaluation of patients with cardiovascular disease (8-10), assessment of patients with respiratory diseases (11), pre-operative evaluations (12), and pulmonary rehabilitation (13-16).
CPET has long been the subject of interest to many researchers. For example, in 1972 Bruce et al. evaluated the maximal oxygen intake among males and females and predicted the mean normal values for healthy individuals based on their age, sex and physical activity using regression equations (17).
In 1975 Drinkwater et al. designed a study to show how age and physical activity patterns affect women’s response to maximal exercise (18).
Some other studies were conducted by Jones et al. in 1985 (19) and Blackie et al, in 1989 (20) and 1994 (21) and prediction equations were calculated for different variables using linear regression.
Considering the high applications of CPET and lack of a study determining reference values and also easy accessibility of CPET in Masih Daneshvari Hospital we decided to perform such a study in this center.
MATERIALS AND METHODS
Study design:
This was a descriptive cross-sectional study conducted as a pilot study for a larger one evaluating a larger population of healthy individuals.
A total of 34 subjects (14 women and 20 men) in the age range of 18 to 57 years were selected using simple sampling method.
The general goal of the study was to determine the predicted values for ergospirometry test in healthy individuals with normal physical activity patterns presenting to Masih Daneshvari Hospital. The specific goals were to determine the normal values of load, HR, HRR, O2 pulse, VO2, VO2/kg, VCO2, RER, BF, AT, EQO2,
EQCO2, VE and BR in these cases during maximal exercise.
The hypothesis to be proved was that the normal ergospirometry test values measured in normal healthy Iranians were in accord with international reference values.
Protocol:
Subjects were provided with instructions before the study through which they were informed about the necessary preparations required for exercise testing. For example, subjects should not have intense physical activity during the last 4 hours before testing and should not eat or drink caffeinated beverages or smoke in the last 2 hours. A history was taken from all subjects and a physical examination was done for them. Smokers underwent pulmonary function test (PFT) and EKG was performed for all subjects over the age of 55 yrs.
Data were recorded in the prepared questionnaires. Subjects were well informed about the test and a written consent was obtained from them.
Clinical and functional evaluations:
Upon admission, a history was taken from all subjects and presence of any risk factors for cardiac, respiratory or neuromuscular diseases was evaluated and noted in the questionnaire. All subjects underwent physical examination and height and weight measurement, cardiac, pulmonary, neuromuscular, skin and abdominal examinations were performed. EKG was performed for all subjects over the age of 55 yrs and PFT was conducted for smokers. Ergospirometry exercise testing was then performed for all subjects.
Those who had a normal history and physical examination and if smoking, had FEV1 over 80% and normal FEV1/FVC were included in the study (understudy subjects all had normal physical activity patterns like walking and did not have a sedentary life style).
Subjects who had a positive history, their physical examination showed any sign of cardiac, respiratory, or neuromuscular diseases, developed arrhythmia or hypotension or their EKG showed ischemic findings during exercise testing under the supervision of a physician and also those over 55 yrs with abnormal EKG were excluded from the study.
1) 2 minutes of resting
2) 3 minutes exercise below the actual level of work load and then reaching up to 60 cycles per minute
3) Incremental phase
4) 4 minutes of recovery phase
The exercise work load increases constantly ( 15-25 W/min in women and 25-30 W/min in men). Therefore, each test takes about 8 to 12 minutes to accomplish.
The criteria for reaching maximum capacity were one or more of the followings:
1) Reaching a plateau in VO2
2) Maximum heart rate more than 90% of the predicted value for that age (age-220)
3) RER more than 1/15 (although RER values are not exactly indicative of maximum capacity)
Data were automatically processed using standard formula (based on the reference values) and were shown as descriptive figures.
The amount of variables including VO2 (L/min),
VCO2(L/min), VO2/kg (ml/min/kg), load (W/min), HR
(b/min), HRR (b/min), O2 pulse (ml/beat), RER and VCO2
(L/min), EQO2, EQCO2, VE (L/min), BR (%), BF (L/min)
and Ant were calculated.
RESULTS
Analysis of this study was conducted in 2 phases:
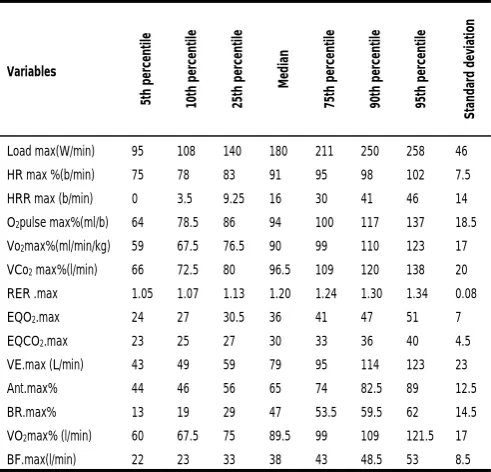
1) Descriptive phase: in this phase, mean and standard deviations for age, sex, height, weight, HR, BMI and BP (systolic and diastolic)(Tables 1 and 2) and variables obtained from CPET at maximal exercise were calculated (Table 3) and compared with reference values. Also, the obtained data were compared between males and females using t test (Tables 4, 5 and 6).
Table 1. Demographic and anthropometric characteristics of understudy
subjects.
Variables
5
th per
cent
ile
10
th per
cent
ile
25
th per
cent
ile
Medi
an
75
th per
cent
ile
90
th per
cent
ile
95
th per
cent ile Sta ndard dev iati on
Age (yrs) 20 23 30 36 47 54 56 11.5 Height (cm) 152 157 165 171 178 184 185 9 Weight (kg) 56 60 66 75 84 101 105 15 BMI (kg/m²) 20 22 24 25 29 31 32 17
Table 2. Clinical characteristics of understudy subjects.
Variables 5th p ercen tile 10th perce nti le 25th perce nti le Medi an 75th perce nti le 90th perce nti le 95th perce nti le Standa rd deviati on HR(b/min) At rest
69 70 73 78 80 85 85 5
SBP(mmHg) 110 110 119 120 130 130 130 6.7 DBP(mmHg) 55 58 60 60 65 70 85 6.5
Table 3. Amount of CPET variables for understudy subjects.
Variables 5t h p er cen til e 10 th p er cen til e 25 th p er cen til e Me di an 75 th p er cen til e 90 th p er cen til e 95 th p er cen til e St an da rd d evi ati on
Load max(W/min) 95 108 140 180 211 250 258 46
HR max %(b/min) 75 78 83 91 95 98 102 7.5
HRR max (b/min) 0 3.5 9.25 16 30 41 46 14
O2pulse max%(ml/b) 64 78.5 86 94 100 117 137 18.5
Vo2max%(ml/min/kg) 59 67.5 76.5 90 99 110 123 17
VCo2max%(l/min) 66 72.5 80 96.5 109 120 138 20
RER .max 1.05 1.07 1.13 1.20 1.24 1.30 1.34 0.08
EQO2.max 24 27 30.5 36 41 47 51 7
EQCO2.max 23 25 27 30 33 36 40 4.5
VE.max (L/min) 43 49 59 79 95 114 123 23
Ant.max% 44 46 56 65 74 82.5 89 12.5
BR.max% 13 19 29 47 53.5 59.5 62 14.5
VO2max% (l/min) 60 67.5 75 89.5 99 109 121.5 17
BF.max(l/min) 22 23 33 38 43 48.5 53 8.5
Table 4. Comparison of anthropometric and demographic characteristics of
understudy men and women,
Variables Women (n=14) Men (n=20)
Age (yrs) 42±13 35±10 Height (cm) 164±7 176±6 Weight (kg) 65±7 85±14 BMI (kg/m²) 25±3.5 27±3
Table 5. Comparison of clinical characteristics between understudy males and
females.
Variables Women (n=14) Men (n=20)
Resting HR (b/min) 77±5 76±6 SBP (mmHg) 121±7 122±7
Table 6. Comparison of the amount of CPET variables between males and females in our study.
Variables Women (n=14) Men (n=20)
Load max (w/min) 138 ± 33 205 ± 33 HR Max% (b/min) 89 ± 9 89±7 HRR Max (b/min) 18.5±16 20±13 O2 pulse max% (ml/b) 100±24 92±13 VO2/kg max%(ml/min/kg) 95±20 85±13
EQO2.max 38±8.5 38±6
VCO2 max% (L/min) 100±25 93±17
EQCO2.max 32±5 29±3.5
RER.max 1.19±0.1 1.19±0.06 VE.max(L/min) 63.5±18 88±21
Ant.max% 67±15 63±11
BR.max% 40±15 44±14
Vo2 max%(L.min) 95±20 84.5±13 BF.max (L/min) 39±8 36±9
2) Multiple linear regression was performed to determine normal values for each variable. The results in this regard are presented in Table 7 and Figures 1 to 6.
This study was conducted aiming at evaluation of cardiovascular and pulmonary system responses during an incremental progressive cycle ergometer test in healthy subjects with normal physical activity patterns and the following results were obtained:
The mean ±SD for VO2max% was 89.5%±17 L/min (95%±20 in women and 84.5%±13 in men). The standard reference for this variable is 84%.
The mean HR max was 91%±7.5 b/min (89%±9 b/min in women and 89%±7 b/min in men) which was significantly different than the suggested reference rate of over 90% as normal.
The mean HRR max was 16±14 b/min (18.5±16 b/min in women and 20±13 b/min in men) which was different that the standard reference value of below 15.
The mean pulse O2 max was 94%±18.5 ml/b (100%±24 in women and 92%±13 in men). The reference normal value is 80%.
Table 7. VO2max (L/min) and load (W/min) during cycle ergometry (linear
prediction equations).
Variables Age Weight Length R2
VO2 -0.28 (p=0.052) 0.024 (p<0.001) - 0.36
-0.137 (p=0.36) - 0.044 (P<0.001) 0.44
Load -0.0157(P=0.281) - 3.6 (p<0.001) 0.49
-1.2 (p<0.05) 1.8(p<0.001) - 0.53
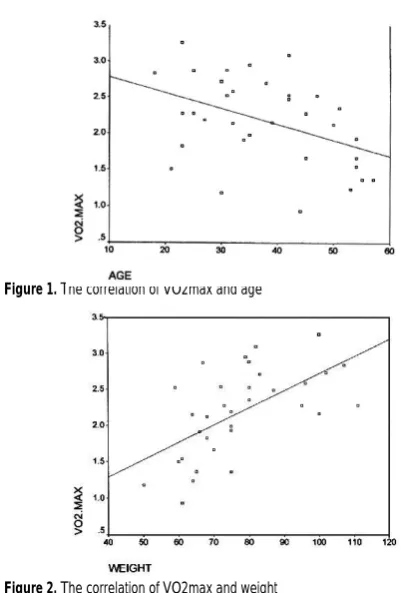
Figure 1. The correlation of VO2max and age
Figure 2. The correlation of VO2max and weight
Figure 3. The correlation of VO2max and height
Figure 5. The correlation of load max and weight
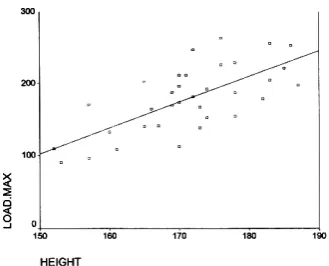
Figure 6. The correlation of load max and height
The mean VR or BR max was 47±14.5% (40%±15 in women and 44%±14 in men) which was in accord with the suggested reference value of below 85%.
The mean BF max was 38±8.5 L/min (39±8 L/min in women and 36±9 in men) which was within the standard normal range of below 60 b/min.
The mean EQCO2 max was 30±4.5 which was similar to the standard normal reference of below 34.
The mean rate of Ant max was 65%±12.5 of the predicted VO2 max which was within the standard range (more than 40% of the predicted VO2max).
The mean load max was 180±46 W/min (138±33 in women and 205±33 in men).
The mean VO2/kg max was 90%±17 ml/min/kg (95%±20 in women and 85±13 in men).
The mean VCO2max was 96.5%±20 L/min (100%±25 in women and 93%±17 in men).
The mean RER max in this study was 1.20±0.08 and most studies considered the rate over 1.15 as normal.
The mean EQO2 max was 36±7 (38±8.5 in women and 38±6 in men).
The mean VE max was 79±23 L/min (63.5%±18 L/min in women and 88±21 L/min in men).
Unfortunately no data was available regarding the standard normal values for load, VO2/kg, EQO2, VE and VCO2 and therefore, we could not make a comparison for these variables.
After calculating the mean ±SD for variables and comparison between males and females, linear regression analysis was performed for determination of normal values.
Since this was a pilot study, correlations based on gender were not significant due to the small number of under study subjects and therefore analyses were performed in both sexes together.
Regression analysis was performed for VO2max and load max. VO2max decreased by advanced age (P-value=0.012 and correlation coefficient=-0.425).
By increasing age, an elevation was observed in VO2 max (P-value=0.001 and correlation coefficient=0.601). By increased height, VO2max increased as well (P-value=0.001, correlation coefficient=0.666).
The greatest correlation however was observed between VO2max and height whereas, in some other studies like Neder et al. study in 1992, the greatest correlation was observed between VO2 max and age.
A prediction equation for VO2max was calculated using linear regression as follows:
VO2max=-5.3+0.044 (height)(R²=0.44)
The greatest correlation was observed between load max and height.
The prediction equation for load max was calculated using linear regression as follows:
Load max=-436-1.2 (age)+1.8 (weight)(R²=0.53) Load max=-436+3.6 (height)(R²=0.49)
When evaluating the correlation of other variables with age, height and weight, a direct correlation was found between O2 pulse and height (P-value=0.001, correlation coefficient=0.676).
A direct relationship was also observed between O2pulse and weight (P-value=0.001, correlation coefficient=0.722).
However, no correlation was detected between O2pulse and age (P-value greater than 0.05) and since height and weight were correlated with each other, conduction of regression analysis was not possible.
VE max had a direct relationship with height (P-value=0.001 and correlation coefficient=0.549) and weight (P-value=0.019 and correlation coefficient=0.401). However, no such correlation was observed with age (P-value>0.05) and therefore regression analysis could not be performed.
For other variables, due to the poor correlation with age, weight, height and gender, the R squared was very tiny and had low predictive value due to the small number of samples. In the next study which is going to be performed on a larger sample size regression analyses can be easily performed for all variables.
DISCUSSION
CPET in our country, Iran, is usually performed according to the standards of foreign countries and the results are interpreted mainly based on ATS reference values (22). Considering the ethnic, geographical and behavioral differences between Iranians and people of other nationalities, a new definition for normal values of CPET in Iran seems necessary. In spite of ethnical and climate differences, Iranians are less interested in physical activities and have unhealthy eating habits that separates
our citizens from other nationalities. The mentioned facts enlighten the need for such study.
In this study, the ATS criteria and guidelines were considered for initiation and termination of the test. By performing this test, we can somehow differentiate the pulmonary causes of dyspnea from each other and from its cardiac etiologies.
In some centers during CPET, pulse oximetry is used instead of the measurement of arterial blood gases and ABG is done if the arterial oxygen saturation rate drops. Considering the limitations in our study, we only used pulse oximetry and since the understudy subjects were healthy and normal, no decrease was observed in their arterial oxygen saturation rate.
Regarding the observed differences between our obtained mean values and standard references especially in VO2max, HRR max and HR max three hypotheses are suggested:
1) Considering the small number of samples, these differences are not much acceptable and such differences may not exist or may be insignificant in the next study that is going to be conducted on a larger population.
2) If such differences were observed in the next study too, ethnic differences might be the cause and if so, the results of the exercise test of Iranians should be compared with our own standard normal values. 3) Although understudy subjects mentioned no history
of cardiovascular or pulmonary diseases and were doing daily exercise, there was a possibility of presence of underlying conditions in them and further evaluations might be required in this respect.
In conclusion, in order to answer the above mentioned questions another study on a larger sample size is required to obtain normal values for different variables with greater confidence.
Abbreviations
RGR: Respiratory equivalent ratio; HRR: Heart rate reserve;
Ant: Anaerobic threshold; BF: Breathing Frequency; BR: Breath rate;
VE: Minute Ventilation; EQCO2: Ventilatory equivalent for CO2; EQO2:
Ventilatory equivalent for O2; VO2: O2 consumption; VCO2: CO2
production; VO2max: Maximal O2 consumption
REFERENCES
1. Wasserman K, Hansen JE, Sue DY, Whipp BJ, Casaburi R.
Principle of exercise testing and interpretation: including
pathophysiology and clinical applications, 3rd ed.
Philadelphia: Lippincott Williams& Wilkins; 1999.p.xv.
2. Hamilton AL, Killian KJ, Summers E, Jones NL. Muscle
strength, symptom intensity, and exercise capacity in patients
with cardiorespiratory disorders. Am J Respir Crit Care Med
1995; 152 (6 Pt 1): 2021- 31.
3. Killian KJ, Leblanc P, Martin DH, Summers E, Jones NL,
Campbell EJ. Exercise capacity and ventilatory, circulatory,
and symptom limitation in patients with chronic airflow
limitation. Am Rev Respir Dis 1992; 146 (4): 935- 40.
4. Weisman IM, Zeballos RJ. Cardiopulmoanry exercise testing.
Pulm Crit Care Update 1995; 11:1-9.
5. Gibbons RJ, Balady GJ, Beasley JW, Bricker JT, Duvernoy WF,
Froelicher VF, et al. ACC/AHA Guidelines for Exercise
Testing. A report of the American College of
Cardiology/American Heart Association Task Force on
Practice Guidelines (Committee on Exercise Testing). J Am
Coll Cardiol 1997; 30 (1): 260- 311.
6. Pratter MR, Curley FJ, Dubois J, Irwin RS. Cause and
evaluation of chronic dyspnea in a pulmonary disease clinic.
Arch Intern Med 1989; 149 (10): 2277- 82.
7. Gay SE, Weisman IM, Flaherty KE, Martinez FJ.
Cardiopulmonary exercise testing in unexplained dyspnea. In:
Weisman IM, Zeballos RJ, editors. Clinical exercise testing.
Basel, Switzerland: Karger; 2002. p. 81-88.
8. Mancini DM, Eisen H, Kussmaul W, Mull R, Edmunds LH Jr,
Wilson JR. Value of peak exercise oxygen consumption for
optimal timing of cardiac transplantation in ambulatory
patients with heart failure. Circulation 1991; 83 (3): 778- 86.
9. Stevenson LW. Role of exercise testing in the evaluation of
candidates for cardiac transplantation. In: Wasserman K, ed,
Exercise gas exchange in heart disease. Armonk, NY: Futura
Publishing . 1996: 271-286.
10. Stelken AM, Younis LT, Jennison SH, Miller DD, Miller LW,
Shaw LJ, et al. Prognostic value of cardiopulmonary exercise
testing using percent achieved of predicted peak oxygen
uptake for patients with ischemic and dilated
cardiomyopathy. J Am Coll Cardiol 1996; 27 (2): 345- 52.
11. Nohria A, Lewis E, Stevenson LW. Medical management of
advanced heart failure. JAMA 2002; 287 (5): 628- 40.
12. Older P, Smith R, Courtney P, Hone R. Preoperative
evaluation of cardiac failure and ischemia in elderly patients
by cardiopulmonary exercise testing. Chest 1993; 104 (3):
701-4.
13. Wensel R, Opitz CF, Ewert R, Bruch L, Kleber FX. Effects of
iloprost inhalation on exercise capacity and ventilatory
efficiency in patients with primary pulmonary hypertension.
Circulation 2000; 101 (20): 2388- 92.
14. Casaburi R, Patessio A, Ioli F, Zanaboni S, Donner CF,
Wasserman K. Reductions in exercise lactic acidosis and
ventilation as a result of exercise training in patients with
obstructive lung disease. Am Rev Respir Dis 1991; 143 (1):
9-18.
15. Ries AL. The importance of exercise in pulmonary
rehabilitation. Clin Chest Med 1994; 15 (2): 327- 37.
16. Punzal PA, Ries AL, Kaplan RM, Prewitt LM. Maximum
intensity exercise training in patients with chronic obstructive
pulmonary disease. Chest 1991; 100 (3): 618- 23.
17. Bruce RA, Kusumi F, Hosmer D. Maximal oxygen intake and
nomographic assessment of functional aerobic impairment in
cardiovascular disease. Am Heart J 1973; 85 (4): 546- 62.
18. Drinkwater BL, Horvath SM, Wells CL. Aerobic power of
19. Jones NL, Makrides L, Hitchcock C, Chypchar T, McCartney
N. Normal standards for an incremental progressive cycle
ergometer test. Am Rev Respir Dis 1985; 131 (5): 700- 8.
20. Blackie SP, Fairbarn MS, McElvaney GN, Morrison NJ, Wilcox
PG, Pardy RL. Prediction of maximal oxygen uptake and
power during cycle ergometry in subjects older than 55 years
of age. Am Rev Respir Dis 1989; 139 (6): 1424- 9. Erratum in:
Am Rev Respir Dis 1990; 141 (5 Pt 1): 1380.
21. Fairbarn MS, Blackie SP, McElvaney NG, Wiggs BR, Paré PD,
Pardy RL. Prediction of heart rate and oxygen uptake during
incremental and maximal exercise in healthy adults. Chest
1994; 105 (5): 1365- 9.
22. ATS/ ACCP Statement on Cardiopulmonary Exercise Testing