INTERNATIONAL JOURNAL FOR MATHEMATICS TEACHING AND LEARNING 2019, Vol. 20.1, 33-61
Mathematical Representational Code Switching
Michael J. Bossé
Appalachian State University
Anass Bayaga
University of Zululand
Catherine Fountain
Appalachian State University
Erica Slate Young
Appalachian State University
This study investigates representational code-switching (RCS) by considering three high school students’ communications in the process of comparing and contrasting pairs of representations (e.g., equation and graph) in the context of rational functions. Supporting this study is research in the realms of students interacting with mathematical representations, practicing language learning, and linguistic code-switching (LCS). Attention is given to assessing student mathematical understanding based on frequency and type of RCS performed. This investigation concludes that RCS demonstrates either weaker or stronger mathematical performance depending on whether the RCS evidences semantic elaboration, isomorphic and transcendent connections, and domain register knowledge.
In the context of mathematical representations (e.g., numbers or tables, algebraic or symbolic, graphs or depictions, and verbal), there are many studies regarding students performing translations, cognitive processes associated with student work, patterns of student errors and such. Notably, each of these representations is coded by its unique vocabulary, nomenclature, and quite specific conceptual context.
At the same time, a rich body of literature speaks to dimensions regarding language acquisition and linguistic code-switching (LCS). When mathematical representations are perceived as having similarities to linguistic codes, the well-researched realm of LCS might shed new light on student mathematical activity. Assessment of student mathematical understanding may be associated with different styles and frequency of what is denoted in this study as representational code-switching (RCS), where students employ the alternating use of different vocabulary and associated concepts between two or more mathematical representations. For instance, students may discuss the “x-intercepts” (a concept contextualized in a graph) of a function provided in symbolic form or students may investigate a graph and say that “x – 3 is a factor of the graph”, when “factor” is a notion contextualized in the symbolic form of a function. A more expansive definition of RCS is provided later in this paper.
The context of rational functions, when considered across mathematical representations, is a topic which suggests a rich window through which to investigate student communication and RCS, as will come apparent in this study. The primary purpose of this paper is to introduce and investigate the nature of RCS and make connections through such to assessing student understanding.
Literature Review
learning. As the notion of RCS is somewhat novel, additional detail is provided through associated background literature regarding LCS to develop a rationale for the validity of this construct and later demonstrate commonalities with RCS. In this review, the literature is considered in a number of interconnected domains: linguistic code-switching (LCS); linguistic code-switching in mathematical learning; understanding mathematical representations; and representational code-switching in mathematics.
Linguistic Code-Switching
Linguistic code-switching (LCS), broadly defined as “the alternating use of different languages in a given situation” (Sankoff & Poplack, 1981, p 3) has been studied since the 1970s. The focus of most LCS research in bilingual communities and individuals has been on defining the possible loci of change between languages and determining what situations, topics, or linguistic constructions may motivate the switch (McClure & Wentz, 1975; Myers-Scotton, 1995; Poplack, 1980; Ramsay-Brijball, 1999; Sankoff & Poplack, 1981). Key findings from these studies are that for bilingual individuals LCS follows certain rules and patterns based on linguistic structures and is commonly motivated by social, cultural, communicative, and cognitive contexts within conversations. More recently, LCS has also been studied among language learners in classroom contexts; i.e. among individuals who may not be fully proficient in both languages. Findings in both areas of study within LCS are relevant to the present study and are outlined in the following paragraphs.
It is worth asking from the outset why any parallel can or should be drawn between linguistic and mathematical code-switching. If, following Chomsky (1975, 1986), all human languages share key structures, including a lexicon, a set of sounds, and a means for combining words into phrases, does LCS actually involve a change in mental representation that might have a parallel in other areas of cognition? In fact, this assumption underlies LCS research; Sankoff and Poplack (1981) make it clear that LCS should be distinguished from other phenomena related to language contact in large part because in LCS the distinct properties of each language involved are kept intact. The use of the term “code” itself reflects a recognition that each language is a code with its own attributes: its own lexicon (the vocabulary of a person or language, often contextualized in a branch of knowledge), phonology (how sounds are organized, patterned, and used in natural languages), and syntactic structures (the rules, patterns, or structures through which words are ordered to create meaning), and that LCS involves switching between these different mental representations of language. Differences in mental representation have been particularly highlighted in studies on code-switching between spoken and signed languages (Tang, 2016), but other studies have shown that within the mind of a bilingual speaker, each language or code may also be associated with certain situations, fields of knowledge, groups of people, or ways of thinking, and use of one code rather than another can allow speakers to express concepts in different ways (McClure & Wentz, 1975; Myers-Scotton, 1995). LCS can thus be seen as a cognitive resource available to bilingual individuals that allows them to frame communication in different ways in different situations. The differences in linguistic structures between languages as well as differences in an individual’s mental lexicon for each language means that LCS allows for clarification of concepts through the choice of linguistic representation.
within a community and within a given educational system is essential in terms of interpreting LCS in the school setting (Moschkovich, 2005; O’Keeffe & Ní Ríordáin, 2012; Then & Ting 2011). Investigating code-switching in primary schools in South Africa, Ncoko, Osman, and Cockcroft (2000) highlight both the highly plurilingual nature of South African society and the position of prestige occupied by English within the educational system as important social contexts for understanding LCS. They note that previous studies found LCS between English and isiZulu to be motivated by factors including the topic of conversation, the status of the speakers, and each speaker’s role in the conversation, as well as the general context of the conversation. Ncoko, Osman, and Cockcroft (2000) considering students in a school where English was the sole language of instruction, find that along with serving as a marker of identity and solidarity, LCS can be used for purposes of quotation, clarification, and reiteration, reinforcing the idea of LCS as a cognitive resource for the expression of concepts. In another study examining high school science teachers’ use of LCS between English and Bahasa Malaysia, Then and Ting (2011) find reiteration and quotation to be the most frequent functions of LCS. When employed by teachers in a classroom setting, LCS is less likely to fulfil a social function.
Language proficiency can also serve a role in LCS in educational settings (Matejko and Ansari, 2016; Mati, 2002; O’Keeffe & Ní Ríordáin, 2012). Specifically, it is suggested that in educational settings in which instruction is conducted mainly in a language that is not students’ home or community language, academic proficiency in the language of instruction correlates with first language academic competence (Samad, 2012). The implication is that learners perform better in the second language if the academic skills in the first language are well-developed, allowing for effective LCS (Matejko & Ansari, 2016; Mati, 2002; O’Keeffe & Ní Ríordáin, 2012), likely because key academic skills, ideas, and concepts are easily transferred across languages. There is also the need to cultivate communicative, interpretive, and understanding skills which invariably are the first skills acquired during first language acquisition. This is particularly important in countries where multilingualism or bilingual education is prevalent, including Sub-Saharan countries such as South Africa, Zambia, Zimbabwe, Malawi, Botswana, and Namibia. Marji (2009) suggests that such countries have had consistent, positive results when they offer bilingual education in the learner’s mother language as well as in English.
challenges in translation of ideas and concepts used in instructional language (Webb & Webb 2008). Prior and Gollan (2011) suggest that “habitual language-switching leads to more efficient switching in both linguistic and non-linguistic tasks, supporting previous claims that language control and cognitive control share common mechanisms,” (p. 689), but also note that their analysis is complicated by individual speakers’ educational and socioeconomic backgrounds as well as their level of bilingualism. These findings, while mixed in their conclusions, support the idea that LCS is a common cognitive practice for individuals who have more than one mode of linguistic representation at their disposal, but that it is unclear whether or not LCS should always be viewed as an indicator of high-level proficiency in both languages.
LCS in Mathematical Learning
Bossé et al. (2018b) and Bossé (2018a) integrate research from a number of realms including: primary language acquisition, second language acquisition, stage learning theories and sociocultural psychology, and models and theories of mathematical learning. This synthesis of these fields argues that mathematics learning shares numerous characteristics with second language acquisition. Thus, LCS, as associated with language acquisition, may be applicable in some ways to mathematic learning.
Numerous purposes have been applied to LCS, for example, explaining new ideas; clarifying statements and questions; emphasizing points; and making connections with learner’s own context and experience (e.g., Ncoko, Osman, & Cockcroft, Then & Ting, 2011). While there currently seems to be a lack of empirical evidence suggesting that these factors enhance the learning of mathematics, O’Keeffe and Ní Ríordáin (2012) opine that the general agreement is, nevertheless, that “learners should be afforded a chance to discuss in their mother language so that they can develop mathematical thinking” (p. 3). In contrast, Mahofa (2014) reveals that “…learners who used English entirely had an advantage in dealing with mathematical word problems, since these learners were familiar with the mathematical language used compared to learners who used code switching only” (p. 107). Moschkovich (2005) notes that when studying LCS in the mathematics classroom, it is also essential to consider “the student’s experiences with each language in and out of school, in particular, past experiences with mathematics instruction in each language” (p. 132) Thus, whether a given student has had experience learning mathematical concepts in only one language or in multiple languages will likely have an impact on both the extent and nature of code-switching in mathematical explanations as well as the student’s success in handling problems in a given language.
Following the arguments reported thus far, the conclusions drawn from the literature are that: there exist social, contextual, and subject-specific difficulties in LCS and possibly translation; while the contexts in which LCS occurs generally have been well-studied, there is no generally acceptable understanding of the frequency of LCS in mathematical contexts; and no established mathematical concepts are widely recognized to more greatly benefit more than others from LCS in the classroom.
Mathematical Representations and Learning
Mathematical representations encode and communicate mathematical ideas, connect mathematical ideas to grander fields of reference, and provide mechanisms through which ideas can be further investigated and modified. Notably, different representations employ different nomenclature to communicate ideas.
In educational realms, mathematical representations can assist to make abstract mathematical concepts accessible to students (Goldin, 2002) and enable bidirectional student-teacher communication of mathematical ideas and understanding (Lesh, Post, & Behr, 1987). Indeed, researchers recognize the centrality of representations in mathematics instruction and learning (e.g., Brenner, et al, 1997; Brenner, Herman, Ho, & Zimmer, 1999; Knuth, 2000) and many note the advantages in learning through multiple representations (e.g., Acevedo Nistal, et al, 2009; Ainsworth, 2006; Rau, 2016). Some equate mathematics learning with exploring representations and their inter-relations of ideas presented (McKendree, Small, Stenning, & Conlon, 2002).
Representational Determinism. While representations encode mathematical ideas, they do so by only partially communicating foundational mathematical ideas, ignoring other ideas, and possibly distorting others (Goldin & Shteingold, 2001). Each representation can be characterized through its unique representational determinism (Zhang, 1997) which connotes: the mathematics that can be perceived, communicated or distorted; the mathematical processes and actions that can be employed; and the mathematical notions and fields of reference that can be investigated. In respect to particular tasks, even different forms of the same representation provide different opportunities for operations, communication, and investigation (McKendree et al., 2002). Representational determinism (Zhang, 1997) argues that each representation reveals particular information and conceals other information (Bossé, Lynch-Davis, Adu-Gyamfi, & Chandler, 2016). For instance, a table may reveal zeros of a function without being sufficiently revelatory of the global nature of the function. Comparatively, a graph may reveal the global nature of a function and only allow the estimation of the location of roots. Additionally, each representation possesses a greater or lesser amount of confounding facts (Adu-Gyamfi, Stiff, & Bossé, 2012; Bossé, Adu-Gyamfi, & Chandler, 2014). These are characteristics or attributes which may perturb a student’s interpretation or interaction with a representation. While, altogether, each representation reveals and conceals information, depicts both relevant and irrelevant information, and contains a greater or lesser amount of confounding facts, these dimensions are subjective in respect to the students. While some aspects of a representation may confound some students, it may be of little concern to others.
Types of Elaborations. Kaput (1987) and others (e.g., Adu-Gyamfi, Bossé, & Chandler, 2015a; Bossé, Adu-Gyamfi, & Chandler, 2014) articulate that students can interact with mathematical representations in one of two ways. Employing syntactic elaboration, some students interpret a representation and act upon it based on the characteristic structure of the representation. For instance, they may locally recognize the constants, variables,
exponents, operations, and functional notation within the expression .
They may even recognize that the leading coefficient indicates the extreme behavior of the graph of the function, the y-intercept at 12, and that the function is factorable to . While they may globally recognize that the function is a polynomial or a quadratic, they utilize facts associated with the symbolic representation of the function rather than their understanding of the holistic nature of quadratics and polynomials.
Students who employ semantic elaboration focus on global aspects associated with the function: that it is a polynomial or a quadratic. While they understand the implication, f(x)=2x2-10x+12
applications, and meanings of the local symbolic notation, their primary interaction with the representation is based on recognized global notions.
Realms of Knowledge. Heibert (1988) discusses the nature of domain knowledge (DK) (the understanding of mathematical representation from a domain perspective). Students who possess strong domain knowledge consider the meaning of a representation beyond the representation itself. For instance, a student with strong DK may immediately connect the expression to higher realms such as functions, cubics, and polynomials rather than simply a concatenation of mathematical terms.
Register knowledge (RK), is the understanding of a mathematical representation based on visible characteristics (Heibert, 1988); the student may or may not connect these characteristics to a possible more global domain associated with the representation. RK may be sophisticated. For instance, when considering the graph of a polynomial function, RK may allow the student to recognize: real roots of even or odd multiplicity; the y-intercept of the graph; and the graph’s far-left and far-right behavior.
Unlike semantic and syntactic elaboration, where greater problem-solving abilities are associated with students employing semantic elaboration, Adu-Gyamfi and Bossé (2014) and Adu-Gyamfi, Bossé, & Chandler (2015b) demonstrate that problem solving is enhanced when students demonstrate and apply domain register knowledge (DRK), or the intersection of DK and RK. DRK is the recognition of how visible characteristics in the representation speak to the mathematical domain and how the domain sheds interpretive light on the representation. For instance, recognizing that 𝑓(𝑥) =𝑥2+5𝑥+6
𝑥2−𝑥−6 (a symbolic representation) is
a rational function (a mathematical domain) sheds light in both directions: recognizing that 𝑓(𝑥) is the quotient of polynomial functions reveals that it is a rational function and knowing that it is a rational function informs the student that its graph may have asymptotes (vertical, horizontal, oblique, or curved).
Types of Connections. In respect to mathematical representations, three types of connections have been recognized: isomorphic, transcendent, and mixed (Adu-Gyamfi, Bossé, & Chandler, 2015b). Since each mathematical representation conveys only a part of the meaning of an associated concept (Zhang, 1997), isomorphic connections provide a common referent of functioning relationships (Goldin, 1987; Goldin & Shteingold, 2001; Hiebert, 1998; Kaput, 1987b; von Glasersfeld, 1987) and establish the equivalency of information and processes across representations. This is accomplished by: exploiting structural relationships underlying multiple representations of an associated mathematical relation; identifying regularities and discrepancies associated with the different representations; and giving meaning to one representation by reference to similarities in other representations and vice versa (Adu-Gyamfi, Bossé, & Chandler, 2015a). Synonymously, Ainsworth (1999) describes a relation between representations. Adu-Gyamfi, Bossé, and Chandler (2015b) argue that RK may be necessary for forming of isomorphic connections and the forming of isomorphic connections may be necessary for developing RK.
Mixed connections (Adu-Gyamfi, Bossé, & Chandler, 2015b) are those which are simultaneously isomorphic and transcendent (Ainsworth, 1999; Kaput, 1987b). Mixed connections allow students to interconnect different representations though a common domain and establish a bidirectional correspondence between the domain(s) and the representation(s) (Goldin, 1987; Hiebert, 1998; Kaput, 1987b; von Glasersfeld, 1987). Many argue that these mixed connections are instrumental to mathematical understanding (e.g., Ainsworth, 1999; Eisenberg, 1992; Even, 1998; Janvier, 1987; Kaput, 1989; NCTM, 1989, 2000; Thompson, 1994).
Representational Preferences. Many mathematical activities require students to coordinate multiple mathematical representations (e.g., Zahner, et al, 2017; Chang, Cromley, & Tran, 2016). Evidence shows representation-based mathematics instruction highly correlates with student performance (Panasuk & Beyranevand, 2011; Akkus & Cakiroglu, 2009). Since both students and teachers ought to establish recognizable linkages between concepts and representations, mathematics instruction that involves representational selection for the same concepts has far reaching inference both in understanding and interpretations of mathematical concepts. Numerous recent studies note the importance of student representational selection (e.g., Aceveda Nistal, et al, 2009; Ainsworth, Bibby, & Wood, 2007; Elia, Panaoura, Eracleous, & Gagatsis, 2007; Thomas, 2008), with most concurring that student representational flexibility (i.e., a student’s ability to select a useful representation through which to investigate a concept) leads to greater mathematical success in student problem solving. Some studies find that a student performing at a more advanced level reflects an advanced strategy of representational selection (Panasuk & Beyranevand, 2011; Kohl & Finkelstein, 2006).The implication is that a student’s performance is largely dependent on representational preferences and how they are applied.
Representational Code-Switching
With the understanding that mathematical representations each encode mathematical concepts, are defined by characters and attributes, possess a specific nomenclature, reveal or hide various mathematical concepts, and possess various recognized and accepted means of working with, or modifying, the representation, it can be argued that mathematical representations share characteristics with linguistic codes. Thus, herein, returning to the definition of LCS proffered by Sankoff and Poplack (1981), we use the term
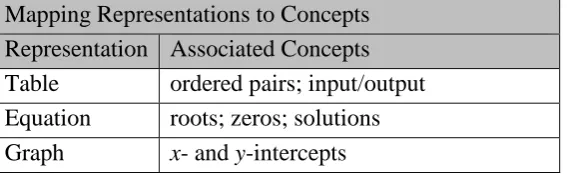
representational code-switching (RCS) to denote: the alternating use of different vocabulary and associated concepts between two or more mathematical representations. For instance, in reference to the function a student may state, “P of x equals x squared minus x minus 6 intersects the x-axis at 3 and -2.” In this case, vocabulary associated with a graph is employed to articulate ideas associated with a symbolic polynomial. Notably, RCS could have been avoided by either stating that the polynomial had roots or zeros at 3 and -2. Similarly, a student may look at a graph and state, “the graph has a double root at 2.” Herein, the vocabulary of roots associated with polynomials in symbolic form is employed regarding graphs. Table 1 (developed from numerous print and online textbooks regarding algebra, college algebra, and precalculus) provides associations of polynomial concepts with polynomial representations.
Table 1
Associating Concepts of Polynomials with Representations
Mapping Representations to Concepts Representation Associated Concepts
Table ordered pairs; input/output
Equation roots; zeros; solutions Graph x- and y-intercepts
We contend that RCS is dissimilar to translating mathematical representations. The latter involves interpreting information in one mathematical representation and recasting the information in the form of another representation. Characteristics of representational translations are provided elsewhere (Adu-Gyamfi & Bossé, 2014; Bossé, Adu-Gyamfi, & Chandler, 2014). As defined in this study, the construct of RCS does not translate one representational form to another. RCS simply communicates ideas in one representation through nomenclature and concepts associated with another representation. In a parallel manner, LCS is distinct from linguistic translation, the latter of which involves conscious interpretation and recasting of a message from one language to another.
Herein, we differentiate mathematical RCS from simply the communication of mathematics. Consistent with previously cited sources regarding LCS, we believe that students employ language purposively and with the intent of communicating either rhetorically or to other interlocutors what they know and that students’ use of language is not accidental. Thus, careful analysis of student mathematical language may be a window into student mathematical performance and understanding. Furthermore, we contend that student use of RCS does not denote linguistic weaknesses or communicative deficiencies; rather, it is possible that RCS may be associated with issues of mathematical performance – either positive or negative – with the mathematical content itself.
While the degree to which findings regarding LCS may be applicable to mathematical RCS is not yet clear, based on previously mentioned LCS research, the following questions arise:
Since some studies argue that LCS among bilingual learners more commonly represents bilingual practices than low linguistic proficiency (e.g., Moschkovich, 2005), should RCS be considered normal communication practice in the realm of mathematics? Since LCS is recognized as both inevitable and necessary in order to develop
understanding in an active learning environment (e.g., Navehebrahim & Jamshidi, 2013), might RCS in mathematics also be necessary and natural in the learning of mathematics?
Since Webb and Webb (2008) argue that most learners resort to LCS when they encounter challenges in translation of ideas and concepts, could RCS in mathematics indicate that students are struggling with mathematical concepts and representational interpretation?
Research Methodology
Participants
The participants in this study were three 17-year-old high school seniors from a school in the southeast part of the United States. All three students were in the same senior level, honors, high school class (titled Math IV), under the same teacher (with 15 years of high school math teaching experience), and had experienced the same instructional and assessment techniques. They had recently completed a unit on polynomial and rational functions. Students volunteered for the study and no incentives or disincentives were provided regarding participation.
The classroom teacher was asked to select one each of a high (Student 1), medium (Student 2), and lower (Student 3) performing student. The initial selection of one student each from three perceived ability levels was primarily due to the fact that the research team was not fully certain regarding what would be revealed and learned through student work and articulations when such was considered under the lens of RCS. The research team wanted to observe a set of students from the same classroom of whom the classroom teacher noted diversity in academic achievement. This was not intended to make specific and generalizable findings associating student ability with RCS practices. Rather it was to ensure a broad cross section of student abilities through which to begin making preliminary observations. The teacher’s assessment and selection of students were accomplished based on almost four months of students’ classroom work, progress, scores, and communication. The researchers had no role in either the selection or characterizing of the students as such and the students were not told on what criteria they were selected. In the remainder of this report: Student 1 is a male student with a class average grade of 95/100; Student 2 is a female with a class average grade of 82; and Student 3 is a male student with a class average grade of 70/100. Notably, while the researchers in this project may not consider a student with a class average grade of 70/100 as “lower performing”, the classroom teacher who was responsible for characterizing and selecting the potential student participants made this decision based on her extensive experience with the course and her experience with this class of students.
The Research Task
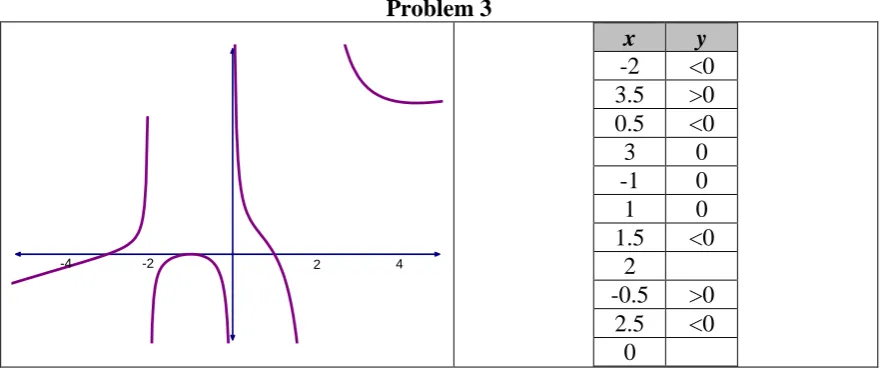
Rational functions and associated representations were selected as the context for the research tasks because the use of representations in this content appeared to be potentially rich for the investigation of students’ verbal articulations and participants had recently investigated and interacted with this concept and these representations in their class. The task (as shown in Figure 1) chosen was rich in communicative opportunities; the classroom teacher considered the task both challenging to most students and doable by all; and the tasks addressed three of the basic processes identified in Krutetskii’s (1976) model of mathematical abilities (i.e., reversibility, flexibility and generalizability).
comprised of a rational function in tabular form with the symbolic representation of another. Problem 3 compared the graph of a rational function with a table encoding another rational function. For each pair of representations, students were to verbally articulate their thoughts. Notably, Problems 2 and 3 include a table in nonstandard form with inequalities rather than specific values and x-values listed out of order. However, based on classroom examples, problems, and communications, the classroom teacher believed that the students would readily understand this form and be able to both comprehend and work with this representation.
Problem Prompt: For each of the following pairs of representations, discuss how the function represented in the left panel compares and contrasts with the one in the right panel.
Problem 1
Problem 2
x y
-2.5 >0 2
-1 0
3 >0 -1.5 <0
1 0
-2
-3.5 <0 0
0.5 <0
-3 0
-0.5 >0 1.5 <0 -2.5 >0 y= x
2
-4
(
)
x2+2x+1
(
)
x2+x
-6
4 2 -2
-4
Show Objects
y= x
2+2x+
1
(
)
(
x-3)
x2+5x+Problem 3
x y
-2 <0 3.5 >0 0.5 <0
3 0
-1 0
1 0
1.5 <0 2
-0.5 >0 2.5 <0
0
Figure 1. Research Tasks.
Data Analysis
In order to examine how students employ RCS in mathematics, a collective case study design (Stake, 2000) was employed to explore the interpretative and subjective dimensions of a phenomenon (Strauss & Corbin, 1990). This provided a vehicle through which to make inferences about understanding and practices. In a task-based interview (Goldin, 2000), participants were observed and videotaped while they individually completed the three research tasks. Students were afforded as much time as needed to complete each of the tasks and were asked to verbalize their thoughts as they worked. The researcher interacted with the participants on a limited scope. The interview schedule ensured that students did not communicate with others regarding the tasks or interviews. The 30–60 minute task-based interviews were conducted one week after the completion of the unit of instruction and assessment on rational functions. Students were asked to provide responses to each research task and answer additional questions posed by the researcher. The interviews were videotaped and transcribed, copies of student work were merged with each transcript, and each transcript was systematically analyzed and independently coded by each researcher in respect to RCS demonstrated by student via their task-based communications (Bogdan & Biklen, 2003).
Codes used to analyze student work took the form of RLRC, denoting the representational language used in respect to a representational context. Each of RL and RC could take the form of S (symbolic), G (graphical), or T (tabular). For instance, if a participant:
considers a function in symbolic form (RC = S) and states that the function has x -intercepts (language associated with graphs) (RL = G) at particular values, this was coded as GS;
considers a table of values (RC = T) she states that it has roots at some value (language associated with symbolic form) (RL = S), this was coded as ST; and
considers a graph (RC = G) and states that for a particular x-value it produces a particular
y-value (language associate with a table) (RL = T), this was coded as TG.
Altogether, Table 2 lists all possible RLRC codes for RCS. Note that when RL = RC, these communications are considered non-RCS articulations.
4 2
Table 2
Codes Employed for Data Analysis.
RCS Codes
Representational Context Table
(T)
Graph (G)
Symbolic (S)
Representational Language
Table (T) TG TS
Graph (G) GT GS
Symbolic (S) GS ST
The participants were observed in order to develop both individual cases and a combined case. Through a constant comparison method, data collection and analysis were focused and interpretative case studies were developed, allowing researchers to analyze the data, develop a coding structure, and apply the coding structure to the verbal and written work. In order to adequately investigate the nature of RCS within student communication and work, the researchers decided to also code the transcripts in respect to: types of elaboration (semantic and syntactic); realms of knowledge (domain knowledge, register knowledge, and domain register knowledge); types of connections (transcendent, isomorphic, and mixed); and representational preferences. In order to observe RCS, the coding structure employed determined when a participant communicated about a mathematical representation through nomenclature, vocabulary, and concepts more precisely associated with another representation.
After each researcher independently coded each transcript, the team assembled to corporately consider the codes used by each. Through the process of check-coding (Miles & Huberman, 1994) the research team came to a consensus on the analysis of each transcript. Additionally, this process led to a cross-case analysis which illuminated patterns across individuals. This allowed the researchers to gain interpretive insight into both individual and general student behavior.
Findings and Initial Analysis
The findings below are provided in respect to the three student participants. In later discussions, synthesis of the findings is provided to complete generalized, cross-case, findings. The transcripts provided are abbreviated (i.e., salient points are captured while omitting redundancy and actions and articulations which did not inform the findings) from the total body of transcripts.
Student 1
Considering Problem 1
We can easily rewrite the function as . So, it has zeros in the
numerator at ±2 and -1. The root at -1 has a multiplicity of two. So, the function should pass through the x-axis at -2 and 2 and bounce off the axis at -1. It would also have zeros in the denominator of 2 and -3. This would cause vertical asymptotes at these values. The factors in the numerator and denominator divide away. [Note that the student fails to recognize that
y=
(
x+2)
(
x-2)
(
x+1)
2x-2
a vertical asymptote at will be removed.] So, the function should have asymptotic behavior
along , which is a cubic divided by a linear. This should produce
asymptotic behavior along a quadratic. I would have to do long division to get this exact quadratic.
The graph has different behavior. We can see that it has: a linear factor of, probably, ; a root at around ; and a double root at or . I’m pretty sure that the function has a vertical asymptote at -2. And I think that the denominator must also have a factor of . I’m not sure it the graph shows me enough to know that it may be asymptotic to a parabola; but it could be.
These two representations represent functions that are more different than they are alike.
Considering Problem 2
The table shows an x-intercept at -1. Wait, there are more. I see roots at and . Can I rewrite the table in order? (Researcher: You can do anything you like.)
[Student rewrites the accompanying table.] Well, now there is more information. I think that the blanks mean that the function is undefined at those x values. If so, there is a vertical asymptote at , the denominator has a root at 0, and there is a zero in the denominator at
. That means that the denominator may factor to . But there could still be some double roots.
Now I can look back at the numerator. Because of the changing from negative to positive around , the root at -3 must have an odd multiplicity. The same thing happens at . However, at the x -intercept at 1, we have negative values on both sides. We must have a root of even multiplicity at 1; or .
I’m not sure, but I think that since the values around each asymptote alternate between positive and negative that each root in the denominator is of multiplicity 1.
So, I think that the table makes the function .
The rational function can be rewritten as . We can see easily that
. So, we would have zeros, or x-intercepts, at -1 and 3, with -1 being a double root. Additionally, we would have two vertical asymptotes: at -2 and -3.
Again, these functions are very different – more different than alike.
Considering Problem 3
The graph shows roots at x = -3, -1, and 1, with a double root at 1. Also, there seem to be vertical asymptotes at -2, 0, and 2. Just that information would make the function
. This would even make sense in another way. This gives us a y=
(
x+2)
(
x+1)
2
x+3
x
+
2
x
= -
1
x
= -
2
(
x+2)
x-3
(
)
x
= ±
1
x
= -
3
x
= -
2
x
=
2
(
x+2)
( )
x(
x-2)
x
= -
3
x
= -
1
x-1
(
)
2y=
(
x+3)
(
x+1)
(
x-1)
2
x x
(
+2)
(
x-2)
y=
(
x+1)
2x-3
(
)
x+2
(
)
(
x+3)
f( )
-1 = f( )
3 =0y=
(
x+3)
(
x+1)
(
x-1)
2x x2
-4
(
)
x y
-3.5 <0
-3 0
-2.5 >0 -2
-1.5 <0
-1 0
-0.5 >0 0
0.5 <0
1 0
1.5 <0 2
fourth degree polynomial divided by a cubic. This would make a slant asymptote; and that is what I think I see on the graph.
[The student rewrites the table to the accompanying form.] I think
that what I see is . But I am not sure. The table
doesn’t represent horizontal, slant, or curved asymptotes, and my equation would produce a quadratic asymptote.
These two representations are more alike than the other pairs. They share some linear factors in both the numerators and denominators.
[Researcher: I noticed that you converted your graphs and tables to equation form in order to make the comparisons. Why didn’t, for instance, you convert the equation to a graph and compare it that way?] Rewriting all the equations to graphs or tables would be much more work. It is easier to talk about and compare equations.
Initial Analysis
While Student 1 recognizes important local features of the various representations, his focus on the representations is more global in nature. While he recognizes the roots in the
numerator and denominator of , he more highly values the
expression as a rational function and considers it through this lens. For instance, he recognizes that the asymptotic nature of the function would be along a quadratic. Similarly, although he recognizes local features in the graphs, he immediately employs the global understanding of rational functions toward interpreting and working with the graphs and associated functions he is developing. Most notably, he demonstrates strong semantic elaboration regarding the tables. He immediately recognizes local features in the table as depicting a global descriptor of a rational function.
When considering the tables, Student 1 immediately recognizes zeros and possible vertical asymptotic behavior (register knowledge or RK). This informs him that a possible domain of the problem was that of rational functions (domain knowledge or DK). Then iteratively, the knowledge of rational functions refines his interpretation of the tables and his reading of the tables further connects to rational functions (domain register knowledge or DRK).
Student 1 demonstrates high levels of isomorphic, transcendent, and mixed connections. He readily connects characteristics of one representation to another (isomorphic), connects each representation to the domain of rational functions (transcendent), and holds the domain of rational functions to simultaneously speak to two or more representations (mixed). Indeed, he often synthesizes communication of two representations in the context of a third representation. For instance, in Problem 3, he uses the notion of roots (functional context) to connect the x-intercepts of the graph and the zeros of the function.
Student 1 demonstrates both no representational preference and a strong preference for function equations. While he seemed equally comfortable communicating about each representational form and using a third representation as a tool for communication, he also
y=
(
x+1)
(
x-1)
2
x-3
(
)
x x
(
-2)
y=
(
x+2)
(
x-2)
(
x+1)
2x-2
(
)
(
x+3)
x y
-2 <0
-1 0
-0.5 >0 0
0.5 <0
1 0
1.5 <0 2
2.5 <0
3 0
posited all final comparisons in the form of function equations. However, the latter seems a purposive decision based singularly on convenience.
The transcript provides evidence that Student 1 consistently exhibits behavior that might be seen as RCS as defined in this study. Throughout, he employs vocabulary of one representation in respect to another. For instance:
In respect to the equation, he discusses graphical aspects of the function (e.g., intersections with the x-axis and various asymptotic behavior) and uses notation (in a manner implying input and output) that may be more commensurate with tables (GS and TS).
In respect to the graph, he discusses concepts associated with function equations (e.g., numerators, denominators, linear factors, and roots) (SG).
In respect to the table, he articulates graphical aspects of the function (e.g., x-intercepts and asymptotes) and function equations ideas (e.g., numerator, denominator, roots, and zeros) (GT and ST,).
With both fluidity and rapidity, Student 1 uses vocabulary and notions associated with one representation when discussing another representation as he switches among representational terminology. This connotes that he is very familiar with the concepts and simply employs the vocabulary and ideas that most efficiently communicates the idea. Thus, his employment of RCS may denote multi-representational mathematical fluency.
Student 2
Considering Problem 1
Well, I’m not sure if I am supposed multiply this denominator out or factor the top and
bottom. If I factor everything, I get . That means that I can
cross out and get . So, it is zero at -3, -2, and -1. No, wait. It is zero
at -2 and -1; x cannot be -3, since that will make zero in the bottom. It goes to infinity at -3.
[Writing on a piece of paper, the student produces .] This gives
me some more information. It tells me that the y-intercept is 2/3. It also tells me that there is no horizontal or slant asymptote. I think that is all I can tell you about this function. I know that it is called a rational function.
I can tell you some things about the graph, but not as much. It looks like it crosses the x -axis at -3, -1, and 2 – or at least is bounces off the -axis at 2. I think that it has a vertical asymptote at -2. I don’t know if it has one at 3. I’m not sure what is happening there. I’m not sure if this is a rational function. It sure doesn’t have any horizontal or slant asymptotes.
I don’t think that I know how to make this [graph] into an equation. I wish I knew how. I like equations much more. But I will give it a try. I think that I can start with in the top. If it is a rational function, then the bottom would be or . I’m going to guess that there is a vertical asymptote at 3.
So, I think that we could have . That can be
y=
(
x+2)
(
x-2)
(
x+1)
(
x+1)
x-2
(
)
(
x+3)
y=(
x+2)
(
x+1)
(
x+1)
x+3
y= x
3+
4x2+5x+2 x+3
x+3
(
)
(
x+1)
(
x-2)
(x+2)(x-3)
(
x- -2)
(
x-3)
y=
(
x- -3)
(
x- -1)
(
x-2)
x- -2
. But this would give me a slant asymptote somewhere, and I don’t
see one on the graph. So, I think that something is wrong.
Since I’m not sure if either of my answers is right, I don’t know if I can compare the equation with the graph.
Considering Problem 2
This table is not in order. Let me see what I can figure out. Well I see some x-values that make zeros: -1, 1, -3.
I think that this whole project is about rational functions. So, I think that will give me on top. I can make that into . If these are rational functions, then I think that the blanks in the table mean that there is no value. That could be infinity; isn’t infinity undefined? That means that it makes zeros in the bottom. If that is right, then I could get in the bottom. I think that is a good start. But I don’t have any idea what to do with the numbers that are greater or less than 0. I’ve never seen that before. I’m supposed to have real numbers in there. I don’t think that I can do more with that.
The equation is easier. It is definitely a rational function. Doing the first problems helped me remember things. I think that I first want to factor everything to get
. Right there, that tells me that there are zeros at -1 and 3 and that
when x is -2 or -3, then we get zero in the bottom, or infinity.
If I stop, I can see a lot of differences between the table and the equation. The table gave me zeros at -1, 1, and -3. The equation gave me zeros at -1 and 3. The table gave me infinity (at least I think so) at 2, -2, and 0 and the equation gives me infinity at -2 and -3. I think that the equation will give me a slant asymptote, but I don’t know where. I can’t tell anything from the table about slant asymptotes.
Considering Problem 3.
Oh no. Not another table. I’ll do the graph first. The graph crosses at -3, bounces off -1, and crosses at 1. I can see that there is a vertical asymptote at -2. But I am not sure what is happening at 2; the lines seem to be too far apart for an asymptote. It looks like an asymptote from 1 to 2, but on the other side of 2, I’m not sure. I don’t see any horizontal or slant or asymptotes. So, I think that I can work with the left side better than the right side.
I think that I can get . But I don’t think that this takes care of
the right hand side. Can I graph this on my calculator to see if it matches? [Researcher: We are trying to avoid using any tools.] Well, then, I don’t think that I can do any more with that. Plus, if I did graph it on my calculator, I’m not sure that would help me anyway. I don’t think that I can do better than this.
Ok, now to the table… I see zeros at 3, -1, and 1. I see infinities at 2 and 0. But again,
the other stuff makes no sense. Well, with that information, . But
that doesn’t take into account all the other values of less than and more than zero. I know y=
(
x+3)
(
x+1)
(
x-2)
x+2
(
)
(
x-3)
x- -1
(
)
(
x-1)
(
x- -3)
(
x+1)
(
x-1)
(
x+3)
x-2
(
)
x x(
+2)
y=
(
x+1)
(
x+1)
(
x-3)
x+2
(
)
(
x+3)
y=
(
x+3)
(
x+1)
(
x-1)
x+2
y=
(
x-3)
(
x+1)
(
x-1)
x-2
that that means positive and negative; but without specific values, I don’t know what to do. So, I can’t compare these any more than this.
[Researcher: I noticed that you converted your graphs and tables to equation form in order to make the comparisons. Why didn’t, for instance, you convert the equation to a graph and compare it that way?] I never thought of doing that. It seems that the equations are equations and the equations become tables and graphs. We don’t usually make tables and graphs into equations.
Initial Analysis
Student 2 demonstrates the blending of semantic and syntactic elaboration – albeit to mixed levels of success. At times, she considers local aspects of a representation to speak to the global notion of rational functions and at times she considers global issues associated with rational functions and polynomials in order to inform the interpretation of characteristics of the respective representation. For instance, upon recognizing that the equation represents a rational function, she then uses the characteristics of the numerator and denominator to determine behaviors associated with rational functions (e.g., x-intercepts and asymptotes).
Student 2 demonstrates some level of both DK and RK, but not to the level of Student 1. For instance, in Problem 2, she recognizes that the table (RK) was probably in respect to rational functions (DK). But, in writing her associated function, she discretely discusses the “top” and “bottom” of the expression, not fully concretizing the notion of rational function and does not use the more global understanding of rational functions to inform her interpretation of either the table or the equation she was constructing. Thus, she lacked DRK. Student 2 demonstrates some level of both isomorphic and transcendent connections. She recognizes local characteristics within two different representations which seemingly mapped together (e.g., roots in Problem 1 corresponded to x-intercepts on the graph). Additionally, she interpreted each representation as under the domain of rational functions (“I think that this whole project is about rational functions.”) and allows her understanding of rational functions to speak to the interpretation of, and operation on, each representation. However, although she employs transcendent connections between, for instance, the representation of an equation and the domain of rational functions and between the representation of a graph equation and the domain of rational functions, little evidence suggests that she employs mixed connections and simultaneously considers both the equation and the graph under the domain of rational functions.
Student 2 generally recognizes the function equation as the representation of communication. While function equations are analyzed and both graphs and tables are converted to functions as a means of comparison, this may be more of necessity than of choice. (“I never thought of doing [converting equations into graphs or tables]. It seems that the equations are equations and the equations become tables and graphs. We don’t usually make tables and graphs into equations.”)
Notably, much of the mathematical language of Student 2 is less mathematically formal than that of Student 1. For instance, while Student 1 mentions numerator and denominator, dividing expressions, root and zeros, intersecting the axes, and asymptotes, Student 2 employs the nomenclature of top and bottom, crossing out expressions, zeros, crossing axes, infinity and asymptotes. Their use of mathematical language, in many cases, is quite dissimilar.
In respect to the equation, she discusses graphical aspects of the function (e.g., y -intercepts and asymptotes) and states that particular values produce other values (in a manner implying input and output) that may be more commensurate with tables (GS and TS).
In respect to the graph, she discusses concepts associated with function equations (e.g., equation functions, top and bottom, symbolic linear factors) (SG).
In respect to the table, she articulates function equations ideas (e.g., zeros and linear factors) (ST).
Student 2 uses vocabulary and notions associated with one representation when discussing another representation. The researchers hypothesize that this is the case because Student 2 places less concern on linguistic precision than on ideas which may be more efficiently articulated through one representation over another.
Student 3
Considering Problem 1
What am I supposed to do? Compare and contrast these things? How can I tell? Can I graph the equation? [Researcher: Can you do it without using a calculator?] I don’t think so. I don’t know what the equation would look like. And I don’t know what equation would make the graph. I just know that the equation is usually the question and the graph is usually the answer. Even the calculator tells you that. I can graph and equation, but I don’t think that I can put a graph in and get an equation.
I could multiply the numerator and the denominator. Then I could divide. But that would be a lot of work. And I don’t know if it will help. Plus, I might not do it right anyway. And, even if I did it, I don’t know if that would help me see what the graph looks like.
Again, the graph is the answer. I’m not sure what we are supposed to do with this. I guess that if we are supposed to compare the two, I need to make this into some kind of equation. But there are no labels on the y-axis. I don’t know if this can be done. I know that it intersects at -3, -1, about -0.5, and at 2. But that doesn’t make an equation, unless it is something like , or something like that – I’m not really sure where all the number go. And even if I knew, then without any labels on the y-axis, I’m not sure that it would be correct. Maybe that’s the trick. Maybe we aren’t supposed to do anything at all with this graph since it doesn’t have labels?
I can’t compare these two things. They don’t look anything alike.
-3x3+
Considering Problem 2
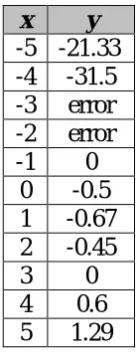
This table doesn’t make any sense. The numbers are not in order. They are supposed to be in order. Some of the numbers don’t have any answer. There isn’t enough information to understand this. And some of the answers are just bigger or smaller than zero. This doesn’t make sense either. I don’t want to insult anyone and say that these are stupid problems, but they are. I can’t do anything with the table. I think that I am supposed to make it into an equation to compare with the other equation; but I don’t know how.
Since I can’t make the table into an equation, maybe I can make the equation into a table. Can I use my calculator to calculate some values? [Researcher: Yes.] [The student creates the accompanying table.] My table for the equation is wrong on almost every value that is in common with the other table. The only same values are for . So the table
and the equation are only the same for one value and are different for everything else.
Considering Problem 3
Notably, the format of the following transcript is significantly different than the previous transcripts. In the previous transcripts, the researcher interjects minimally – as little as comfortably possible – with the respective student. In this case, the regular, dynamic, interactive, dialog between the student and researcher required a more linear recording of the discourse in order to capture the nature and meaning in the discourse.
Student (S): I give up. I don’t need to do any more do I?
Researcher (R): You are allowed to stop whenever you want. But, can I ask you some questions?]
S: Yes.
R: When you look at the table, and you get a x value that pairs up with a y-value of zero, what can you tell me?
S: It tells me that if you put the x value into the equation, the answer will be zero. R: What does that mean in respect to the associated graph?
S: I think that means that the graph will intersect the axis?
R: Which axis?
S: The x-axis. Well, probably both – some how.
R: Does mean the same as ?
S: I’m not sure. I know that means put a 0 into the function. Am I right? R: What does either the blank or the “error” mean in the table?
S: That’s tough. The blank might mean that no value is reported. Or is could mean something else. I don’t know. I know that the “error” message usually means that you are trying to divide by zero. But, when I made my table, I used a number in the equation that wasn’t zero.
R: Do you think that there is a connection between the blanks and the “error” messages and the associated graph?
S: Well, because I couldn’t get very far on these kinds of problems, I’m not sure.
R: Can you tell me what a vertical asymptote is on a graph?
S: It’s a dotted line that the graph can’t cross.
x
= -
1
f
( )
0x y
-5 -21.33 -4 -31.5 -3 error -2 error
-1 0
0 -0.5 1 -0.67 2 -0.45
3 0
4 0.6
R: Is the dotted line part of the graph?
S: Yes and no. It is when we draw the graph in class. But it isn’t when we graph it using a calculator or computer. I think that it belongs there, but the computer can’t put it in.
R: Looking at a function in equation form, can you tell me when it will create a vertical asymptote?
S: I doubt it. Is that even possible?
R: Can you explain horizontal or slant asymptotes to me?
S: Not really. I never really understood those.
R: Can you tell me from the equation form of a function how to determine if the graph will have a horizontal or slant asymptote?
S: No idea.
R: What are you most comfortable with, an equation, a graph, or a table?
S: Well, I think that they each show me different things. The table shows me specific pairs of x-inputs and y-outputs. The graph shows me what the function looks like. The equation let me rewrite and simplify it. The problem with the table is that it only shows what it shows. It’s almost like a list of answers. You really can’t do anything with it. The equation can be rewritten; but you still have to put values in to see what you get. You can graph an equation, but that is just like making a table with a million values. I guess that, in a way, the graph tells you everything. But I don’t know how to go from a graph to an equation – or even if we ever would (except for this activity).
Initial Analysis
Student 3 repeatedly demonstrates syntactic elaboration. Rather than understanding global aspects associated with rational functions (the domain of the research problems), he focuses – often unsuccessfully – on local characteristics of the representations. For instance, he recognizes the discrete pairing of values within the table, but does not recognize the table as representing a function, let alone a rational function. Respecting the x-intercepts of a graph, he fails to recognize the nature of the linear factors of the numerator that would produce this. His global understanding of polynomials and rational functions seems minimal. The work and transcripts from Student 3 suggest the presence of RK without DK. He is able to articulate characteristics about each representation. For instance, he recognizes zeros in tables and x-intercepts on graphs. However, he did not associate these to the domain of polynomials or rational functions.
The transcripts demonstrate that Student 3 mostly lacked both isomorphic connections and transcendent connections. He primarily interacts with each representation as if it is isolated, disjoint from other representations, and disconnected from any more global domain (e.g., polynomials and rational functions). In almost every example, his work and articulations remain within the depicted representation, he fails to associate attributes and characteristics in that representation with attributes and characteristics associated with another representation, and he fails to see attributes of any representation through the lens of the domain of rational functions.
Student 3 demonstrates no representational preferences; he seems equally uncomfortable with all representations and only infrequently communicates concepts of one representation through the lens or concepts associated with another representation. Student 3 also seems to employ RCS in his communication. For instance:
In respect to the equation, he discusses “what the graph looks like” and translates the equation to a table of values (GS).
In respect to the table, he articulates graphical aspects of the function (e.g., x-intercepts and asymptotes) and function equations ideas (e.g., numerator, denominator, roots, and zeros) (GT and ST).
Following discussions attempt to indicate why Student 3 may employ RCS to a limited extent in comparison to the other students.
Discussion
It was earlier mentioned that the coding structure through which we investigated student work and articulations was constructed upon the nomenclature RLRC, denoting the representational language used in respect to a representational context. With each of RL and RC taking on a value of S, G, or T, RCS can be almost trivially defined as student work, behaviors, and articulations in which RL ≠ RC. The simplicity of this definition may imply the future need for a more robust framework defining characteristics and applications of RCS in a manner that can be readily used in analyzing student work and communication. Nevertheless, the remainder of this paper employs this initial definition.
It is far too simplistic to claim that Students 1, 2, and 3 may have all performed behaviors commensurate with RCS, albeit at different levels of frequency. This could lead to a deterministic interpretation that RCS frequency is a product of student mathematical understanding. While this should be cautioned against, we cannot overlook the fact that the three students were selected on the basis of strong, medium, and weaker mathematical performance. Much more significantly, it may be that the three students articulated RCS in different ways, which may or may not be associated with the level of mathematical learning. These differences warrant additional investigation beginning with a synopsis of all findings.
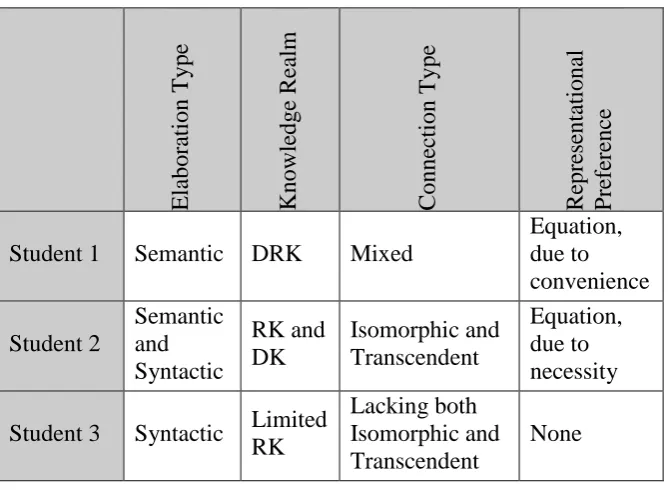
Synopsis
Table 3
Summary of Student Communication
Ela
bora
ti
on Type
Know
ledge
R
ea
lm
C
onne
cti
on Type
R
epre
se
ntational
P
re
fe
re
nc
e
Student 1 Semantic DRK Mixed
Equation, due to convenience
Student 2
Semantic and Syntactic
RK and DK
Isomorphic and Transcendent
Equation, due to necessity
Student 3 Syntactic Limited RK
Lacking both Isomorphic and Transcendent
None
Generalized Findings
Herein, generalized findings are provided through a number of dimensions. First, Table 3 is considered. Second, findings will be considered through additional lenses from the realm of SLA. Then questions previously posed in the literature review connecting LCS with RCS are considered.
Via Table 3. While this paper only considers the communication of three participants and generalizations must be extremely tentative, Table 3 may provide some global insights into variations of student mathematical RCS. An association may exist between how a student employs RCS and other dimensions regarding student thinking and actions. It must be wondered how lesser representational understanding associated with syntactic elaboration, RK, and limited connections affect the manner in which students employ RCS. Conversely, it can be questioned how greater representational understanding associated with semantic elaboration, DRK, and the use of mixed connections impacts the manner in which students employ RCS.
Additionally, Table 3 connotes that RCS may have multiple purposes:
RCS among high performing mathematics students may be recognized as an effective communication tool in respect to notions perceived by the student as synonymous (Student 1). As such, this may indicate mathematical representational fluency. RCS may be born from the lack of recognition of conceptual connections across different
representations. RCS may be a tool to assist communication in realms difficult to articulate otherwise. Students may employ RCS to effectively communicate about a representation with less familiar in the context of a representation with which they are more familiar.
RCS may connote a minimal understanding of one or both of the representations and lead to lesser mathematical performance.
being acquired. Students simultaneously understand some portion of the language communicated (or the content of such) and fail to understand some other portions as those are slightly beyond their current level of linguistic acquisition, outside of their realm of experience, and to some degree beyond their level of linguistic production. While students can receive and understand most of the communication from another, they cannot independently construct the ideas in the second language. Complementing the notion of comprehensible input, Swain (1985) and Swain and Lapkin (1995) promote the concept of
comprehensible output, where language learners may internalize ideas but recognize gaps in linguistic production which limit their ability to communicate the ideas in the second language. Selinker (1972, 1992) posits the notion of interlanguage, an individualized, distinctive linguistic code a learner employs as he or she acquires a second language. These codes generally share the common characteristic of: containing patterns of language transfer from the student’s native language(s); demonstrating overgeneralization and overapplication of rules in the second language; retaining a fossilization of linguistic errors, particularly in adult learners; and constantly changing and developing throughout the language learning process.
Since, as previously discussed, each mathematical representation carries its own terms, vocabulary, ideas, and accepted processes upon which to operate on the representation, the authors recognize each mathematical representation as a code. Thus, we argue that interlanguage occurs when students are navigating between two or more mathematical representations and developing their unique mannerisms for discussing either both representations or one representation in light of another.
While Student 1 seems to employ RCS and arguably with fluency, his comprehensible input, comprehensible output, and interlanguage differ from those of the other students. Student 1 employs terms and notions from one mathematical representation to another representation because he recognizes synonymy between the concepts. Few concepts encountered in the research tasks seem to act as either incomprehensible input or incomprehensible output. He seems to understand fully the concepts communicated to him through the problem and be able to articulate the responses he wishes. There is no evidence of struggling with the language of the task prompt, the interpretation of any of the representations, working in any representation, or the ability to communicate precisely what he wants. Indeed, Student 1, demonstrates an interlanguage which approaches fluency in each representation and between all pairs of representations. His interlanguage places a preference on symbolic representations, by converting aspects from tables and graphs to verbiage and concepts associated with symbolic representations.