ISSN 0975-928X
Research Note
Genetic Variability Studies for Yield and Yield Components in Rice
(
Oryza Sativa L.
)
Sk. Sameera, A. Prasanna Rajesh, V. Jayalakshmi, P.J. Nirmala, and T. Srinivas Department of Genetics and Plant Breeding, Agricultural College, Mahanandi,
Acharya N. G. Ranga Agricultural University, Hyderabad- 30 Email: [email protected]
(Received: 23 Jun 2014; Accepted:07 Mar 2015)
Abstract
Twenty five rice genotypes were evaluated in randomized block design with three replications to examine the nature and magnitude of variability, heritability and genetic advance. Analysis of variance revealed that differences among the genotypes were significant for all the characters studied. Further, the traits, number of tillers per plant, productive tillers per plant, number of grains per panicle and number of filled grains per panicle showed higher estimates of genotypic and phenotypic co-efficient of variation, while high estimates of heritability were recorded for all the characters under study. High heritability coupled with high genetic advance as per cent of mean was also recorded for number of tillers per plant, productive tillers per plant, number of grains per panicle and number of filled grains per panicle suggesting that these traits were more useful for targetted yield improvement programmes in rice.
Keywords
Rice,Heritability, Genetic Advance, Variance.
Rice is the most important grain and staple food for more than 100 countries of the world and has been referred to as “Global Grain” (Shalini and Tulasi, 2008). India, though being the second largest producer of rice in the world, lags behind in productivity. The rising demand for rice coupled with saturation of cultivable area and low gross domestic production are likely to cause a shortage of the crop in the near future. It is also estimated that by 2025, about 785 million tones of paddy which is 70 per cent more than the current production will be needed to meet the growing demand. According to FAO, the productivity of rice in India is very low (3.21 t/ha) as compared to the average productivity of China (6.35 t/ha) and the world (4.15 t/ha). The low productivity in India is mainly attributed to non- availability of high yielding rice varieties. Rice being staple food of the Indian population, improving its productivity has become crucial.
Development of high yielding rice varieties requires thorough knowledge of existing genetic variability. Further, since the phenotypic expression of a character is the result of interaction between genotype and environment, total variation needs to be partitioned into variance due to genotype (heritable) and variance due to environment (non-heritable) for assessing the true breeding behaviour of the phenotype. Efficiency of selection in plant breeding therefore largely depends upon the amount of heritable variation present in the material. Further, the effective use of genetic variation for crop improvement programme
is possible only if it is considered in relation to heritability. High heritability coupled with high genetic advance has been reported to be more useful in predicting the resultant effect of selection for yield and its components. It also helps in determining the environmental influence on expression of characters. In this context, the present investigation was undertaken to study the genetic parameters in rice.
ISSN 0975-928X
The analysis of variance (ANOVA) revealed highly significant differences among all the 25 varieties for all the characters (Table 1) indicating the existence of sufficient variation in the experimental material.
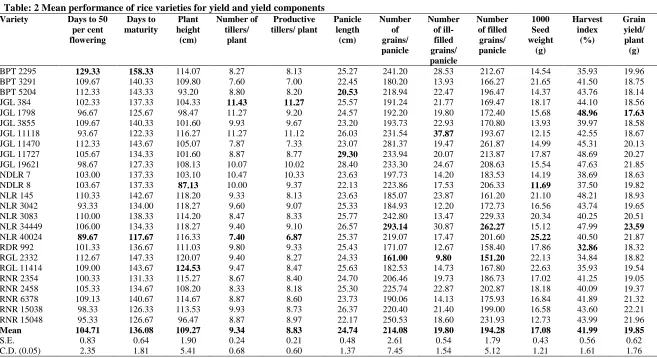
The mean performance of rice varieties for different yield and yield components are presented in Table 2. A perusal of these results revealed the varieties, NLR 34449, NLR 40024, RNR 15038 and RNR 15048 to be high yielders. The high grain yield of NLR 34449 (23.57g) noticed in the present investigation is attributed to its high grain number (293.14) and high number of filled grains per panicle (262.27) in addition to relatively higher panicle length. These varieties are therefore identified as promising varieties for extensive commercial cultivation.
The estimates of co-efficient of variation, heritability and genetic advance observed for yield and yield components are presented in Table 3. In general, the phenotypic co-efficient of variation was higher than the genotypic co-efficient of variation indicating the influence of environment towards the total variance. Similar results were found by Mamata Singh et al. (2007). Further, high estimates of variability were recorded for productive tillers per plant (GCV=24.30; PCV=24.64) followed by number of tillers per plant (GCV=23.64; PCV=24.04), number of grains per panicle (GCV=20.67; PCV=20.78) and number of filled grains per panicle (GCV=20.57; PCV= 20.24) indicating the existence of wide genetic base among the varieties taken for the study and possibility of genetic improvement through selection for these traits. These results are in conformity with the findings of Bekele et al. (2013) for productive tillers per plant. However, moderate estimates of variation were recorded by grain yield per plant (GCV=12.95; PCV=14.04), number of ill-filled grains per panicle (GCV= 12.59; PCV=13.46) and harvest index (GCV=11.07; PCV=11.31). In contrast, low estimates of co-efficient of variation were observed for panicle length (GCV=8.93; PCV=9.54), days to 50 per cent flowering (GCV=5.99; PCV=6.14), plant height (GCV=5.95; PCV=6.67) and days to maturity (GCV=4.58; PCV=4.65) indicating little scope for improvement of these characters through simple selection. Similar findings were reported earlier by Idris and Mohammed (2013).
The efficacy of selection not only depends on the magnitude of variability present in the genotypes but also on the extent of heritability of the desirable character. Johnson et al. (1955) suggested that,
values coupled with high genetic advance as per cent mean were reported to be more reliable and useful in predicting the genetic gain under selection rather than heritability estimates alone. In the present investigation, high heritability coupled with high genetic advance as per cent mean were recorded for majority of the characters under study, namely, number of filled grains per panicle (99.40), total number of grains per panicle (98.97), productive tillers per plant (97.25), days to maturity (96.95), number of tillers per plant (96.63), harvest index (95.79), 1000 seed weight (95.48), days to 50 per cent flowering (95.05), number of ill-filled grains per panicle (87.46), panicle length (87.60), grain yield per plant (87.06) and plant height (79.60) indicating minimum influence of environment on these characters. Similar results were also reported by Selvaraj et al. (2011).
In conclusion, the results have revealed the potential of NLR 34449, NLR 40024, RNR 15038 and RNR 15048 varieties for extensive commercial cultivation. The results also revealed high variability (GCV), heritability and genetic advance for productive tillers per plant followed by number of tillers per plant, number of grains per panicle and number of filled grains per panicle, indicating a scope for improvement of these traits through simple selection
.
References
Bekele, B.D., Rakhi, S., Naveen,G.K., Kundur, P.J and Shashidhar, H.E.2013. Estimation of genetic variability and correlation studies for grain zinc concentrations and yield related traits in selected rice (Oryza sativa L.) genotypes.
Asian J. Experimen. Biol. Sci. 4(3):391-397. Burton, G. W and Devane, E. H. 1952. Estimating
heritability in tall fescue (Festuca arundinaceae) from replicated clonal material.
Agron. J., 45: 478-481.
Idris, A.E and Mohamed, K.A. 2013. Estimation of genetic variability and correlation for grain yield components in rice (Oryza sativa L.).
Global J. Plant Ecophysiol.,3 (1):1-6.
Johnson, H. W., Robinson, H. F and Comstock, R. E. 1955. Estimation of genetic and environmental variability in soybean. Agron. J., 47:314-318. Mamta Singh, Kumar, K and Singh, R.P. 2007. Study of
co-efficient of variation, heritability and genetic advance in hybrid rice. Oryza, 44 (1): 160-162.
Panse, V. G and Sukhatme, P. V. 1961. Statistical methods for agricultural workers. 2nd Edition ICAR, New Delhi. pp: 361.
ISSN 0975-928X
ISSN 0975-928X
Table 1. Analysis of variance (ANOVA) for yield and yield components in rice
Source of variation Degrees of freedom Days to 50 per cent flowering Days to maturity Plant height (cm) Number of tillers per plant Productive tillers per plant Panicle length (cm) Number of grains per panicle Number of ill- filled grains per panicle Number of filled grains per panicle 1000 Seed weight (g) Harvest index Grain yield/ plant (g)
Replications 2 0.89 0.81 17.32 0.26 0.48 0.39 13.59 1.06 11.73 0.12 1.79 1.31
Varieties 24 120.06** 117.72** 137.71** 14.79** 13.94** 15.32** 5894.99** 19.52** 4802.74** 34.77** 65.73** 20.98**
Error 48 2.05 1.22 10.84 0.17 0.13 0.69 20.40 0.89 9.63 0.54 0.95 1.16 *, ** Significant at 0.05 and 0.01 levels, respectively.
Table: 2 Mean performance of rice varieties for yield and yield components
Variety Days to 50 per cent flowering Days to maturity Plant height (cm) Number of tillers/ plant Productive tillers/ plant Panicle length (cm) Number of grains/ panicle Number of ill- filled grains/ panicle Number of filled grains/ panicle 1000 Seed weight (g) Harvest index (%) Grain yield/ plant (g)
BPT 2295 129.33 158.33 114.07 8.27 8.13 25.27 241.20 28.53 212.67 14.54 35.93 19.96
BPT 3291 109.67 140.33 109.80 7.60 7.00 22.45 180.20 13.93 166.27 21.65 41.50 18.75
BPT 5204 112.33 143.33 93.20 8.80 8.20 20.53 218.94 22.47 196.47 14.37 43.76 18.14
JGL 384 102.33 137.33 104.33 11.43 11.27 25.57 191.24 21.77 169.47 18.17 44.10 18.56
JGL 1798 96.67 125.67 98.47 11.27 9.20 24.57 192.20 19.80 172.40 15.68 48.96 17.63
JGL 3855 109.67 140.33 101.60 9.93 9.67 23.20 193.73 22.93 170.80 13.93 39.97 18.58
JGL 11118 93.67 122.33 116.27 11.27 11.12 26.03 231.54 37.87 193.67 12.15 42.55 18.67
JGL 11470 112.33 143.67 105.07 7.87 7.33 23.07 281.37 19.47 261.87 14.99 45.31 20.13
JGL 11727 105.67 134.33 101.60 8.87 8.77 29.30 233.94 20.07 213.87 17.87 48.69 20.27
JGL 19621 98.67 127.33 108.13 10.07 10.02 28.40 233.30 24.67 208.63 15.54 47.63 21.85
NDLR 7 103.00 137.33 103.10 10.47 10.33 23.63 197.73 14.20 183.53 14.19 38.69 18.63
NDLR 8 103.67 137.33 87.13 10.00 9.37 22.13 223.86 17.53 206.33 11.69 37.50 19.82
NLR 145 110.33 142.67 118.20 9.33 8.13 23.63 185.07 23.87 161.20 21.10 48.21 18.93
NLR 3042 93.33 134.00 118.27 9.60 9.07 25.33 184.93 12.20 172.73 16.56 43.74 19.65
NLR 3083 110.00 138.33 114.20 8.47 8.33 25.77 242.80 13.47 229.33 20.34 40.25 20.51
NLR 34449 106.00 134.33 118.27 9.40 9.10 26.57 293.14 30.87 262.27 15.12 47.99 23.59
NLR 40024 89.67 117.67 116.33 7.40 6.87 25.37 219.07 17.47 201.60 25.22 40.50 21.87
RDR 992 101.33 136.67 111.03 9.80 9.33 25.43 171.07 12.67 158.40 17.86 32.86 18.32
RGL 2332 112.67 147.33 120.07 9.40 8.27 24.33 161.00 9.80 151.20 22.13 34.84 18.82
RGL 11414 109.00 143.67 124.53 9.47 8.47 25.63 182.53 14.73 167.80 22.63 35.93 19.54
RNR 2354 100.33 131.33 115.27 8.67 8.40 24.70 206.46 19.73 186.73 17.02 41.25 19.05
RNR 2458 105.33 134.67 108.20 8.33 8.18 25.30 225.74 22.87 202.87 18.18 40.09 19.37
ISSN 0975-928X
Table: 3 Estimates of variability and genetic parameters for yield and yield components in rice
Character Mean Range Co efficient of variation (%) Heritability in
broad sense (h2b)
Genetic Advance as per cent of
mean
Minimum Maximum Genotypic
(GCV)
Phenotypic (PCV) Days to 50 per cent
flowering
104.71 89.67 129.33 5.99 6.14 95.05 12.03
Days to maturity 136.08 117.67 158.33 4.58 4.65 96.95 9.29
Plant height (cm) 109.27 87.13 124.53 5.95 6.67 79.60 10.94
Number of tillers/plant 9.34 7.40 11.43 23.64 24.04 96.63 47.86
Productive tillers/plant 8.83 6.87 11.27 24.30 24.64 97.25 49.36
Panicle length (cm) 24.74 20.53 29.30 8.93 9.54 87.60 17.21
Number of grains/panicle 214.08 161.00 293.14 20.67 20.78 98.97 42.36
Number of ill-filled grains/panicle
19.80 9.80 37.87 12.59 13.46 87.46 24.25
Number of filled grains/panicle
194.28 151.20 262.27 20.57 20.64 99.40 42.26
1000 Seed weight (g) 17.08 11.69 25.22 19.78 20.24 95.48 39.81
Harvest index (%) 41.99 32.86 48.96 11.07 11.31 95.79 22.31