FUTURE CHANGES IN SEASONAL-MEAN PRECIPITATION OVER WEST AFRICA
UNDER THE REPRESENTATIVE CONCENTRATION PATHWAYS
C. S. Ekwezuo
1,*, H. C. Nnamchi
2and P. O. Phil-Eze
31, 2, 3
D
EPARTMENT OFG
EOGRAPHY,
U
NIVERSITY OFN
IGERIA,
N
SUKKA,
410001
E
NUGUS
TATE,
NIGERIA
E-mail addresses:
1[email protected],
2[email protected]
3[email protected]
ABSTRACT
This study analysed the future changes in seasonal-mean precipitation over West Africa during the mid (2040-2065) twenty first century using the Norwegian Earth System Model version 1 (NorESM1-M). The NorESM1-M has ~1.89° x 2.5° horizontal atmospheric resolution and 26 vertical levels. The skill of the model in reproducing the observed seasonal-mean precipitation distribution was evaluated for the historical period (1980-2005) using satellite derived precipitation data from the Global Precipitation Climatology Project. Using three possible future levels of atmospheric greenhouse gas concentrations - the Representative Concentration Pathways (RCPs) of 2.6Wm-2, 4.5Wm-2 and 8.5
Wm-2, we calculated the projected changes in seasonal-mean precipitation over West Africa for the mid-twenty first
century. The projected changes show that the transition to dry season (September-October-November) will experience the highest amounts of increase. Overall, RCP 4.5 projects higher levels of precipitation change compared to the other two RCPs. This points to a non-linear effect of intensified greenhouse forcing on precipitation over West Africa; suggesting that after a particular level of greenhouse gas concentrations further increase may have little or no effect on the regions precipitation.
Keywords: West Africa, Precipitation, Climate Change Projections, NorESM1-M, RCPs
1. INTRODUCTION
West Africa is one of the world’s lowest-income regions with majority of its population relying on precipitation to enhance their livelihood [1]. This is because rainfed agriculture is the main source of economic livelihood in the region, representing around 40% of its GDP and employing around 80% of its total population [2]. Precipitation over West Africa is dominated by the West African Monsoon (WAM), which is characterised by a wind circulation system that reverses direction during the course of the year [3].
On an annual-mean basis changes in the prevailing surface wind direction distinguishes the rainy season from the dry season [4]. During the dry season, the dominant direction is northerly and driven by the Azores subtropical anticyclone in the northern hemisphere. In the rainy season, as the Azores subtropical anticyclone weakens, the St. Helena subtropical anticyclone located in South Atlantic Ocean strengthens. Winds from the St. Helena exhibits a southerly direction and is the dominant driver of the annual mean precipitation over West Africa. The onset
of the rains usually occurs in May/June (depending on the location) and the rainy season lasts for about four to six months during which most of the annual rainfall is recorded [4].
Precipitation over West Africa also varies on inter annual and decadal time scale with a substantial part of it due to the influence of the slowly varying climate subcomponents, such as the sea surface temperature (SST) [5], land-atmosphere interaction [6] and radiative forcing of aerosols [7]. The interactions and fluctuations of the aforementioned variable may be primarily intrinsic to the climate system: that is, they are induced by inherent natural mechanisms. On the other hand, observations show a rapidly increasing levels of greenhouse gases ((GHGs) comprising of well mixed gases (their proportions are constant everywhere) in the atmosphere such as CO2, which is largely due to human activities [8-9]. Their main role is to regulate atmospheric heating, thereby determining the planets’ temperature, which in turn establishes the conditions and limit for all living things on Earth.
Vol. 37, No. 1, January 2018, pp.
233 – 240
Copyright© Faculty of Engineering, University of Nigeria, Nsukka,These changes can cause shifts in the precipitation regimes with important ecological and socioeconomic implications [10, 11]. Thus, it is desirable to improve our understanding of the future patterns of precipitation changes over West Africa within the context of global warming. Understanding seasonal-mean precipitation and how it will change under various global warming scenarios will help in providing adequate adaptation measures that will lessen the negative impact.
This study is motivated by a recent study Ekwezuo et al. [12], which examines the present-day and future changes in annual rainfall over West Africa using the Norwegian Earth system (NorESM1-M) model. The work reproduced the annual rainfall pattern over the region and projects a wetter precipitation regime during the mid-twenty first century than the present day period. Therefore, this paper investigates the possible effects of increasing greenhouse forcing on seasonal-mean precipitation over West Africa using the NorESM1-M. First the performance of the model in simulating the seasonal-mean precipitation over West Africa is assessed. Then, the projected seasonal-mean precipitation changes for mid-twenty first century analysed.
2. METHODS 2.1. Study Area
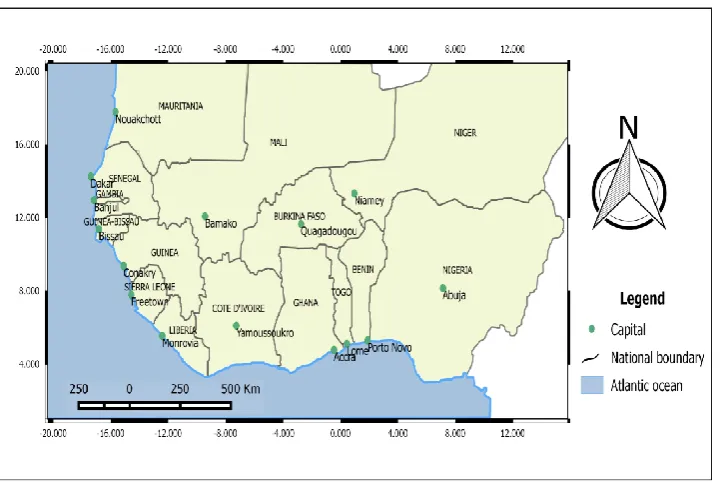
West Africa is located in the western part of Africa and is delineated here using latitudes 2°N to 20°N of the Equator and longitudes 18°W to 15°E of the Greenwich Meridian. The region is bordered by the Atlantic Ocean
to the south and west, Western Saharan, Algeria and Libya to the North, Chad and Central African Republic to the east (Figure 1). The study area extends from the Guinea Coast to the fringes of the Sahara desert and encompasses a variety of climates and ecosystems.
2.2. Model and Experimental design
In this study, we analysed the outputs of the medium resolution Norwegian Earth System Model v1 (NorESM1-M). The model has a horizontal grid resolution of 1.875°x 2.500° and 26 vertical levels. The NorESM1-M was developed at Norwegian Climate Centre in collaboration with researchers from the National Center for Atmospheric Research of the United States of America. The model is based on the Community Earth System Model version 1.0.3 (CESM1; Vertenstein et al., [13]), which is the predecessor of the Community Climate System Model version 4 (CCSM4; Gent et al., [14]). The NorESM1-M outputs were taken from the archive of phase 5 of the coupled model intercomparison project (CMIP5) at http://cmip-pcmdi.llnl.gov/cmip5/.
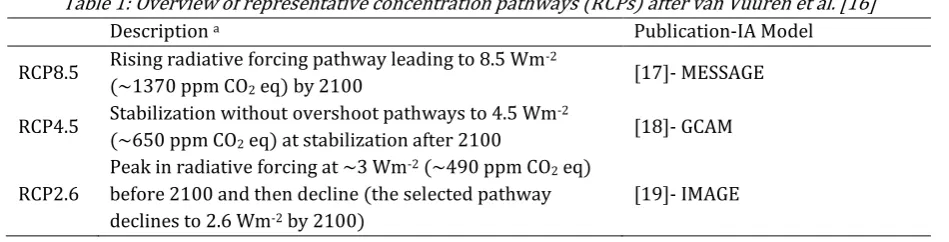
We analysed four (4) different numerical experiments using the NorESM1-M. These are the historical; which was run with green house forcing consistent with the present-day period and three future representative concentration pathways (RCPs; 2.6, 4.5, 8.5, Meinshausen et al. [15]). These are defined such that their radiative forcing will reach about 2.6 Wm-2, 4.5 Wm-2 and 8.5 Wm-2 by the year 2100 respectively (Table 1). The RCPs will be used to examine the future changes of precipitation over West Africa.
Table 1: Overview of representative concentration pathways (RCPs) after van Vuuren et al. [16]
Description a Publication-IA Model
RCP8.5 Rising radiative forcing pathway leading to 8.5 Wm-2
(~1370 ppm CO2 eq) by 2100 [17]- MESSAGE
RCP4.5 Stabilization without overshoot pathways to 4.5 Wm-2 (~650 ppm CO2 eq) at stabilization after 2100
[18]- GCAM
RCP2.6
Peak in radiative forcing at ~3 Wm-2 (~490 ppm CO2 eq) before 2100 and then decline (the selected pathway declines to 2.6 Wm-2 by 2100)
[19]- IMAGE
a Approximate radiative forcing levels were defined as ±5% of the stated level in Wm-2 relative to the pre-industrial levels. Radiative
forcing values include the net effect of all anthropogenic GHGs and other forcing agents. Where: MESSAGE is Model for Energy Supply Strategy Alternatives and their General Environmental Impact GCAM is Global Change Assessment Model
IMAGE is Integrated Model to Assess the Global Environment
2.3. Analysis
The first stage of the analysis involved the evaluation of the historical experiment. We evaluated the NorESM1-M simulation using the Global Precipitation Climatology Project (GPCP) monthly precipitation analysis [18-19]. GPCP is a globally comprehensive, monthly estimate of surface precipitation from satellite. It is available at 2.5° x 2.5° latitude by longitude global grids and spans the period 1979 to the present. The GPCP dataset was validated using actual rainguage measurements and is widely used for climate studies. We analysed the period from 1980 to 2005 coinciding with the last years of the historical simulation. Then we re-gridded the NorESM1-M to the GPCPs 2.5° x 2.5° latitude by longitude grids using bilinear remapping, this is to ensure ease in comparison.
This study focuses on the assessment of the seasonal-mean precipitation amounts. The seasonal seasonal-mean amounts are calculated as the averages of accumulated precipitation during 3 months. This is based on the four major seasons namely; the dry (December-January-February, DJF) and rainy (June-July-August, JJA) seasons; in addition to the transition from dry to rainy season (March-April-May, MAM) and from rainy to dry season (September-October-November, SON) over West Africa. In each season, the ability of NorESM1-M to reproduce the observed precipitation is evaluated and the model bias quantified using the baseline/present-day period from year 1980 to 2005. The model bias is estimated based on Eq. (1)
( )
Where, Pmodel is NorESM1-M simulated precipitation
and Pobs is GPCP precipitation and both are the time
means. A value of zero indicates no systematic difference between NorESM1-M and GPCP. Negative values indicate underestimation while positive value indicates overestimation.
We analysed the seasonal-mean precipitation across West Africa for two periods; the historical period (1980-2005) and the mid-twenty first century (2040– 2065). For the mid-twenty-first century projections, we used simulations forced by greenhouse effects under the three different RCPs described above. The time mean future change in precipitation is calculated following Eq. (2):
( )
Where, ΔP refers to precipitation change, PRCP refers to
the simulated precipitation amounts under RCP 2.6, 4.5, and 8.5 and refers to historical
precipitation.
3. RESULTS
3.1 Evaluation of the Simulated Historical Precipitation: 1980 - 2005
Figure 2 shows the observed seasonal-mean precipitation distribution over West Africa for year 1980 to 2005 based on the GPCP data.
Fig. 2: Observed Seasonal-mean precipitation distribution over West Africa.
Fig. 3: NorESM1-M simulated seasonal-mean precipitation distribution over West Africa.
On the other hand precipitation amount decreases along the coastal region, the so called monsoon jump. The “jump” is partly attributed to the decrease in equatorial Atlantic climatological-mean sea surface temperature due to seasonal intensification of upwelling in the cold tongue [22]. Furthermore, the northward penetration of the ITCZ means that the associated convergence occur far inland, away from the coast [23].
Figure 3 shows that the NorESM1-M simulation depicts the general pattern of the observed precipitation described above. However, notable differences in amount and distribution are readily evident. These differences between NorESM1-M and observation are as shown in Figure 4.
precipitation is confined in this season; precipitation is overestimated in south-eastern Nigeria and southern Cameroun. In addition, there are underestimations of precipitation off the coasts of Guinea and Sierra-Leone. During MAM, there is a notable increase in biases comparative to the preceding season. The NorESM1-M overestimates precipitation over most parts of the region. There are also underestimations around the coastal areas from Nigeria to Liberia. In JJA, there is
further overestimation in precipitation amounts in most parts of the region and an underestimation around the coastal fringes from Nigeria to Senegal. In SON, NorESM1-M generally underestimates precipitation around Liberia-Senegal area and southern Nigeria. Despite these biases, NorESM1-M is able to capture the general feature of the seasonal-mean distribution of precipitation over West Africa.
Fig. 4: Bias in seasonal-mean precipitation distribution over West Africa
3.2 Changes during the mid-twenty first century: 2040-2065
The projected changes in seasonal-mean precipitation distribution over West Africa for the mid-twenty first century are shown in Figure 5. Under the RCP 2.6, the DJF precipitation is projected to slightly increase by ~1 to 15 mm month-1 in most parts of the region. In parts of Mali and Niger, however, the precipitation is projected to decrease slightly in the range of 1 to 5 mm month-1. During MAM precipitation is projected to decrease around Ghana and Cote d’Ivoire area by ~ 5 to 20 mm month-1, with other areas projected to experience slight changes of about ±5 mm. In JJA the pattern of precipitation changes varies considerably with increases in the range of ~80 to 100 mm month-1 around the coasts of Liberia and Sierra Leone. In the inland areas especially around most parts of Nigeria and Mali, precipitation is projected to decrease by ~1 to 45 mm month-1. Elsewhere in the region projected precipitation amounts remain relatively unchanged. In SON precipitation is projected to decrease by ~30 to 80 mm month-1 over the Guinea coast and most part of Nigeria and Cameroun, especially within the Atlantic Ocean. While, in the Liberia-Guinea area, precipitation is projected to increase by ~80 mm month-1.
In RCP 4.5, the projected precipitation pattern shows similar pattern to that of RCP 2.6 for most of the season except that in DJF, precipitation tend to increase around the southern part of the Nigeria-Cameroun border by ~40 mm month-1 and in MAM it is projected to be wetter around Cote d’Ivoire and its environs with the intensity and area of coverage varying slightly. Also RCP 8.5 projects similar pattern to that of RCPs 2.6 and 4.5. However, precipitation increases of ~45 and 30 mm month-1 simulates in DJF and SON around the coasts of Liberia, Sierra Leone, the Atlantic Ocean, parts of Burkina Faso and Niger.
3.3 Towards an Understanding of the Future Changes From Figure 5, the pattern of precipitation changes in the different seasons are similar among the different RCPs. In DJF, the RCP 4.5 and RCP 8.5 depicts a similar pattern especially the increase in precipitation around the southern part of Nigeria-Cameroun border. However, the RCP 8.5 projects a wetter Gulf of Guinea. In MAM, the RCP 2.6 and RCP 8.5 project a similar pattern especially around Cote d’Ivoire where decreases of about 80 mm month-1 are to be expected. The JJA also exhibits similar patterns except that the RCP 2.6 shows a wetter Gulf of Guinea off the coast of Liberia and Sierra Leone. SON projects similar pattern among the three RCPs, with the RCPs showing an increase in precipitation around the Guinea-Sierra
Leone area and their surrounding coasts and a decrease over the Atlantic Ocean.
Also, we address the question of what intensified greenhouse forcing could mean for precipitation over West Africa. Here we compute the spatial averages of the precipitation changes in different seasons for the three RCPs analysed (Figure 6). In DJF, the RCP 4.5 projects the highest change of ~134.7 mm month-1 followed by the RCP 2.6 and then the RCP 8.5 at ~128.6 month-1 and ~106.3 mm month-1 respectively. The MAM, JJA and SON follows similar pattern of projection, with the SON projected to experience the most amount of change followed by the MAM, JJA and DJF, respectively. From figure 6 the highest changes will occur in SON, this may possibly be due to NorESM1-M inability to simulate the annual cycle of precipitation over the region correctly or a possibly shift in precipitation regime over the region. Also, there is little sensitivity of West African precipitation to greenhouse forcing; this is depicted in the little difference between RCP 2.6 and 4.5. It seems that during the mid-twenty first century intensified greenhouse forcing will have relatively little impact on seasonal precipitation especially if the prevailing conditions in which RCP 8.5 projection is based is realised. This may possibly be ascribed to the effect of stabilization of the atmosphere with greenhouse gases, thereby leading to little or no impact in any additional increase of GHGs on precipitation during the mid twenty-first century.
4. SUMMARY AND CONCLUSION
This study analysed the future changes in seasonal-mean precipitation over West Africa during the mid-twenty first century using the NorESM1-M. The model was evaluated against observational precipitation data and it reproduced the general features of the seasonal-mean precipitation distribution over West Africa; including the observed inland decline in precipitation amounts from the Guinea coast to the Sahel and the Ghana-Togo gap, this is in agreement with Nnamchi, Anyadike and Emeribe [24].
Fig. 6: RCPs projected changes in seasonal-mean precipitation over West Africa during mid- twenty first century.
The NorESM1-M projected increase in precipitation over West Africa is generally consistent with some other projection studies [8, 9, 12]. Also, the amount of projected precipitation changes varies from one area to another and between the RCPs.
From the above results, there may likely be important changes in the seasonal-mean precipitation over West Africa during the mid-twenty first century. However, the present study is based on only one climate model. Further studies of other climate models are therefore necessary to ascertain the patterns of projected changes in seasonal-mean precipitation over West Africa.
5. ACKNOWLEDGEMENTS
The contributions of Chukwudi S. Ekwezuo and Hyacinth C. Nnamchi were partly funded by the European Union FP7/2007-2013 PREFACE Project (www.preface.b.uib.no/). The model outputs analyzed are available from the CMIP5 website: http://cmip-pcmdi.llnl.gov/cmip5/.
6. REFERENCES
[1] OECD Atlas on Regional Integration in West Africa.OECD Publishing, Paris 2007. http://www.oecd.org/swac/publications/398029 65.pdf. Accessed on May 10, 2015.
[2] Omotosho, J. B and Abiodun, B. J. A numerical study of moisture build up and rainfall over West Africa. Meteorological Applications. Vol. 14, Pp. 209-225. 2007.
[3] Bielli, S., Douville, H. and Pohl, B. Understanding the West African monsoon variability and its remote effects: an illustration of the grid point nudging methodology. Climate Dynamics, 35, pp. 159-174, 2009.
[4] Nnamchi, H. C. and Li, J. Influence of the South Atlantic Ocean Dipole on West African Summer Precipitation. Journal of Climate, 24: 1184-1197. 2011.
[5] Rodrigues, L. R. L., García-Serrano, J. and Doblas-Reyes, F. Seasonal prediction of the intraseasonal variability of the West African monsoon precipitation. Física de la Tierra. 25: 83-97. 2013.
[6] Mahmood, R.; Pielke, R. A.; Hubbard, K.G.; Niyogi, D.; Dirmeyer, P. A.; McAlpine, C.; Carleton, A. M.; Hale, R.; Gameda, S.; Beltrán-Przekurat, A.; et al.
Land cover changes and their biogeophysical effects on climate. International Journal of
Climatolology. 34, 929–953. 2014.
[7] Kim, K.-M., W. K.- M. Lau, Y. C. Sud, and Walker, G. K. Influence of aerosol-radiative forcings on the diurnal and seasonal cycles of rainfall over West Africa and eastern Atlantic Ocean using GCM simulations. Climate Dynamic. 35: 115-126, 2010
[8] Chikezie, C., Ibekwe, U. C., Ohajianya, D. O., Orebiyi, J. S., Henri-Ukoha, A., Ukoha, I. I., Osuji M.N. and Anthony G. Climate Change and Perceived Climate Hazards: a Trend analysis in Southeast Nigeria. International Journal of Weather, Climate Change and Conservation Research. 2(1).1-10. 2016
0 50 100 150 200 250 300 350
DJF MAM JJA SON
Pr
e
ci
p
itat
io
n
c
h
an
ge
(
m
m
)
Season
RCP 2.6
RCP 4.5
[9] Intergovernmental Panel on Climate Change (IPCC). The Physical Science Basis. Contribution of Working Group I to the Fifth Assessment Report of the Intergovernmental Panel on Climate Change [Stocker, T. F., D. Qin, G. K. Plattner, M. Tignor, S. K. Allen, J. Boschung, A. Nauels, Y. Xia, V. Bex and P. M. Midgley (Eds.)]. Cambridge University Press, Cambridge, United Kingdom and New York, NY, USA, pp. 1535. 2013.
[10] Yunana, D. A., Shittu, A. A, Ayuba S, Bassah, E. J. and Joshua W. K. “Climate change and lake water resources n Sub-Saharan Africa: A case Study of Lake Chad and Lake Victoria”, Nigerian Journal of Technology, Vol. 36, No. 2, 648 – 654, 2017.
[11] Obasi, A. A, Ogbu, K. N, Ndulue E. L, Ogwo, V. N. and Mbajiorgu, C. C. “Prediction of the impacts of climate changes on the stream flow of Ajali river watershed using SWAT model” Nigerian Journal of Technology, Vol. 36, No. 4, 1286 – 1295, 2017.
[12] Ekwezuo, C. S., Phil-Eze, P. O. and Nnamchi, H. C. Modelled present-day and future changes in annual rainfall over West Africa. Accai-UNN International Journal of Climate Change Research.
(In press).
[13] Vertenstein, M., Craig, T., Middleton, A., Feddema, D. & Fischer, C. CESM1.0.3 User Guide Online at http://www.cesm.ucar.edu/models/cesm1.0/ces m/cesm_doc_1_0_4/ug.pdf. 2012.
[14] Gent, P., Danabasoglu, G., Donner, L., Holland, M., Hunke, E. and Co-Authors. The community climate system model version 4. Journal of Climate. 24(19): 4973- 4991. 2011.
[15] Meinshausen, M. and Co-Authors. The RCP greenhouse gas concentrations and their extensions from 1765 to 2300. Climatic Change. 109: 213-241. 2011.
[16] van Vuuren, D. P., Edmonds, J., Kainuma, M. and Co-authors. The representative concentration pathways: an overview. Climatic Change. 109: 5-31. 2011.
[17] Riahi, K., Grübler, A., and Nakicenovic, N. Scenarios of long-term socio-economic and environmental development under climate stabilization. Technol. Forecast Soc. Chang. 74: 887-935. 2007.
[18] Clarke, L. E., Edmonds, J. A., Jacoby, H. D., Pitcher, H., Reilly, J. M. and Richels, R. Scenarios of
greenhouse gas emissions and atmospheric concentrations. Sub-report 2.1a of Synthesis and Assessment Product 2.1. Climate Change Science Program and the Subcommittee on Global Change Research, Washington DC. 2007.
[19] van Vuuren, D. P., Eickhout , B., Lucas, P. L. and den Elzen, M. G. J. Long-term multi-gas scenarios to stabilise radiative forcing-exploring costs and benefits within an integrated assessment framework. Energ J. 27: 201-233. 2006.
[20] Adler, R. F., Huffman, G. J., Chang, A., Ferraro, R., Xie, P., Janowiak, J., Rudolf, B., Schneider, U., Curtis, S., Bolvin, D., Gruber, A., Susskind, J., Arkin, P and Nelkin, E. The Version 2 Global Precipitation Climatology Project (GPCP) Monthly Precipitation Analysis (1979-Present). Journal of
Hydrometeorology. 4: 1147-1167. 2003.
[21] Huffman, G. J., Adler, R. F., Arkin, P., Chang, A., Ferraro, R., Gruber, A., Janowiak, J., Mcnab, A., Rudolf, B. and Schneider, U. The global precipitation climatology project (GPCP) combined precipitation dataset. Bulletin of the
American Meteorological Society. 78: 5-20. 1997.
[22] Mitchell, T. P. and Wallace, J. M. The annual cycle in equatorial convection and sea surface temperature. Journal of Climate. 5: 1140-1156. 1992.
[23] Giannini, A., Saravanan, R. and Chang, P. Oceanic forcing of Sahel rainfall on interannual to interdecadal time scales. Science, 302(5647): 1027-1030. 2003.
[24] Nnamchi, H. C., Anyadike, R. N. C. and Emeribe, C. N. Spatial patterns of twentieth century mean seasonal precipitation over West Africa. Nigerian Journal of Space Research. 6: 89-101. 2009.
[25] Engelbrecht, F. A., Landman, W. A., Engelbrecht, C. J., Landman, S., Bopape, M. M., Roux, B., Mcgregor, J and Thatcher, M. Multi-scale climate modelling over Southern Africa using a variable-resolution global model. Water SA. 37: 637-658. 2011.