ISSN 0015–5659 www.fm.viamedica.pl
Address for correspondence: J. Skrzat, PhD, Department of Anatomy, Collegium Medicum, Jagiellonian University, ul. Kopernika 12, 31–034 Kraków, Poland, tel: +48 12 422 95 11, e-mail: [email protected]
Three dimensional visualisation and morphometry
of bone samples studied in microcomputed
tomography (micro-CT)
B. Leszczyński
1, J. Skrzat
2, M. Kozerska
2, A. Wróbel
1, J. Walocha
21Department of Medical Physics, M. Smoluchowski Institute of Physics, Jagiellonian University, Krakow, Poland 2Department of Anatomy, Jagiellonian University, Collegium Medicum, Krakow, Poland
[Received 24 February 2014; Accepted 29 April 2014]
This article highlights the utility of micro-computed tomography (micro-CT) for cha-racterising microscale bone morphology. For this purpose we tested selected samples of the human bones (Wormian bone, rib, lumbar vertebra) to reconstruct external and internal morphological features. Selected bony samples were investigated using a micro-CT scanner (Skyscan 1172, N.V., Aartselaar, Belgium). The image resolution of scans varied from 5 to 27 µm/pixel depending on the bone sample. We used CTvox software (by Skyscan) to perform volume rendering of the sam-ples. Further, 3-dimensional geometrical models were reconstructed using the CTvol application. Such models enabled graphical distinction between osseous components of various morphology and were used to visualise the Haversian canal system inside the compact bone of the rib. Applying a modified transfer function for volume rendering we presented the overall morphology of the Wormian bone and small vascular channels penetrating its interior. As an example of quantitative analysis based on micro-CT scans we compared the trabecular structure of the lumbar vertebrae with CTAn software. Significant differences in percent bone volume (BV/TV) were determined. Micro-CT was found to be a very accurate and helpful method to study small anatomical structures of the bones in micro scale. (Folia Morphol 2014; 73, 4: 422–428)
Key words: bone microarchitecture, micro-computed tomography, micro-imaging
INTRODUCTION
The investigation of microscopic bone morpho-logy requires the use of techniques that permit the visualisation of anatomical details in the scale of microns. Until recently, morphometric histological analysis of microtom sectioned samples was the
prin-ciple technique employed which fit such criteria. This
technique produces a series of slices which can be viewed under light microscope. The images obtained are 2-dimensional (2D) and only rarely are 3D
recon-structions produced from photographed histological slices. The scarcity of such reconstructions is due to the time consuming nature of the process which re-quires special sample preparation involving chemical
fixation and staining [3]. As a result, other methods
of microscopic bone structures. Insight into 3D mic-roscopic bone morphology became possible with invention of the microcomputed scanners. Mico-CT
systems first came into use in the early 1980s. How
ever, many scientists believe that it wasn’t until the application of the cone-beam reconstruction algo-rithm developed by Lee Feldkamp in 1984 that this system was optimised for use [4].
The microtomograph contains 2 main parts: the X-ray source and the detector. There are 2 types of X-ray sources: a synchrotron and a microfocus X-ray tube which is more common. The X-ray cone beam is attenuated in the sample and produces a 2D sha-dow projection. The projection is captured by a 2D
Xray camera and saved as a graphic file. During the
scanning the sample rotates with a tiny angular step (< 1°). The projection is recorded for each step from 0° to 180° or 360° (Fig. 1).
The acquired set of projections is used for image
reconstruction based on the modified Feldkamp algo -rithm. As a result, a series of cross-section images of the
scanned object are obtained with isotropic pixels. These
cross-sections are typically used to create virtual 3D mo-del which can be subjected to morphometric analysis. In clinical practice peripheral quantitative CT (pQCT) is increasingly being used to measure bone mineral density (BMD) and for the trabecular bone architecture analysis of human limbs. In stomatology cone beam CT (CBCT) is used as an alternative to traditional radiography of teeth. Technically, these two methods can be considered as micro-CT but the
image resolution is much worse. For example pixel size
for pQCT Scanco Xtreme CT ranges 41–246 µm [14]. Micro-CT is a very powerful tool for both qualita-tive and quantitaqualita-tive analysis of the structure of small samples. Micro-CT is a one of very few methods able to determine BMD. Therefore, the majority of micro-CT scanners can be used only for preclinical analysis because they require small tissue sizes which can be
sampled during excisional biopsy, surgical manage -ment or from autopsy material.
Data obtained from micro-CT scanners permits the assessment of structural properties of cortical and trabecular bone. Quantitative bone morphometry is based on the indices which can be measured using
image analysis softwares, for example CTAnalyser
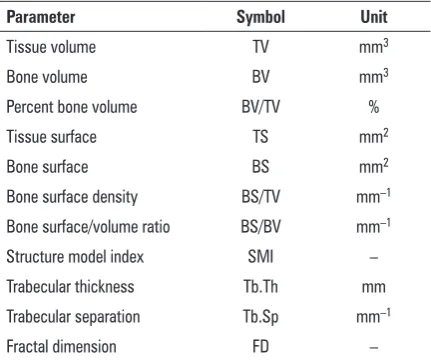
[16] or ImageJ [rsbweb.nih.gov/ij/]. Common mor-phometric parameters of bone tissue were presented
in Table 1 and their definitions can be found in the paper written by Bouxsein et al. [1].
Micro-CT can also become an alternative technique to histomorphometry [3]. Microtomography produces grey scale cross-sections images of the sample. In order to perform quantitative analysis the obtained images have to be binarised. The binarisation process separa-tes the object of interest from the so called
“backgro-und” (for example bone trabeculas from the marrow).
The background becomes black whereas the bone’s structure is presented in white. To obtain a clear dist-inction between separated structures an appropriate threshold level must be set [12]. This threshold can be
defined by the researcher or by applying appropriate
automatic thresholding. Nevertheless, this step can be
problematic and requires vast experience and intuition
on the part of the investigator.
Contrary to histomorphometry, micro-CT analysis allows all structural parameters of a trabecular bone Table 1. Basic parameterswhich can becalculated from micro--computed tomography data using computer software
Parameter Symbol Unit
Tissue volume TV mm3
Bone volume BV mm3
Percent bone volume BV/TV %
Tissue surface TS mm2
Bone surface BS mm2
Bone surface density BS/TV mm–1
Bone surface/volume ratio BS/BV mm–1
Structure model index SMI – Trabecular thickness Tb.Th mm Trabecular separation Tb.Sp mm–1
Fractal dimension FD –
to be measured in the 3D space without tissue de-struction for sampling and yields a high resolution
output with voxels sizes of 1 µm or less.
The aim of this study is to present the utility of micro-CT scanning in displaying morphological features of bone tissue samples through volumetric reconstructions and geometrical models. Hence, the main structural parameters quantitatively characteri-sing the bone geometry were measured for selected bone samples.
MATERIALS AND METHODS
Selected samples of macerated human bones were used to present the imaging accuracy of micro-CT scanning. The Wormian bone served to present how volume rendering can depict inner structures on top of presenting overall morphology. In the same vein, the following internal features of bone architecture were analysed in the following samples:
— Trabecular geometry was revealed from a body of the lumbar vertebra;
— Vascular canals were presented in the fragment of the rib;
— Wormian bone diploe was imaged.
Skyscan 1172 X-ray computed microtomograph (Skyscan Aartselaar, Belgium) was used for scanning the above mentioned samples. The scanner was
equi-pped with an 11 Megapixel (4024 × 2680 in total; 4000 × 2400 effective) Xray detector and a 12bit digital Xray camera with 24 × 36 mm field of view.
The X-ray source voltage was set to 80 kV and current to 100 µA. The projection images were acquired over an angular range of 180° with a small angular step. In
the resultant images pixel size ranged 5–27 µm. Cap -tured projections of bone samples were reconstructed using NRECON software by SkyScan. From the series of micro-CT scans we visualised the morphological features underlying selected bone anatomy. For this purpose we used volume rendering and generated geometrical models based on image segmentation.
Volume rendering
Volume rendering is a technique used to display a 2D projection of a 3D discretely sampled data set acquired in a regular pattern (slices) by the micro-CT scanner. This procedure was performed with the aid of
the CTvox software (ver. 2.6). Volume rendering requi -res appropriate mapping of opacity and grey values
attributed to the voxels in the final reconstruction.
This was done by modifying the transfer function. In
order to show the internal morphology of the studied bone samples we clipped the planes to interactively
cut away superficial structures.
Creating the geometrical models and morphometry This procedure was performed on the imaging structures having different density levels. Segmen-tation was performed using the CTAn software (ver.
1.13) to highlight and extract the structures under
study while eliminating unwanted objects. The latter application is used to derive quantitative parameters and construct visual models from scanned datasets obtained with SkyScan micro-CT scanner.
From the segmented image data the geome-trical models of the anatomical structures were generated by means of the CTvol software [15]. This program allowed binarisation using intensity based threshold criteria. After binarisation 3D mo-dels were created as triangular meshes obtained by a surface rendering algorithm. Furthermore, on the computer model data we measured se-lected morphological parameters characterising properties and structure of the trabecular bone harvested from 2 lumbar vertebrae each belon-ging to a different males (aged 25 and 64 years). For quantitative comparison of changes in the trabecular structure caused by ageing process, we calculated following parameters: trabecular thickness (Tb.Th), trabecular separation (Tb.Sp), bone volume density (BV/TV) and fractal dimension (FD), using CTAn software.
RESULTS
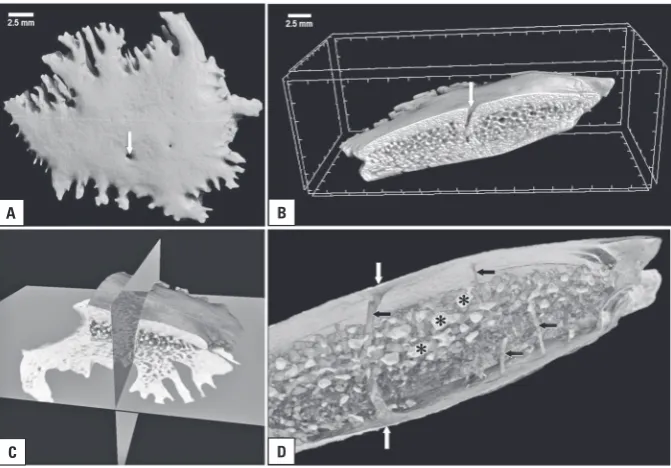
The results of volume rendering and geometrical modelling are presented in a series of images (Figs. 2–5). Volumetric reconstructions of the selected spe-cimens (a Wormian bone, a rib and the body of the lumbar vertebrae) clearly depict their anatomy in detail. Overall morphology and internal structure of the Wormian bone are presented in Figure 2. The multiplanar projection of the cross-sectional view of the Wormian bone reveals the 3-layered composition of the structure. Two layers of the compact bone
(external and internal) are distinguished from the
middle layer of the spongy bone. On top of revealing overall morphology, micro-CT 3D reconstructions also permit the differences between the thicknesses of the singular layers of the bone to be observed.
morphology are presented in Figures 2 and 3. Micro-CT scanning appeared to be a very useful technique for
studying both the external and internal morphology of
the small osseous structures like Wormian bones (Fig. 2). The internal morphology of the other bone tissue samples captured by the micro-CT are presented in Figure 3. In the sample harvested from the human rib the compact bone is visualised with the Haversian canals reconstructed.
The generated geometric model of the rib sam-ple visualised the relationship between the spongy bone and the compact bone which surrounds. This model enables graphical distinction between osseous components having various morphological characters
reflected by the grey intensity of the voxels making
some structure appear semitransparent (Fig. 4).
The quantitative analysis revealed significant diffe -rences between samples of lumbar vertebrae derived
Figure 2. External and internal morphology of the Wormian bone reconstructed from high-resolution micro-computed tomography scans by volume rendering; A. Overall morphology of the Wormian bone. The interdigitation located along the bone’s edge are visible in detail. The arrow indicates the opening of the vascular channel; B. Reconstruction of the 3-layered osseous composition: compact bone — spongy
bone — compact bone, an arrangement typical for flat cranial bones; C. Multiplanar reconstruction combined with volume rendering showing partially the external surface of the bone and its interior in the axial and horizontal projection; D. Close up view of the interior of the Wormian bone showing vascular channels (marked by arrows) and numerous pores of the spongy bone (marked by asterisks).
Figure 3. Three-dimensional reconstruction of the rib architecture (A). Cross-section shows the spongy bone (trabeculae) and the compact bone (osteons). Partially cutting the outer layer of the compact bone revealed the longitudinal course and interconnections of the Haversian canals. A virtual model of the Haversian system in the rib sample (B).
A B
C D
from young and old individual. The trabecular sepa-ration (Tb.Sp) increased tremendously with age while the percent bone volume (BV/TV) was considerably reduced. Conversely, trabecular thickness (Tb.Th) was not altered by the aging process. These structural
changes also affected the geometrical complexity of the trabecular bone in examined samples as estima
-ted by the fractal dimension which varied by about 0.1 (Table 2).
Differences in Tb.Sp can be observed in the vo-lumetric reconstruction presented in Figure 5. In the case of the young individual (Fig. 5A) the osseous trabeculae are tightly packed, whereas in the sample of the old individual (Fig. 5B) the osseous trabeculae are more scattered and dominate the cavities inside the spongy bone.
DISCUSSION
Computed tomography is one of the most po-pular medical imaging methods. Unfortunately, CT is not a perfect modality because of limited spatial resolution. This resolution is strongly dependent on radiation dose. The best resolution which can be applied while maintaining the safety limit for the
patient is about 0.5 mm per pixel [2]. However, there Figure 4. A geometrical model (A) and semi-transparent model (B) of the rib anatomy in the transverse section. Segmented compact bone and the spongy bone visualised in distinct grey levels. The osseous septa and marrow cavities are clearly visible in the spongy bone.
Table 2. Results of quantitative analysis of the lumbar vertebra
of the young and old individual. A significant ageing effect on
the bone parameters is marked by an asterisk
Age 25 years 64 years
BV/TV* 32% 10%
Tb.Sp* 450 μm 1051 μm
Tb.Th 169 μm 167 μm
FD 2.60 2.51
Figure 5. Volume renderingof the spongy bone from human lumbar vertebrae demonstrates significant differences in trabecular architecture
related to the age of individual; a young individual 25 year of age (sample A) vs. an old individual 64 years of age (sample B). Morphometric parameters characterizing these two samples are presented in Table 2.
A B
are trials aiming to improve this value using zflying
spot or dual source CT techniques [8, 9]. In spite of
applied modifications the obtained resolution is still
not good enough to visualise tiny structures inside the human body.
Contemporary microtomographic scanners, such as SkyScan 1272, are capable of detecting 0.35 µm isotropic details. Therefore, the usefulness of this technique is appreciated by many researchers in evaluating bone morphology because it permits the study of tissue organisation on the microscopic level [1, 6, 7, 11].
The intricate geometry of the bone tissue necessi-tates high imaging resolution which further allows the creation of sophisticated computer generated models [13]. The most important advantage of micro--CT is that it is the only method which is able to create full 3D models and measure geometrical parameters without destroying components of the sample [13]. Both direct volume rendering and geometrical mo-dels generated from a stack of micro-CT-scans can accurately depict bone architecture.
From the technical point of view the micro-CT scanner is very similar to a hospital CT scanner. How-ever, the micro-CT system is much smaller which means that sample size has to be reduced usually to several centimetres. Therefore, micro-scanning of the whole human bone is practically impossible because of technical limitations related to the size of the detector.
Although the micro-CT provides submicron spa-tial resolution, the contrast resolution for specimens that are composed of different tissues (e.g.: bone, muscles, fat) is much worse than hospital CT scans. Therefore micro-CT scanners are recommended for
studying mainly calcified tissues [2, 5].
Visualisation of osseous structures greatly depen-ds on the appropriate adjustment of the transfer
fun-ction which governs the mapping of pixels in the final
image. As a result, it is possible to obtain contrasted images of the osseous structures or visualise the air
filling the pores or canals in the dry bone and in this
way obtain virtual endocasts of the region of interest. In our study virtual micro-endocasts depicted the tubular morphology of the vascular canals within the Wormian bone much better than normal CT imaging.
Volume rendering provides high fidelity in ima -ging osseous detail. Nevertheless, geometrical models are necessary to reliably study the functional mic-ro scale morphology of bone. Micmic-ro-CT is the most
convenient modality for the latter purpose. Detailed computer mesh or solid models can be created using sets of micro-CT scans and segmentation algorithms. Further more, numerical simulations can be performed
and can be used to explain the relationship between
the shape of the structure and its function. Currently, geometrical models obtained from micro-CT scans have been applied for biomechanical studies of the cochlea and used in the analysis of the hearing pro-cess[10].
CONCLUSIONS
Micro-CT is a very accurate technique for the eva-luation of bone architecture. It provides high-quality 2D and 3D reconstructions. Volume rendering allows the visualisation of bone morphology and interactive sectioning of the sample. Such a virtual management helps to interpret deviations from normal anatomy and facilitate diagnosing of the pathological changes that may occur inside the bone.
ACKNOWLEDGEMENTS
The research was carried out with the equipment
purchased thanks to the financial support of the Euro -pean Regional Development Fund in the framework of the Polish Innovation Economy Operational Program (contract no. POIG.02.01.00-12-023/08).
REFERENCES
1. Bouxsein ML, Boyd SK, Christiansen BA, Guldberg RE, Jepsen KJ, Müller R (2010) Guidelines for assessment of bone microstructure in rodents using micro-computed tomography. J Bone Miner Res, 25: 1468–1486.
2. Durand EP, Rüegsegger P(1992)High-contrast resolution of CT images for bone structure analysis. Med Phys,19: 569–573.
3. Fajardo RJ, Ryan TM, Kappelman J (2002) Assessing the accuracy of high-resolution X-ray computed tomography of primate trabecular bone by comparison with histolo-gical sections. Am J Phys Anthropol, 118: 1–10. 4. Feldkamp LA, Davis LC, Kress JW (1984) Practical
conebe-am algorithm. J Opt Soc Am A, 1: 612–619.
5. Flohr TG, Raupach R, Bruder H (2009) Cardiac CT: How much can temporal resolution, spatial resolution, and volume coverage be improved? JCCT, 3: 143–152. 6. Genant HK, Jiang Y (2006)Advanced imaging assessment
of bone quality. Ann N Y Acad Sci, 1068:410–428. 7. Hahn M, Vogel M, Pompesius-Kempa M, Delling G (1992)
Trabecular bone pattern factor: a new parameter for simple quantification of bone microarchitecture. Bone, 13: 327–330.
9. Matsubara K, Koshida H, Sakuta K, Takata T, Horii J, Iida H, Koshida K, Ichikawa K, Matsui O (2012) Radiation dose and physical image quality in 128-section dual-source computed tomographic coronary angiography: a phantom study. J Appl Clin Med Phys, 13: 3959.
10. Poznyakovskiy AA, Zahnert T, Kalaidzidis Y, Schmidt R, Fischer B, Baumgart J, Yarin YM (2008) The creation of geometric three-dimensional models of the inner ear based on micro computer tomography data. Hearing Research 243: 95–104.
11. Rüegsegger P, Koller B, Müller R (1996)A microtomo-graphic system for the nondestructive evaluation of bone architecture. Calcif Tissue Int,58:24–29.
12. Scherf H, Tilgner R (2009)A new high-resolution computed tomography (CT) segmentation method for trabecular
bone architectural analysis. Am J Phys Anthropol, 14: 39–51.
13. Stauber M, Müller R (2005) Volumetric spatial de-composition of trabecular bone into rods and plates: a new method for local bone morphometry. Bone, 38: 475–484.
14. Scanco (2013) XtremeCT Scanco Medical. Available from: http://www.scanco.ch/fileadmin/webmaster_img/Brochu -res/XtremeCT_v3.pdf.
15. Skyscan (2013) CTvox Quick Start Guide (for Software Version 2.6). Availbale from: http://www.skyscan.be/next/ CTvox_QuickStartGuide.pdf.