Comparative study of MBR and activated sludge in the
treatment of paper mill wastewater
M. Lerner*, N. Stahl** and N.I. Galil*
*Department of Civil and Environmental Engineering, Technion – Israel Institute of Technology, Haifa 32000, Israel (E-mail:[email protected];[email protected])
**American-Israeli Paper Mills (AIPM), Hedera, Israel (E-mail:[email protected])
AbstractThe study was based on a full scale activated sludge plant (AS) compared to a parallel operated pilot membrane bioreactor (MBR) with flat sheets membranes. Both systems received their influent from an anaerobic bioreactor treating paper mill wastewater. MBR produced an effluent of much better quality than AS in terms of suspended solids, containing 1 mg/L or less in 80% of the monitoring time, while the AS effluent contained 12 mg/L. This could save the necessity of further treatment by filtration in the case of MBR. Other effluent quality parameters, such as organic matter (COD and BOD), phosphorus and ammonia nitrogen, did not indicate substantial differences between AS and MBR. Calcium carbonate scaling and formation of a bacterial layer on the membrane caused severe flux reduction. The membrane blockage because of scaling and biofouling proved to be very serious, therefore, it required proper and more complicated maintenance than the AS system. This study leads to the conclusion that in the case of paper mill wastewater, after anaerobic biotreatment, if there is no need for excellent effluent quality in terms of suspended solids, the replacement of the AS by the MBR would not be strongly justified, mainly because of maintenance cost.
KeywordsActivated sludge; anaerobic pre-treatment; membrane bioreactor; paper mill
Introduction
Water and fiber are necessary elements in the paper industry. During the papermaking process highly polluted wastewater is generated. The paper industry makes a lot of efforts in order to improve purification and quality of liquid effluents. In recent years papermak-ing effluents had achieved relatively low levels of contaminants (Webb, 2003). However, the continued tendency to increasing stringency of regulated wastewater discharge stan-dards and the decreasing reserves of fresh water in the world make the paper industry continue to search for an appropriate solution for the improvement of effluent quality. One of the ways to meet these new standards is the upgrading of existing biological treat-ment facilities or the application of advanced secondary treattreat-ment technologies.
Activated sludge treatment (AS) systems are often used for pulp and paper mill waste-water purification, showing high organic matter removal efficiency. However, AST is highly sensitive to external disturbances of a physical and/or of a chemical nature and this often results in high concentration of suspended solids and turbidity in the effluent, reducing the amount of active biomass in the bioreactor, creating sludge bulking and foam-ing in the aerated basin (Metcalf and Eddy, 1991). In the case of paper industry these disturbances may vary from sudden changes in pH or in organic loading rate to toxicity caused by resins, acids or chlorinated organic compounds.Sarlinet al.(1999)reported that unusual changes in the paper mill wastewater characteristics, caused by spills of biocides, oils, dyes, acids and other chemicals, could reduce biomass activity and have a negative effect on biosolids settleability. Efficient separation between biosolids and the liquid effluent phase is one of the most critical and difficult goals of the AS process for obtaining
Water
Science
&
T
echnology
Vol
55
No
6
p
p
23–29
Q
IWA
P
ublishing
2007
low total suspended solids (TSS) concentration and turbidity (Metcalf and Eddy, 1991). Shtahlet al.(2004)reported that in the case of paper mill wastewater treatment by conven-tional full scale AS, settling and clarification problems were regularly encountered and the process was characterized by high TSS effluent concentration and by high SVI.
Membrane bioreactors (MBR) can be considered a modification of the conventional AS, using membrane filtration instead of sedimentation. The use of membrane separation technology could improve liquid/biosolids separation. Advantages of the MBR are associ-ated with the production of effluent almost free of TSS and bacteria, much higher MLSS concentration in the bioreactor, higher sludge residence time (SRT), smaller bioreactor size and low biomass yields (Cicek et al., 1998). Galil et al. (2003) found that in comparison with AS, the MBR process can produce an effluent of much better quality in terms of organic matter, suspended solids, and nutrients. Dufresneet al.(1998)reported results indicating that lignin concentration and toxicity of 48 h-LC50forDaphnia magna were significantly lower in MBR than AS effluent during chemi-thermo-mechanical pulp (CTMP) wastewater purification.
The disadvantages associated with MBR include high investment cost and relatively difficult operation and maintenance. Membrane fouling problems require frequent cleaning procedures by chemicals, with intermittent operation of the system. Additionally, MBR running at high SRT could be accompanied by the accumulation of non-biodegradable organic and inorganic compounds in the bioreactor which could be harmful to the microbial population or to the membrane structure (Ciceket al., 1999).
MBR systems have found broad application in municipal and industrial wastewater treatment (Cicek, 2003). In the case of pulp and paper industry, most of the reported activity of MBR is more at the pilot-scale trial level than full-scale installation. Webb (2001)reported that there are successful full-scale MBR units installed in the paper mills in The Netherlands and France showing high effluent quality in terms of COD, BOD and TSS. It should be noted that most of the MBR studies and reports focused on the treat-ment of raw wastewater with mechanical pre-treattreat-ment only. However, in the nineties, the combination of anaerobic pre-treatment with aerobic bioprocess became popular, especially in the treatment of industrial wastewater in pulp and paper industries. Therefore, the aim of the work presented in this paper was to investigate and compare the performances obtained during the simultaneous operation of MBR pilot and a full-scale AS system operated in parallel on the treatment of the effluent obtained from an anaerobic bioreactor.
Materials and methods
The project was carried out at the American Israel Paper Mills (AIPM) group, Hedera, Israel. The industrial complex is producing approximately 300,000-ton tissue, fine and packaging papers per year on the one site and consuming about 2,600,000 m3 of fresh water per year. The wastewater treatment plant (WWTP) includes equalization tank (750 m3), primary treatment by ALGAS drum filter, anaerobic pre-treatment operated since April 2002, and AS. The anaerobic reactor installed in WWTP is an Upflow Anaerobic Sludge Blanket (UASB – Paques’ Internal Circulation Reactor) with a tall, slim design reactor (V ¼ 1,200 m3). The aerobic AS plant includes a completely-mixed aeration basin (V ¼ 8,500 m3) equipped with surface aerators and followed by four clari-fiers for biosolids separation. The experimental membrane bioreactor (MBR) pilot was provided by Kubota and operated in parallel with the full-scale AS system. In this type of MBR solids are removed from the treated water by driving the mixed liquor on the outside of the membrane panel through to the inside of the panel. The liquid head above the membranes (1.3 m) proves the driving force needed to move the liquid through the
M.
Lerner
et
al.
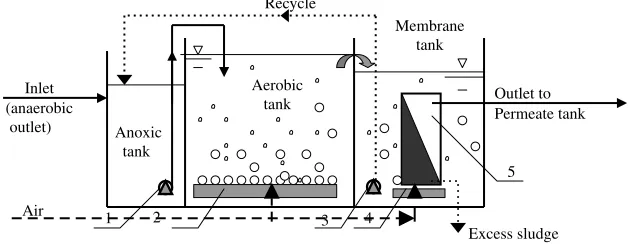
membrane material. The flat sheets of membrane were manufactured from poly-olefin with pore size of 0.1 to 0.4 microns (micro-filtration). The total amount of membranes was 75 with a total surface area of 60 m2. The pilot had four tanks (anoxic, aerobic, membrane and permeate) with volumes 5, 11, 9 and 7 m3, accordingly, as shown in Figure 1. The aerobic and membrane tanks were arranged with fine and coarse bubble air diffusers, accordingly. The operational flux of the MBR system was 20.8 L/m2phr.
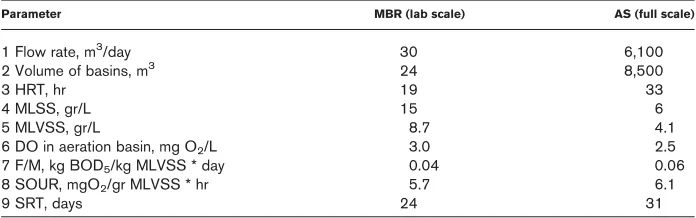
The influent treated either by the AS plant or by the MBR pilot was the effluent of the UASB reactor. Table 1 presents the quality of this influent. The average operating parameters of the AS plant and MBR pilot during the 7-month parallel experimental work are summarized inTable 2. Quality parameters such as COD, TSS, DO and MLSS were monitored daily while BOD, NH4-N and TP were measured twice per week. The analytical procedures were performed in accordance with theStandard Methods (1997).
Results and discussion Organic matter removal
Results of organic matter removal by AS and by MBR are summarized in Figures 2, 3 and 4, expressed as COD and BOD. InFigure 2we can see that during all the experimen-tal work period effluent COD concentrations were identical for both AS and MBR. The average effluent COD concentrations of AS and MBR were 105 and 102 mg/L, accord-ingly, with roughly similar fluctuation (Figure 3). Similar results were also observed in terms of average BOD removal: 1 – 5 mg/L for MBR and 3 – 7 mg/L for AS.
Suspended solids removal
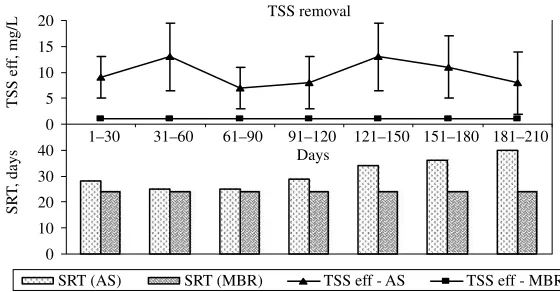
Data summarized inFigures 5 and 6indicate that, as expected, MBR was dramatically more efficient than AS in the removal of the suspended solids. TSS removal efficiency of MBR was close to 100% during all the time, with effluent values equal to or less than 1 mg/L and without any fluctuation. The effluent TSS concentrations of AS varied from 6 to 13 mg/L, also indicating high fluctuations. It should be noted that the sludge residence time in the MBR was shorter than in AS (24 days vs. 25– 40 days, based on average values). The higher MBR suspended solids removal effectiveness was the result of the fact that separation of biosolids by membranes is independent of the biosludge flocculation and settling ability.
Phosphorus removal
According to the Israeli environmental regulations for paper industry, the average total phosphorus (TP) effluent concentration should not exceed 1 mg/L, therefore, TP removal
Figure 1 Schematic diagram of the submerged membrane bioreactor experimental (MBR).
1 – submerged pump, 2 – fine bubble air diffusers, 3 – recycle sludge pump, 4 – coarse bubble air diffuser, 5 – membrane unit.
M.
Lerner
et
al.
obtained by the MBR pilot was checked in comparison with the AS. During the first three months of the MBR pilot operation, no special phosphorus removal methods were used, besides the bioprocess itself. In this period the effluent TP concentrations of MBR and AS were about 2 – 3 and 3 – 4 mg/L, accordingly (seeFigure 7). Since the effluent TP was higher than permitted by the regulations, ferric chloride solution (40%) was added to the aeration tanks of MBR and AS in order to reduce the effluent phosphorus concentration.
Data inFigure 7indicate that in spite of the relatively high ferric chloride doses used for the phosphorus removal (from 50 to 64 mg Fe/L added to the MBR), the desired TP concentration (1.00 mg/L or less) could not be achieved. The same situation was observed in the AS with smaller doses of Fe. Apparently, considerable amounts of ferric chloride were wasted on the reaction with organic and inorganic compounds, which were presented in the mill wastewater. On the other hand, increasing Fe concentration could damage the membranes and, therefore, 64 mg Fe/L was the maximum concentration used for the improvement of phosphorus removal.
Nitrogen removal
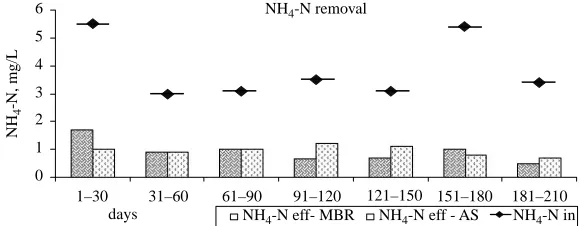
Figure 8presents results of nitrogen removal by AS and MBR in terms of ammonia nitrogen (NH4-N). It can be seen that NH4-N effluent concentrations were similar for both AS and MBR systems (close to 1 mg/L). Longer retention time of nitrifying bacteria in the AS bioreactor, and higher amounts of biomass (MLVSS) in the MBR, did not substantially change nitrification efficiency in either bioreactor.
MBR pilot operation problems
[image:4.612.97.451.145.216.2]At the beginning of the experimental work, several samples of MBR effluent indicated high total bacteria count (about 2.9 – 6.5p106CFU/mL). This phenomenon could be explained by the fact that during the first two months of MBR operation the chemical cleaning of the membranes was performed according to the MBR producer directives. This led to the formation of a bacterial layer on the membrane inner part. After implementation of the membrane cleaning procedure with citric acid and sodium hypo-chlorite and increasing of the cleaning frequency (once per 2 – 3 weeks), the bacterial Table 1Average characteristics of the MBR and AS influent (anaerobic effluent)
Parameter Value Parameter Value
1 pH 6.57^0.18 6 TSS, mg/L 300^120
2 Total COD, mg/L 910^320 7 TKN, mg/L 30.9^8.5
3 Total BOD, mg/L 430^180 8 NH4-N, mg/L 4.3^3.3
4 Ca Hardness, mg/L as CaCO3 420^100 9 Total P, mg/L 10.2^1.3
[image:4.612.101.449.638.747.2]5 Alkalinity, mg/L as CaCO3 1,100^250 10 SO4, mg/L 68^28
Table 2Average MBR and AS operating parameters
Parameter MBR (lab scale) AS (full scale)
1 Flow rate, m3/day 30 6,100
2 Volume of basins, m3 24 8,500
3 HRT, hr 19 33
4 MLSS, gr/L 15 6
5 MLVSS, gr/L 8.7 4.1
6 DO in aeration basin, mg O2/L 3.0 2.5
7 F/M, kg BOD5/kg MLVSS * day 0.04 0.06
8 SOUR, mgO2/gr MLVSS * hr 5.7 6.1
9 SRT, days 24 31
M.
Lerner
et
al.
Figure 2 COD in influent and effluent of AS and MBR pilot
Figure 3 COD in effluent of AS and MBR pilot vs. Cumulative probability
BOD removal
0 2 4 6 8 10 12 14 16 18 20
1–30 31–60 61–90 91–120 121–150 151–180 181–210 Days
BOD ef
f, mg/L
–600 –400 –200 0 200 400 600 800
BOD in, mg/L
BOD eff- MBR BOD eff - AS BOD in
Figure 4 BOD in influent and effluent of AS and MBR pilot
Figure 5 TSS in effluent of AS and MBR vs. SRT
M.
Lerner
et
al.
[image:5.612.75.362.430.546.2] [image:5.612.71.351.583.729.2]inner layer disappeared. As a result, bacteria concentration in the MBR effluent decreased.
[image:6.612.131.415.127.249.2] [image:6.612.122.427.285.418.2]An additional problem in the MBR operation was a sharp decreasing of the flux, due to sudden membrane plugging. Two reasons could be clearly observed: (a) non uniform air distribution into the membrane tank caused the total blockage of the gap between the membranes by biosolids, leading to diminishing of the membrane flow capacity; (b) the flux reduction was caused by the formation of a CaCO3 film on the membrane surface. During the transferring of the mixed liquor from the aerobic tank to the membrane tank of the MBR, a lot of extra carbon dioxide was stripped off by the vigorous circulation and airflow that locally causes calcium deposits due to the changes in pH. In order to solve the calcification problem, approximately 50% of untreated wastewater was moved directly from the Anoxic tank to the Membrane tank of the MBR. This allowed a Figure 6 TSS in effluent of AS and MBR pilot vs. cumulative probability
Figure 7 TP in influent and effluent of AS and MBR pilot
NH4-N removal
0 1 2 3 4 5 6
1–30 31–60 61–90 91–120 121–150 151–180 181–210 days
NH
4
-N, mg/L
NH4-N eff- MBR NH4-N eff - AS NH4-N in
Figure 8 Ammonia nitrogen in influent and effluent of AS and MBR pilot
M.
Lerner
et
al.
[image:6.612.130.422.618.731.2]reduction in the calcium problem due to the stabilization of the CO2 equilibrium in the Membrane tank.
Conclusions
The comparison of AS and MBR as the second bio-treatment stage following the anaerobic treatment of paper mill wastewater revealed that the MBR could produce an effluent of much better quality in terms of suspended solids. The very low and uniform TSS concentration in the MBR effluent could exclude the necessity of filtration in order to reach more stringent wastewater discharge standards. The other basic parameters (i.e. COD, BOD, TP and NH4-N) did not show substantial differences between AS and MBR.
Membrane blockage because of scaling and biofouling may be very serious for the MBR system. Therefore, the MBR requires frequent and more complicated maintenance than the AS system, especially in the case of the paper mill, where calcium concen-trations in wastewater are relatively high.
Lerner et al. (2006) showed that application of the anaerobic pre-treatment signifi-cantly improved the performance of the aerobic AS system treating paper mill waste-water. Therefore, if there is no need for the excellent effluent in terms of TSS, the replacement of the AS by the MBR, as a second biotreatment stage, might not be required in the case of paper mill wastewater anaerobic – aerobic treatment.
References
Cicek, N. (2003). A review of membrane bioreactors and their potential application in the treatment of agricultural wastewater.Canadian Biosystems Engineering,45, 6.37 – 6.49.
Cicek, N., Franco, J.P., Suidan, M.T. and Urbain, V. (1998). Using a membrane bioreactor to reclaim wastewater.Journal American Water Works Association,90(11), 105 – 113.
Cicek, N., Dionysiou, D., Suidan, M.T., Ginestet, P. and Audic, J.M. (1999). Performance deterioration and structural changes of a ceramic membrane bioreactor due to inorganic abrasion.Journal of Membrane Science,163(1), 19 – 28.
Dufresne, R., Lavallee, H.C., Lebrun, R.E. and Lo, S.N. (1998). Comparison of performance between membrane bioreactor and activated sludge system for the treatment of pulping process wastewaters. TAPPI Journal,81(4), 131 – 135.
Galil, N., Sheindorf, C., Stahl, N., Tenenbaum, A. and Levinsky, Y. (2003). Membrane bioreactors for final treatment of wastewater.Wat. Sci. Tech.,48(8), 103 – 110.
Lerner, M., Stahl, N. and Galil, N. (accepted for publication, 2006). Aerobic vs. Anaerobic-Aerobic Biotreatment-Paper Mill Wastewater. Environmental Engineering Science.
Metcalf and Eddy (1991).Wastewater Engineering, Treatment, Disposal and Reuse, Third edn., McGraw-Hill Inc. Sarlin, T., Halttunen, S., Vuoriranta, P. and Puhakka, J. (1999). Effects of chemical spills on activated sludge
treatment performance in pulp and paper mills.Wat. Sci. Tech.,40(11 – 12), 319 – 325. Stahl, N., Tenenbaum, A. and Habets, L. (2004). Finding a better way.PPI,11, 29 – 32.
Standard Methods for the Examination of Water and Wastewater(1997). APHA/AWWA/WEF, Washington, DC, USA.
Webb, L. (2001). Effluent treatment heats up at mills.http://www.paperloop.com/db_area/archive/ppi_mag/
2001/0104/sludge.htm.
Webb, L. (2003). Water and Waste Trends.PPI,4, 33 – 36.
M.
Lerner
et
al.