SRef-ID: 1432-0576/ag/2005-23-1123 © European Geosciences Union 2005
Annales
Geophysicae
Study of equatorial Kelvin waves using the MST radar and
radiosonde observations
P. Kishore1, I. V. Subba Reddy2, S. P. Namboothiri1, K. Igarashi1, M. Venkat Ratnam3, D. Narayana Rao4, and S. Vijaya Bhaskara Rao2
1National Institute of Information and Communications Technology, Tokyo, Japan 2Department of Physics, Sri Venkateswara University, Tirupati 517 502, India
3Research Institute for Sustainable Humanosphere, Kyoto University, Uji, Kyoto 611-0011, Japan 4National MST Radar Facility, Department of Space, Gadanki 517 112, Tirupati, India
Received: 15 July 2004 – Revised: 17 February 2005 – Accepted: 24 February 2005 – Published: 3 June 2005
Abstract. In this paper an attempt has been made to study equatorial Kelvin waves using a high power coherent VHF radar located at Gadanki (13.5◦N, 79.2◦E), a tropical station in the Indian sub-continent. Simultaneous radiosonde obser-vations taken from a nearby meteorological station located in Chennai (13.04◦N, 80.17◦E) were also used to see the co-herence in the observed structures. These data sets were an-alyzed to study the mean winds and equatorial waves in the troposphere and lower stratosphere. Equatorial waves with different periodicities were identified. In the present study, particular attention has been given to the fast Kelvin wave (6.5-day) and slow Kelvin wave (16-day). Mean zonal wind structures were similar at both locations. The fast Kelvin wave amplitudes were somewhat similar in both observa-tions and the maximum amplitude is about 8 m/s. The phase profiles indicated a slow downward progression. The slow Kelvin wave (16-day) amplitudes shown by the radiosonde measurements are a little larger than the radar derived am-plitudes. The phase profiles showed downward phase pro-gression and it translates into a vertical wavelength of∼10– 12 km. The radar and radiosonde derived amplitudes of fast and slow Kelvin waves are larger at altitudes near the tropopause (15–17 km), where the mean wind attains west-ward maximum.
Keywords. Meteorology and atmospheric dynamics (Mid-dle atmosphere dynamics; Tropical meteorology; Waves and tides)
1 Introduction
Extensive studies of large-scale Kelvin waves and Rossby gravity waves in the middle atmosphere have been carried
Correspondence to: P. Kishore
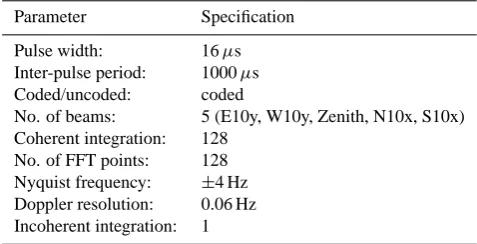
Pulse width: 16µs Inter-pulse period: 1000µs Coded/uncoded: coded
No. of beams: 5 (E10y, W10y, Zenith, N10x, S10x) Coherent integration: 128
No. of FFT points: 128 Nyquist frequency: ±4 Hz Doppler resolution: 0.06 Hz Incoherent integration: 1
The knowledge of Kelvin waves is very important as they strongly modulate the tropopause structure, including the tropopause height, minimum temperature, and atmospheric stability. Kelvin waves also contribute significantly to the middle atmospheric dynamics. In the present study, charac-teristics of Kelvin waves were studied using MST radar and radiosonde observations. The database and the methodology adopted are briefly discussed in Sect. 2. The amplitude and phase characteristics of different periodic components of the wind are discussed in Sect. 3, and finally, the overall sum-mary and conclusions drawn from the present study are pre-sented in Sect. 4.
2 Observations and data analysis
The Indian MST radar located at Gadanki (13.5◦N, 79.2◦E) is a high power VHF phased array radar operating at 53-MHz coherent backscatter mode with an average power aperture product of 7×10⁸Wm2. The phased antenna array consists of 1024 (32×32) crossed 3-element Yagi antennas occupy-ing an area of 130×130 m. The radiation pattern of the array provides a main beam with a 3◦two-way beam width and the first side lobe level of−20 dB. The radar beam can, in prin-ciple, be positioned at any look angle within±20◦, but it is currently programmed to position at five look angles, zenith, ±10◦off-zenith in the east-west and north-south directions. The complete time series of the decoded and integrated sig-nal samples are subjected to FFT for the on-line computation of the Doppler power spectra for each range bin. The off-line data processing involves the removal of the dc component, an estimation of the average noise level, incoherent integra-tion, the removal interference, if any, and the estimation of the three low-order moments. The three moments represent the signal strength, the weighted mean Doppler shift, and half-width parameters of the spectrum. For the estimation of noise level, the objective method developed by Hildebrand and Sekhon (1974) has been adopted here. To determine the wind components we have used the least-squares method as described by Sato (1989). Complete details of the system
utilized. These three months are generally considered as the typical monsoon season in India. The observations are daily evening common mode measurements for about∼50 min at around 17:00 IST. The various experimental specifications used by the radar for the present study are given in Table 1. Daily Doppler spectra corresponding to the five beams are obtained in the height range of 3.6–20 km at 150 m inter-vals. The observations were carried out coincidentally with the radiosonde observations at Chennai (13.04◦N, 80.17◦E), which is about 100 km away from the radar site. The height resolution of the radiosonde data varies from 200 m at lower heights to 300 m at higher altitudes. We have interpolated the radiosonde data to 150-m range resolution by applying the spline interpolation method. This makes both data sets with matching height resolution and hence the comparison is more meaningful.
Using the data (about one hour per day) we have con-structed the mean and we call it daily mean. We understand that it is not at all realistic to consider it as the real daily mean. However, for the sake of easiness we continue the usage of the word “daily mean”. The data were collected around the same time everyday and hence they collectively give a better picture of the wind pattern at that time slot. One deficiency of using this so-called daily mean is that we could not extract the real daily variations and their potential impact to the present investigation. This could be done in a future study in which we plan to investigate the planetary wave ac-tivities using the radar data alone.
As mentioned previously, the observations were conducted during the monsoon season. It is generally known that large-scale, low frequency forcings associated with the monsoons generate Rossby and Kelvin waves along the equator. How-ever, details of such effects are beyond the scope of the present study.
The daily mean winds were examined and it was found that there were small data gaps, which are filled with linear interpolation. The Lomb-Scargle (L-S) periodogram analysis method (Scargle, 1982) of spectral analysis is used for the determination of the fast Kelvin (6.5-day) and slow Kelvin (16-day) wave amplitude and phase. Scargle’s definition of the time-translation invariance of the periodogram is exactly equivalent to a least-squares fitting of the sine wave to data. Compared to the other methods, the L-S method weights the data per point, instead of per time interval. Also, the L-S periodogram can provide an estimate of the significance of each peak by examining the probability of its arising from a random fluctuation (Luo et al., 2002; Namboothiri et al., 2002).
[image:2.595.47.286.99.221.2]Fig. 1. Height-time contours of mean zonal winds at MST radar and radiosonde observation sites for the period of June−August, 1996. Bar diagrams shown below the contour plots indicate the data availability during this period. The profiles in the right panels depict the monthly mean values.
(window) of data (data length), multiplying the output by a filter function (bandwidth) and then doing an inverse FT to get back a filtered data set in the time domain. For the 6.5-day wave, high and low cut-off frequencies are selected as 0.2 and 0.125 cpd (cycles per day), which corresponds to 5 and 8 days and for the 16-day wave, the cut-off frequencies are 0.1 and 0.045 cpd, which corresponds to the 10 and 22 days, respectively.
3 Results and discussion
Before going into the details of the Kelvin waves observed, it is desirable to discuss the background features at the re-spective observational sites. Figure 1 shows the time-height sections of the zonal winds observed at the Indian MST radar site and the balloon wind measurement site at Chennai during the monsoon season of the year 1996. Daily mean values are utilized to develop these wind contours. On the right-hand side of the figure the vertical profiles of the monthly mean winds are also shown. Describing the radar results first, it can be seen that below about 7 km, winds are mostly eastward in direction and above that there is westward flow
through-out the season. The maximum eastward wind is observed to be about 10 m/s. The maximum westward wind is in the range of 40 m/s and its occurrence is at around 16 km (near the tropopause) in July. The balloon measurements shown in the lower panel depict some differences as well as similari-ties with the radar measurements. The maximum eastward wind has an average strength of 10 m/s and its occurrence is at around∼6 km. It can be seen that the wind pattern ob-served at both the sites are generally the same. The height occurrence of summer westward maxima is at around 16 km in both radar and balloon wind observations and also its time occurrence is in July. The height profiles in the right panel exhibit similar monthly mean wind values.
Fig. 2. The spectral amplitudes of the zonal wind in the interval 9
June−3 August 1996 measured at four different altitudes (5.4, 9.3, 13.2 and 17.1 km) at MST radar (left) and radiosonde (right) sites.
16-day peak is broad, extending over roughly 12 to 22 days. The 6.5- and 16-day spectral peaks become larger at higher altitudes than compared to the lower altitudes. This feature is evident in both measurements, except for the radar mea-surements of the 16-day wave at 17.1 km. By calculating the area between the 90% significance level and the calculated spectral amplitude, the centroid of the spectral peak was de-termined. At all four sampled heights and throughout the entire period the fast and slow Kelvin waves were present and they showed similar spectral structures. Further, there is an indication of variability with periodicities near 3.6 and 5 days. However, these ultra fast Kelvin waves are out of scope of the present study.
The zonal amplitude spectra of the 6.5-day wave activ-ity as a function of height and time, observed by the radar and balloon wind measurements, are shown in Fig. 3. The top panel corresponds to the radar and the bottom panel rep-resents the balloon measurements. The spectral amplitudes in the contour plots are calculated by a Lomb-Scargle pe-riodogram analysis within a set time window of 30 days in length. This window was shifted by a step of 5 days, and the power spectral amplitude and phase values are estimated.
Fig. 3. Amplitudes of the zonal component of the 6.5-day wave
ob-tained by Lomb-Scargle periodogram analysis during the monsoon season at the MST radar (top) and radiosonde (bottom) observation sites.
In the process, the confidence levels of the periodograms are estimated for only those spectral peaks with more than 90% significance. The 6.5-day wave amplitudes observed at both locations have some similarities as well as differences. Above 13 km the wave activity attains its maximum. In the case of radar data the wave amplitudes reach maximum val-ues during mid-July to mid-August. The wave amplitude at-tains 9–10 m/s at 15–17 km. In the balloon data, the max-imum amplitudes are observed in August. The peak ampli-tudes (10–12 m/s) are clearly identified at two height regions, one near 16–17 km and another at 19 km. In July the bal-loon derived amplitudes are weaker than the radar determi-nations. In both observations the amplitudes have a maxima near the tropopause level. Assuming that zonal wind oscilla-tions are due to Kelvin wave mode, these waves are eastward propagating equatorial waves. It has been shown that the Kelvin wave amplitudes have maximum whenever the west-ward flow becomes stronger. The above statement is valid for the present observation of the fast Kelvin wave. As seen in the figure, radar observations show maximum amplitudes at 13–18 km where the winds show the westward maximum (Fig. 1).
[image:4.595.48.285.64.411.2]profiles of the amplitude show some features more promi-nently than that seen in the contour plots (Fig. 3). In general, the amplitudes and phases observed by the radar and balloon closely resemble each other. Both the radar and balloon mea-surements show almost identical amplitudes in June. In July, below 15 km altitude the amplitudes of the radar and balloon measurements were similar, and in the 15–19 km range the radar amplitudes became larger than the balloon derived am-plitudes. Comparatively large fluctuations were seen in the amplitudes derived by radiosonde observations during Au-gust. The phase profiles indicated a fairly slow downward progression below 16 km in both measurements. The aver-age vertical wavelength in both stations is obtained as 10– 12 km. The values of the vertical wavelength are consistent with those reported earlier for the Indian MST radar location (Dhaka et al., 1995). Rocket and satellite observations had found significant ∼7-day wave activity in the stratosphere when the background winds were westward (Hirota, 1979; Hitchman and Leovy, 1986; Canziani and Holton, 1995). Us-ing numerical simulations Miyoshi (1999) found that the en-hancement of the 5-day wave in the mesopause region occurs simultaneously with that in the stratosphere.
[image:5.595.309.547.66.390.2]To illustrate the features of the 6.5-day oscillations at dif-ferent heights from 4 to 20 km, the zonal wind data set of length 20 days has been subjected to a band-pass filter of width 5–8 days. This band-pass is wide enough to isolate the phenomena over a broad period range centered at 6.5-days. The height averages (8 range bins, 1.2 km) of the winds are used as the input to the filter and the results are displayed in Fig. 5. Results of a similar analysis conducted for the balloon data are shown in the right panel of the figure. It is apparent that there is 6.5-day wave activity during most of the mon-soon season. At both stations the wave activity maximizes near tropopause level. The observed amplitudes at the bal-loon site are larger than the amplitudes at the radar site. The analysis conducted for the meridional component (figure not shown) indicate that the zonal amplitudes are larger than the meridional amplitudes. This is consistent with the other mea-surements at equatorial sites.
[image:5.595.309.545.447.662.2]Now we proceed to a similar analysis conducted for the 16-day oscillations. Figure 6 presents the zonal amplitudes of the 16-day waves in the troposphere and lower strato-sphere as observed by the radar and balloon wind measure-ments during the monsoon season of the year 1996. The am-plitudes are calculated by using sliding periodograms applied to a window width of 30 days. The window was shifted by a step of 3 days, and the power spectral amplitude and phase values are estimated. In general, strong 16-day wave activity occurs mostly in the higher altitudes in both measurements. In the case of radar, above 12 km the 16-day wave activity increases up to 18 km and above this level the wave activ-ity is found to recede throughout the season. The maximum amplitudes of about 8 m/s are observed near 15–17 km. In the balloon data the maximum amplitudes are observed in the month of July and August and it reaches a maximum of 10 m/s. Mostly the maximum amplitudes observed by the balloon measurements are slightly larger (2–3 m/s) than
Fig. 4. Monthly profiles of amplitude (top panel) and phase (bottom
panel) of the 6.5-day wave at MST radar and radiosonde observation sites during the monsoon season of 1996.
Fig. 5. Band-pass filtered (5-8 days) zonal winds for the near
Fig. 6. Contour plots for the amplitudes of the 16-day wave
ob-tained by Lomb-Scargle periodogram analysis during the monsoon season of 1996 at MST radar (top) and radiosonde (bottom) obser-vation sites.
those by the radar measurements. In July and August the occurrence of maximum amplitudes shows some difference between the two measurements and thus makes the wave ac-tivity out of phase at these locations. More analysis based on a wider database is required to consolidate the causes behind such variations between these two nearby stations. The bal-loon wind measurements at Trivandrum (8.5◦N, 77◦E) have observed 12–16-day period oscillations in the height range 16–24 km and they were considered as the manifestation of Kelvin waves (Dhaka et al., 1995), and the maximum am-plitude observed near 15–17 km was about 6 m/s. Maximum amplitudes observed in the present study are larger than the observations reported for Trivandrum.
[image:6.595.310.546.64.382.2]Figure 7 shows the height profiles (monthly mean) of the 16-day wave amplitudes and phases observed in the zonal component. Similar to the case of the 6.5-day wave, the am-plitudes and the corresponding phases are considered only when they are>90% significant. The wave occurrence was first identified and then the corresponding wave period was determined. Describing the monthly variations, amplitudes are generally∼7 m/s in all monsoon months at the 13–17 km height range. Comparing with the balloon measurements, below 17 km both amplitudes show good similarity in their structure. However, above 17 km the balloon amplitudes are larger than the radar derived amplitudes. In the phase pro-files shown in the bottom panel we can see some similarities
Fig. 7. Monthly profiles of amplitude (top panel) and phase (bottom
panel) of the 16-day wave at MST radar and radiosonde observation sites during the monsoon season of 1996.
between the two measurements. This suggests that both ob-servations involve the same wave events. The phase profiles show downward phase progression in the height regions 4– 17 km and above this level such a trend ceases. Tsuda et al. (1994a) observed waves with periods of 15–17 days in the troposphere and lower stratosphere. They found maxi-mum zonal amplitude up to 7 m/s and noted that the Kelvin wave was enhanced only in a narrow region with a thickness of about 5 km centered at the tropopause.
Table 2. Characteristics of equatorial waves.
Period (days) Type Height Max. amplitude Vertical wavelength
km range (m/s) (km)
radar balloon radar balloon
6.5 day Fast Kelvin wave 4–20 7–9 7–9 ∼12 ∼10 16 day Slow Kelvin wave 4–20 6–8 8–10 ∼11 ∼12
balloon measurements are larger in upper altitudes, when the equatorial easterlies are prevailing. The wave activity noticed in this study may have a close connection to the intensity of the equatorial westward wind. It may be further noticed that the wave activity is not well correlated between the sites. Ex-cept for the first three or four height bins in the lower tropo-sphere, the wave patterns show noticeable differences in their amplitude and period. A detailed look into such issues can be addressed only with a better data set. We should admit that the present database of 1h/day is only suitable for an overall investigation of the wave signatures at both locations.
The observed differences between the radar and ra-diosonde results can be attributed to some other factors. It is well known that under mountain wave activity, which can be highly localized, large discrepancies can occur at lower-stratospheric altitudes. Radiosondes can drift horizontally more than 100 km from their launch site by the time they reach an altitude of 15 km. Hence, the data are not neces-sarily representative of the atmosphere above the launch site. Some related discussion can be seen in the paper by Hooper et al. (2004).
Finally, Table 2 shows the comparative features of the wave characteristics of the fast Kelvin and slow Kelvin waves measured by the radar and radiosonde observations. It can be seen that the 6.5-day wave amplitude (maximum) measured by both measurements is same and the vertical wavelengths differ by a small amount. A roughly similar trend is observed in the case of the 16-day wave as well. Here the wave ampli-tudes show a maximum difference of 2 m/s between the two measurements.
4 Conclusions
The focus of the present analysis was the study of a fast Kelvin wave (6.5-day) and a slow Kelvin wave (16-day), observed in the troposphere and lower stratosphere over a tropical site using radar and balloon wind measurements. We have used the wind data collected simultaneously by the MST radar located at Gadanki and the radiosonde observa-tions at Chennai, a nearby station. In the present analysis data collected during the monsoon season (June-August) of 1996 have been sampled. Comparison of the radar and ra-diosonde winds agrees generally well in their pattern and strength. The 6.5-day wave amplitudes of radar and bal-loon profiles are somewhat similar and the maximum
am-Fig. 8. Band-pass filtered 16-day oscillations at different altitudes
at MST radar (left) and radiosonde (right) sites during the monsoon season of 1996.
plitude observed in each measurement is about 8 m/s. The amplitudes attain maximum values near the tropopause (15– 17 km) level in both the measurements. The phase profiles showed fairly downward progression and the estimated ver-tical wavelength is about 10–12 km.
It is further found that the slow Kelvin wave (16-day) in both measurements exhibits large amplitudes (7 m/s) near the tropopause level. The general structures observed by the radar and radiosonde observations are fairly similar. The radar and balloon derived zonal amplitudes are compara-tively larger in the upper altitudes, when the equatorial east-erlies are prevailing. The observed results show good quali-tative and partly quantiquali-tative agreement with earlier observa-tions on equatorial waves.
[image:7.595.312.542.188.400.2]the Council of Scientific and Industrial Research (CSIR), India. The authors wish to thank National MST Radar Facility (NMRF), Gadanki and UGC-SVU Centre for MST Radar Applications, Sri Venkateswara University, Tirupati, for providing the necessary data for the present study.
Topical Editor U.-P. Hoppe thanks C. Jacobi for his help in eval-uating this paper.
References
Canziani, P. O. and Holton, J. R.: Equatorial Kelvin wave variability during 1992 and 1993, J. Geophys. Res., 100D3, 5193–5202, 1995.
Dhaka, S. K., Krishna Murthy, B. V., Nagpal, O. P., Raghava Rao, R., Sasi, M. N., and Sundaresan, S.: A study of equatorial waves in the Indian zone, J. Atmos. Solar-Terr. Phys., 57, 1189–1202, 1995.
Fujiwara, M., Yamamoto, M. K., Hashiguchi, H., Horinouchi, T., and Fukao, S.: Turbulence at the tropopause due to breaking Kelvin waves observed by the Equatorial Atmosphere Radar, Geophys. Res. Lett., 304, 1171, doi:10.1029/2002GL016278, 2003.
Hildebrand, P. H. and Sekhon, R. S.: Objective determination of the noise level in the Doppler spectra, J. Appl. Meteorol., 13, 808– 811, 1974.
Hirota, I.: Equatorial waves in the upper stratosphere and meso-sphere in relation to the semiannual oscillation of the zonal wind, J. Atmos. Sci., 35, 714–722, 1978.
Hirota, I.: Kelvin waves in the equatorial middle atmosphere ob-served by the NIMBUS-5-SCR, J. Atmos. Sci., 36, 217–222, 1979.
Hitchman, M. H. and Leovy, C. B.: Evolution of the zonal mean state in the equatorial middle atmosphere during October 1978−May 1979, J. Atmos. Sci., 43, 3159–3176, 1986. Holton, J. R. and Lindzen, R. S.: An updated theory for the
quasi-biennial cycle of the tropical atmosphere, J. Atmos. Sci., 29, 1076–1080, 1972.
Hooper, D. A., Arvelius, J., and Stebel, K.: Retrieval of atmospheric static stability from MST radar return signal power, Ann. Geo-phys., 22, 3781–3788, 2004,
SRef-ID: 1432-0576/ag/2004-22-3781.
Kishore, P.: Atmospheric studies using Indian MST radar−Winds and Turbulence parameters, Ph. D. Thesis, S. V. University, Tiru-pati, India, 1995.
Lindzen, R. S. and Holton, J. R.: A Theory of the Quasi-Biennial Oscillation, J. Atmos. Sci., 25, 1095–1107, 1968.
Luo, Y., Manson, A. H., Meek, C. E., Thayaparan, T., MacDougall, J., and Hocking, W.: The 16-day wave in the mesosphere and lower thermosphere: simultaneous observations at Saskatoon (52◦N, 107◦W) and London (43◦N, 81◦W), Canada. J. Atmos. Solar-Terr. Phys., 64, 1287–1307, 2002.
Miyoshi, Y., Numerical simulation of the 5-day and 16-day waves in the mesopause region, Earth Planets Space, 51, 763–772, 1999. Namboothiri, S. P., Kishore, P., and Igarashi, K.: Climatological
studies of the quasi 16-day oscillations in the mesosphere and lower thermosphere at Yamagawa (31.2◦N, 130.6◦E), Japan, Ann. Geophys., 20, 1–8, 2002,
SRef-ID: 1432-0576/ag/2002-20-1.
Randel, W. J.: Kelvin wave-induced trace constituent oscillations in the equatorial mesosphere, J. Geophys. Res., 95, 18 641–18 652, 1990.
Rao, P. B., Jain, A. R., Kishore, P., Balamuralidhar, P., Damle, S. H., and Viswanathan, G.: Indian MST radar, 1, System description and sample vector wind measurements in ST mode, Radio Sci., 30, 1125–1138, 1995.
Salby, M. L., Hartmann, D. L., Baily, P. L., and Gille, J. C.: Evi-dence of equatorial Kelvin modes in Nimbus-7 LIMS, J. Atmos. Sci., 41, 220–235, 1984.
Salby, M. L., Callaghan, P., Solomon, S., and Garcia, R. R.: Chemi-cal fluctuations associated with vertiChemi-cally propagating equatorial Kelvin waves, J. Geophys. Res., 95, 20 491–20 505, 1990. Sato, T.: Radar Principles, Handbook for MAP, edited by S. Fukao,
Vol. 30, International School on Atmospheric Radar, 235–281, 1989.
Scargle, J. D.: Studies in astronomical time series analysis II, Sta-tistical aspects of spectral analysis of unevenly spaced data, As-trophys. Journal, 263, 835–853, 1982.
Tsuda, T., Murayama, Y., Wiryosumarto, H., Harijono, S. W. B., and Kato, S.: Radiosonde observations of equatorial atmosphere dynamics over Indonesia, 1, Equatorial waves and diurnal tides, J. Geophys. Res., 99, 10 491–10 506, 1994a.
Tsuda, T., Murayama, Y., Wiryosumarto, H., Harijono, S. W. B., and Kato, S.: Radiosonde observations of equatorial atmosphere dynamics over Indonesia, 2, Characteristics of gravity waves, J. Geophys. Res., 99, 10 507–10 516, 1994b.