W
OJCIECHJ
ANUSZB
ARANOWSKIUV−VIS Spectra of Intestinal Mucins
with Change in Solution Concentration and pH
Zmiany widm UV−VIS mucyn przewodu pokarmowego
w zależności od stężenia i wartości pH w roztworze
Professional College of Łódź Educational Corporation, Trace Elements Laboratory, Poland
Adv Clin Exp Med 2006, 15, 2, 253–258 ISSN 1230−025X
ORIGINAL PAPERS
Abstract
Background. The composition and physicochemical properties of mucus are interesting since they are able to influence digestion.
Objectives. Determining whether chemical properties of mucin change under the influence of change in their con− centrations and pH values in water solutions.
Material and Methods. Solution of mucin type II crude from porcine stomach (Sigma−Aldrich); in: water; 0.5 M KOH; 0.1 M HCl; diluted with: water; water or 0.5 KOH; water or 0.1 M HCl, respectively. The influence of dilu− tion and pH−value change on the chemical properties of mucin solutions were studied with the UV−VIS spec− trophotometry method.
Results. All solutions studied showed characteristic minimum wave absorption at 370 nm and maximum at 376 nm in the VIS spectrum. The mucin solution with 0.5 M KOH showed the band of maximum absorption centred at 238 nm in the UV spectrum. Dilution with water or lowering the pH value of the solution widened and shifted that band toward shorter waves and revealed additional absorption maxima. The mucin solution with 0.1 M HCl had a band with maximum wave absorption at 213 nm. Dilution of this solution with water caused the formation of addition− al band with a maximum at 202 nm. The changes in the course of the absorption curve produced by dilution are reversible – the curve returns to its original form after restoring the original mucin concentration of the solution.
Conclusions. The changes described result from structural transformations characteristic of mucin. Mucin con− centration and the pH value of the gastric environment determines its chemical activity. Gastric mucus turns into liquid during acidification and dilution, and becomes thick during alkalization and increase in its concentration. It seems that gastroprotection and the caustic properties of gastric juices arise from the known properties of gastric mucin and its peculiar location. The environment of the mucous membrane surface and the environment of the digestive tract lumen are separated by mucus. The mucous membrane surface is covered with mucus of high cohe− sion and chemical passiveness, which depends on continuous mucin excretion (high mucin concentration) and high HCO3–concentration. The mucus of the gastric lumen side is diluted and acidified, which turns it into a liquid that
can enter into chemical reactions with food (Adv Clin Med 2006, 15, 2, 253–258).
Key words: mucus, mucin, stomach, gastroprotection, UV−VIS spectra.
Streszczenie
Wprowadzenie. Skład i właściwości fizykochemiczne śluzu budzą zainteresowanie, ponieważ mogą mieć wpływ na przebieg trawienia.
Cel pracy. Ustalenie, czy właściwości chemiczne mucyn zmieniają się pod wpływem zmian ich stężenia i warto− ści pH w wodnych roztworach.
Materiał i metody. Roztwór mucin type II crude from porcine stomachfirmy Sigma−Aldrich w: wodzie; 0,5 M KOH; 0,1 M HCl rozcieńczano odpowiednio: wodą; wodą albo 0,5 KOH; wodą albo 0,1 M HCl. Metodą spektrofotometrii UV−VIS badano wpływ rozcieńczania i zmian wartości pH roztworów mucyn na ich właściwości chemiczne.
It is well known that the mucous membrane that is build out of the enterocytes forms the wall of the digestive tract. The mucous membrane is covered by a tight layer of mucus produced by enterocytes. Until recently it was assumed that the mucus covering the mucous membrane of the digestive tract plays only a protective role. Such a conception of the role of mucus is however too great a simplification, since the physicochemical properties of digestive−tract mucus change with the age of the enterocyte producing it, with its location and the micro−environment in the lumen of the digestive−tract. In recent years attention has been focussed on the part played by mucus in processes of nutrient absorption from the digestive tract [1–4]. The main ingredients of mucus are mucins which come into close contact with food particles and with them, form the chyme. This chyme, while moving along the digestive tract, is subjected to action of the environmental condi− tions of its various segments: changes occur in the pH values of this environment, as well as in the composition and concentration of mucus [1].
The purpose of the experiment described was to determine whether the absorption spectra of the mucin studied change under the influence of change in their concentration and pH value in aqueous solutions. To measure this, spectropho− tometry was chosen in the 200–500 nm wave− length range, because in that range are located the principle absorption bands of the majority of organic groups.
Material and Methods
The studies were performed on “mucin type II crude from porcine stomach” from the firm Sigma−Aldrich, and used demineralized water of 70 µS conduction, and HCl and KOH of analytic purity, produced by POCH in Gliwice, Poland.
The absorption spectra were registered by a Specord UV−VIS from Carl Zeiss (D – Jena), with use of quartz cuvette of 1 cm−layer thickness with respect to the reference material – water.
To test the influence of dilution on mucin absorption spectra, a starter solution of 50 mg mucin to 100 ml water was prepared. A series of four solu− tions was used in the study. The first 25 ml flask was filled with 0.8 ml starter solution and water to the full mark. The second flask was filled with 12.5 ml of the solution from the first flask, and water to the full mark. The third flask was filled with 12.5 ml of the solution from the second flask and water to the full mark. In contrast, into the forth flask was poured c. 10 ml of the solution from the third flask, 0.6 ml of the starter solution, and solution from the third flask to the full mark. Thus the series contained in the respective flasks 0.016; 0.008; 0.004 and 0.016 mg mucin in 1 ml of solution. Then the absorption spec− tra of the specific solutions, with respect to water, were registered (see Fig. 1).
With the purpose of testing the influence of dilution and pH of the mucin solutions on the absorption spectra on the basis of the starter solu− tion, in measuring flasks of 25 ml capacity were
202 nm. Przywrócenie pierwotnego stężenia mucyn w roztworze powoduje wycofanie się wywołanych rozcieńcza− niem zmian w przebiegu krzywej absorpcji.
Wnioski. Opisane zmiany widma UV−VIS wynikają z przekształceń strukturalnych mucyn. Aktywność chemicz− na żołądkowych mucyn zależy od ich stężenia i wartości pH w środowisku. Zakwaszanie i rozcieńczanie upłynnia śluz żołądkowy, a alkalizacja i zatężanie powoduje jego gęstnienie. Odkryte właściwości żołądkowego śluzu i je− go charakterystyczne umiejscowienie odpowiada za gastroprotekcję i trawiące właściwości soku żołądkowego. Śluz rozgranicza środowisko powierzchni błony śluzowej i światła przewodu pokarmowego. Spoistość i chemicz− na bierność śluzu na powierzchni błony śluzowej wynika z dużego stężenia mucyn, które są nieustannie wytwa− rzane i wydzielane na jej powierzchnię oraz ze stopnia wysycenia śluzu jonami HCO3–. Po stronie światła żołądka
śluz jest rozcieńczany i zakwaszany, co upłynnia go i umożliwia wchodzenie w reakcje chemiczne z pokarmem (Adv Clin Med 2006, 15, 2, 253–258).
Słowa kluczowe: śluz, mucyny, żołądek, gastroprotekcja, widma absorpcyjne.
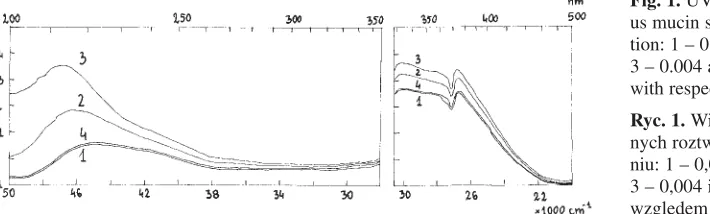
Fig. 1. UV−VIS spectra of aqueo− us mucin solutions of concentra− tion: 1 – 0.016; 2 – 0.008; 3 – 0.004 and 4 – 0.016 mg/ml with respect to water
prepared four series of solutions. Into the first flask of each series was measured out 1 ml starter solu− tion; then two of the flasks were filled up to the full−mark with 0.5 M KOH solution, and the other two with 0.1 M HCl solution to the full−mark. The mucin concentration in these flasks was 0.02 mg in 1 ml of solution. Then these solutions were diluted three times in the proportion 1:1. One of the alka− line mucin solutions was diluted with water, and the second, with 0.5 M KOH. With the mucin solu− tions in acid the procedure was analogous, but in this case the solvent was water and 0.1 M HCl. The absorption spectra of the different solutions with respect to water are presented in Figure 2–5.
Results and Discussion
The mucins studied are hardly soluble in water because, as large molecular compounds – com−
pound proteins, its solutions are colloidal of great turbidity [4]. In previous studies it was seen that at concentrations lower than 500 mg of mucin in 100 ml, registration of absorption spectra is possi− ble in the UV−VIS range [4]. The curve of radia− tion absorption changes markedly with each change in mucin concentration in solution, as also with each change in solution pH, as illustrated in Figure 1–5. The changes observed result from the intrusion in the internal structure of the mucin – with the chemical transformation new chro− mophore groups appear which absorb light of another wavelength. Chromophore groups are opti− cally active functional groups (binding sites) which occur in the mucin molecules. The observations described are the confirmation of conclusions drawn from earlier theoretical considerations [1]. Because of the dependencies described and obser− vations carried out, application of the Lambert− Beer law to mucin solutions is not indicated.
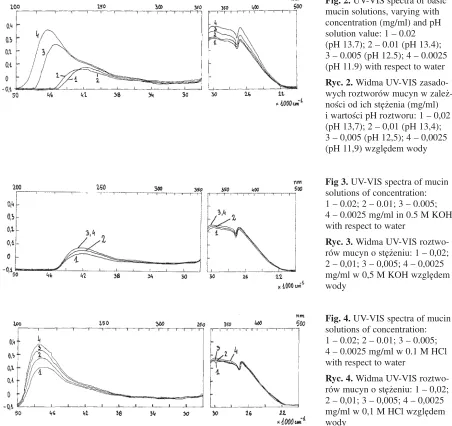
Fig. 2. UV−VIS spectra of basic mucin solutions, varying with concentration (mg/ml) and pH solution value: 1 – 0.02 (pH 13.7); 2 – 0.01 (pH 13.4); 3 – 0.005 (pH 12.5); 4 – 0.0025 (pH 11.9) with respect to water
Ryc. 2. Widma UV−VIS zasado− wych roztworów mucyn w zależ− ności od ich stężenia (mg/ml) i wartości pH roztworu: 1 – 0,02 (pH 13,7); 2 – 0,01 (pH 13,4); 3 – 0,005 (pH 12,5); 4 – 0,0025 (pH 11,9) względem wody
Fig 3. UV−VIS spectra of mucin solutions of concentration: 1 – 0.02; 2 – 0.01; 3 – 0.005; 4 – 0.0025 mg/ml in 0.5 M KOH with respect to water
Ryc. 3. Widma UV−VIS roztwo− rów mucyn o stężeniu: 1 – 0,02; 2 – 0,01; 3 – 0,005; 4 – 0,0025 mg/ml w 0,5 M KOH względem wody
Fig. 4. UV−VIS spectra of mucin solutions of concentration: 1 – 0.02; 2 – 0.01; 3 – 0.005; 4 – 0.0025 mg/ml w 0.1 M HCl with respect to water
On the basis of Figure 1 it can be maintained that, with a reduction in mucin concentration, the wide band of maximum wave absorption lying above 220 nm shifts in the direction of shorter waves, with a simultaneous increase in absorption and a pronounced bending point at c. 230 nm wavelength. The change in the curve under the influence of dilution of the mucin solution could indicate their hydrolysis, i.e. the fragmentation of the macromolecule. The increase in mucin con− centration in the solution causes the reversal of the changes observed and the return of the curve to its original course. This phenomenon should be explainable by the reversibility of processes occur− ring in the solution. The disappearance of the short−wave band indicates that they originate from chromophore groups occurring in the mucin mole− cule, and not in the products of its continuous degradation. In given conditions of the mucin solution concentration these groups become chem− ically active and can react with other substances. The dependency discovered has far−reaching sig− nificance, since it explains the physiological mechanism of gastroprotection.
From Figure 2 results that in a basic environ− ment a pronounced band of 238 nm max. wave absorption occurs which together with an increase in dilution with water and, decrease in solution pH, shifts in the direction of shorter waves. On these curves clearly forms a bending point at c. 230 nm wavelength, also seen in Figure 1. Certain of the absorption curves registered cut through each other in a way typical of isosbestic points, which indicates the co−existence of various spatial forms of mucin.
In aqueous KOH solution and with an insignif− icant increase in pH, small absorption increases are observed without a visible shift of the max.
wave absorption at 238 nm, as seen in Figure 3. This fact indicates that in spite of significant low− ering of mucin concentration, in the solution is present a constant concentration of certain chro− mophore groups displaying wave absorption at 238 nm. This phenomenon indicates the weak chemical reactivity of stomach mucus in condi− tions of increased pH. It seems that precisely this chemical property of stomach mucus promotes incipient infection with Helicobacter pylori. It is well known that this bacteria lives in stomach mucus. The ammonia produced by it prevents hydrolysis of stomach−mucus mucin, which pro− tects it from the destructive action of digestive juices and makes invasion possible. Regardless of the above remark it seems that stomach−mucus mucins (glycoproteins) are nutritious for
Helicobacter pylori, and ammonia is the main product of the metabolism of the protein portion of mucin in the metabolic processes of that microor− ganism: ever more frequent are current reports of the nutritious effect on Helicobacter pyloriof sub− stances freed by the stomach epithelium [5].
In Figure 4 is seen the band of max. wave absorption at 213 nm, which, with the increase in dilution, shifts insignificantly in the direction of shorter waves. Besides that, formation of a bend− ing point at c. 230 nm wavelength is noticeable, similarly as in Figure 1 and 2. The existence of this point indicates the occurrence in the acidic solu− tions of optically active chromophore groups, which also occur in the alkaline solutions.
Figure 5 presents very interesting changes in the course of the UV−VIS radiation absorption curve for solutions of various mucin concentra− tions in aqueous HCl solutions. With dilution in water, the broad absorption band in the region of 210–250 nm waves widens visibly in the direction
Fig. 5. UV−VIS spectra of acid mucin solutions, varying with concentration (mg/ml) and pH solution value: 1 – 0.02 (pH 1.0); 2 – 0.01 (pH 1.3); 3 – 0.005 (pH 1.6); 4 – 0.0025 (pH 1.9) with respect to water
of shorter waves, and becomes divided. At the first dilution occurs one band of max. wave absorption at 220 nm, which is only insignificantly shifted towards shorter waves with respect to the absorp− tion of the initial test. With subsequent dilutions one more band forms with max. wave absorption at 202 nm. On all the curves are observed also a bending point at a wavelength of c. 230 nm. Additional absorption bands appearing with pro− gressive solution dilution point to the emergence of still other chromophore mucin groups.
From a comparison of the absorption curve in Figure 1 and 2 results that dilution with water of aqueous mucin solutions leads to a reduction in pH value in those solutions. This effect is similar to the effect appearing during hydrolysis of weakly basic salts with strong acid.
Surprising are however the changes in the spectrum as seen in Figure 5 – dilution of the solu− tion leads to an increase in pH, and in spite of that appear new, short−wave absorption bands. The appearance of new absorption bands points to structural transformations of mucins (including change of conformation) and activation of various functional mucin groups. The mucins studied are stomach mucins, and for that reason it should be assumed that this phenomenon has far−reaching physiological significance in the digestive and nutrient absorption processes, the exact progres− sion of which is still unknown.
It is worth noting that in the wavelength region of 350–460 nm, on all curves appear a min. wave absorption at 370 nm and a max. wave absorption at 376 nm. The form of this section of the absorp− tion curve seems to be characteristic for the mucins studied. The absorption minimum and maximum mentioned is however weakly sensitive to change in concentration of mucin and pH of the solution.
Changes in the course of the absorption curve in the UV−VIS range shows that the mucins stud− ied, influenced by changes in their concentration and pH in aqueous solution, change their chemical properties. In the introduction it was mentioned that intestinal tract mucus has been treated until now as a passive participant in the digestive process, and the reason for its production is only the protection of the intestinal epithelium. The results obtained contradict this assumption, for the stomach−mucus mucins studied change their physicochemical properties under the sole influ− ence of dilution with water. The chemical activity of stomach mucins changes with change in pH of the environment. In a basic environment the mucins studied bind with one another, which makes them inactive with respect to elements composing the chyme. In contrast in an acidic
environment these mucins have many active func− tional groups which can react with foods. For this view speak research results on zymogen of pepsin. It was shown that pepsynogen is a glicoprotein which is stable in a basic or neutral environment, but in an acidic one, is subject to transformation into pepsin, the most important digestive enzyme secreted by the stomach [6–8].
Change in the structure of mucins, expressed in changes in activity of their functional groups, brings changes in their rheological properties, which changes also the rheological properties of the mucus. From the experiments conducted results that acidification and dilution liquefies mucus, while alkalization and concentration cause its thickening. Other authors who have studied duodenum mucus have made similar observations. The only difference is that changes in rheological properties of duodenum mucus, under influence of changes in pH value, occur in the opposite direc− tion [9]. With regard to the above it can be assumed that composition and physicochemical properties of mucus in each segment of the diges− tive tract are different. This observation is con− firmed by earlier reports of biochemical studies [10–13].
secretion of hydrochloric acid the mucous mem− brane of the stomach secretes considerable amounts of HCO–3ions, which saturate the mucus
covering it. This hydrocarbon−saturated mucus in their opinion is supposed to protect the mucous membrane from acidic digestive juices [15]. This phenomenon is called gastroprotection.
The changes in mucin properties observed during the experiment, and also described by other authors – the binding of mucins between them− selves, or dissolution of the bonds between them under influence of change in pH and their concen− tration in solution – has considerable significance
for the activity of the mucus barrier in the diges− tive tract. In light of the research results presented, the obvious consequence of a lack of gastroprotec− tion and excessive acidification of the stomach contents, leading to hydrolysis of mucin, is the liq− uefaction of the entire stomach mucus. The prod− ucts of the hydrolysis of mucin are, among others, digestive enzymes, which has been proved for pepsygen, which transforms itself into pepsyn [6–8]. These enzymes damage the stomach’s mucous membrane which can cause bleeding into the digestive tract lumen.
References
[1] Baranowski WJ:Rola śluzu jelitowego we wchłanianiu żelaza. Gastroenterol Pol 1999, 6, 63–65.
[2] Conrad ME, Umbreit JN, Moore EG:A role for mucin in the absorption of inorganic iron and other metal cations. Gastroenterology 1991, 100, 129–136.
[3] Quarterman J:Metal absorption and the intestinal mucus layer. Digestion 1987, 37, 1–9.
[4] Baranowski WJ:Stomach mucins bind iron ions. Mengen− und Spurenelemente 2004, 22, 747–752.
[5] van Amsterdam K, van der Ende A:Nutrients released by gastric epithelial cells enhance Helicobacter pylori
growth. Helicobacter 2004, 9, 614–621.
[6] Tanaka T, Yada RY:N−terminal portion acts as an initiator of the inactivation of pepsin at neutral pH. Protein Eng 2001, 14, 669–674.
[7] Kageyama T: Pepsinogens, progastricsins and prochymosins: structure, function, evolution and development. Cell Mol Life Sci 2002, 59, 288–306.
[8] Baudys M, Kostka V:Covalent structure of chicken pepsinogen. Eur J Biochem 1983, 136, 89–99.
[9] Kaunitz JD, Akiba Y:Acid−sensing protective mechanism of duodenum. J Physiol Pharmacol 2003, 54, Suppl. 4, 19–26.
[10] Nordman H, Davies JR, Herrmann A, Karlsson NG, Hansson GC, Carlstedt I:Mucus glycoproteins from pig gastric mucosa: identification of different mucin populations from the surface epithelium. Biochem J 1997, 326, 903–910.
[11] Ohara S, Ishihara K, Hotta K:Comparative study on mucus glicoproteins in rat stomach and duodenum. Comp Biochem Physiol [B] 1986, 83, 273–275.
[12] Spee−Brand R, Strous GJ, Kramer MF:Isolation and partial characterisation of rat gastric mucous glycopro− tein. Biochim Biophys Acta 1980, 621, 104–116.
[13] Stauffer A, Lallemand A, Gaillard D: Mucin histochemistry of the digestive tract in the human fetus. Gastroenterol Clin Biol 1990, 14, 561–566.
[14] Atuma C, Strugala V, Allen A, Holm L:The adherent gastrointestinal mucus gel layer: thickness and physical state in vivo. Am J Physiol Gastrointest Liver Physiol 2001, 280, G922–G929.
[15] Synnerstad I, Johansson M, Nylander O, Holm L:Intraluminal acid and gastric mucosal integrity: the impor− tance of blood−borne bicarbonate. Am J Physiol Gastrointest Liver Physiol 2001, 280, G121–G129.
Address for correspondence:
Wojciech Janusz Baranowski
Laboratorium Analiz Śladowych Pierwiastków Wyższej Szkoły Zawodowej ŁKO Prusa 6, m. 12
91−315 Łódź tel. 0502 063 567
e−mail: [email protected]
Conflict of interest: None declared
Received: 7.04.2005 Revised: 21.06.2005 Accepted: 19.07.2005
Praca wpłynęła do Redakcji: 7.04.2005 r. Po recenzji: 21.06.2005 r.