Turkish Journal of Fisheries and Aquatic Sciences 14: 299-308 (2014)
www.trjfas.org ISSN 1303-2712 DOI: 10.4194/1303-2712-v14_2_01
© Published by Central Fisheries Research Institute (CFRI) Trabzon, Turkey in cooperation with Japan International Cooperation Agency (JICA), Japan
Effect of Diet Regimes on Growth, Trypsin Activity and RNA: DNA Ratio
in
Fenneropenaeus indicus
Postlarvae
Introduction
In shrimp hatcheries, production of high quality postlarvae (PL) needs rearing them under constant, close to optimal conditions with required quantity of nutritionally-sufficient food. Poor nutritional condition of PL from hatchery can directly lead to high mortality in ponds as transferring of larvae from hatchery to unfamiliar environment might cause psychological and physiological effects (Olla et al., 1994). The stress factors may lead to reduced ability to feed (starvation) or to prolonged stage duration and to predation and make them more susceptible to disease. Thus, production of affordable, high-quality and viable PL is a critical issue for sustainable shrimp farming.
One of the major factors influencing PL quality in hatcheries is nutritional stress, other being thermal and osmotic. The live feed Artemia is mostly used to feed PL in combination with commercial feeds. Unreliable supply, nutritional quality (demanding enrichment thus raising cost) and exorbitant price of Artemia cysts have forced hatcheries stop feeding Artemia especiallyafter PL 10 stage (ten day old PL) and shift to higher dosage of
artificial diet. However, this practice in hatcheries has resulted in limited success and has been reported due to the requirement for exogenous enzymes supplied by live feeds, supporting digestion and growth (Jones
et al., 1993). So, a cheap alternative diet which can supply above nutrients and boost growth in PL stage
is an urgent need (Khatoon et al., 2013).
The soft tissues of food organisms like squid, mussel and fish have been recommended as suitable protein and enzyme sources for shrimp and as growth promoters (Deshimaru et al., 1985). In this study, mix of natural diets were assessed as an ingredient in two diet combinations for the nursery rearing of
Fenneropenaeus indicus PL and the performance was compared with two normally practiced diet regimes. As previous study by author has proven that total replacement of Artemia with natural diets from PL 10 stage onwards did not affect the growth and survival significantly (Regunathan, 2004), no effort was made to compare performance between natural diets and
Artemia.
Present study also involved evaluating three diet combinations for effect on trypsin activity. Study of digestive enzymes is an essential step towards a better knowledge of nutritional needs (Anand et al., 2013). Synthesis of digestive enzymes in crustaceans fluctuates in response to several factors and conditions, which include food, protein origin and quality. The interrelationships between the data derived from these analytical techniques and growth
C. Regunathan
1,*,
M.R. Kitto
21
Al Murjan Marine Resources Co., Mukalla, Republic of Yemen.
2
King Abdul Aziz University, Faculty of Marine Sciences, Jeddah, Saudi Arabia.
* Corresponding Author: Tel.: +966.501 945858; Fax: +966.501 945858; E-mail: [email protected]
Received 18 May 2013 Accepted 1 April 2014
Abstract
In an effort to evaluate the usage of natural diets in nursery feeding of Fenneropenaeus indicus (H. Milne Edwards) postlarvae, different feeding regimes that included commercial diet, natural diets and microalgae were tried out. After 10 days feeding, growth rate, survival, protein content, muscle RNA and RNA: DNA ratio of postlarvae fed mixed diet were significantly higher (P<0.05). Artificial diet alone fed postlarvae registered lowest values and were significantly poorer than rest of the treatments (P<0.05). No significant difference among treatments could be detected in trypsin activity (P=0.388). Correlation analysis confirmed significant relationship between growth rate and RNA: DNA ratio of postlarvae (r=0.90, P<0.001). Two weeks long pond experiment exhibited strong relationship between RNA: DNA ratio of postlarvae prior to stocking and post-stocking survival (r=0.78, P<0.001). Results from study confirm that supplementation of natural diets in artificial diet regime with or without inclusion of microalgae will enhance growth. But, presence of microalgae further improved the results by offering nutrition and stability. Pond experiments suggest possible use of RNA: DNA ratio as ‘survival probability indicator’ in commercial shrimp culture
may assist in defining the overall diet quality for both younger and older crustaceans (Lee and Lawrence, 1985). In protein digestion, trypsin is active in nutrient assimilation throughout the shrimp life cycle (Cara et al., 2004).
Second part of the experiment was conducted to find out possible relationship between RNA: DNA ratio (a conditional index) of PL20 and their post-stocking survival in the pond 2 weeks after post-stocking. RNA: DNA ratios are indicators of relative synthesis activity of growth-linked cells. This condition index has been used an indicator of nutritional status, feed quality, short-term growth and optimal culture conditions in fishes and crustaceans (Moss 1994a, 1994b; Kerambrun et al., 2012).
Present study aimed at evaluating usage of natural diets in nursery feeding regime of shrimp PL, in combination with conventional artificial diets. The best diet combination was evaluated based on growth rate, survival, protein content, muscle RNA and RNA: DNA ratio of postlarvae. It is expected that such diet combinations would help in reducing feed cost and enhance larval performance both in nursery and post-nursery (growout) stages.
Materials and Methods
Nursery Experiments
These experiments were carried out in the R&D facility of Al Murjan Marine Resources Co. Ltd., Mukalla, Republic of Yemen. Outdoor tanks with 5 m3 capacity with moveable transparent roof top to control light incidence were used for these experiments. Nine-day-old F. indicus PL (PL 9) from company’s commercial hatchery were transferred to outdoor tanks and stocked at a density of 20 litre-1 (i.e.100,000 tank-1). The experiment was started after 48 hours of acclimation to tank conditions i.e. at PL11 stage.
Four different diet regimes tested included (1) commercial postlarval feed (C), (2) mixture of commercial feed and microalgae (CM), (3) commercial diet and natural diets combination (CN) and (4) mix of commercial feed, microalgae, and natural feeds (CMN). The commercial feed Higashimaru No: 3. (Higashimaru feeds India Ltd, Cochin, India), had a minimum crude protein content of 48%, lipid 8%, carbohydrate 20% and premixes of vitamins and minerals. The natural feeds consisted of squid, sardine fish and mussel. Microalgae were supplied from indoor semi-continuous algae culture facility of company’s shrimp hatchery. The microalgae mix included Chaetoceros muelleri
Lemmermann (CS-176) and Tetraselmis suecica
(Kylin) Butcher(CS-187), both sourced from CSIRO Microalgae culture collection, TAS, Australia).
The batch starter cultures were maintained axenically in F/2 medium (Guillard and Ryther, 1962), microalgae culture for experiment were grown
semi-continuously in 500 L capacity photobioreactors (Solar Components Corp., USA). Growth medium for tubular reactors composed of commercial urea (46% prilled N2), sodium orthophosphate (Na2H2PO4), EDTA, Mineral and Vitamin mix. Above ingredients were added at a rate of 1.5 g, 2.0 g, 0.5 g, 1 g, 50 ml and 50 ml for 100 L of culture volume respectively. Composition of mineral and vitamin mixture were as per F/2 medium. About 30% of culture volume from the reactor was harvested every day and diluted with fresh seawater. And nutrients are added for the total volume. Cultures were maintained at salinity of 35 g L-1 and temperature of 26±1°C under 24 h light regime at a photoflux of 200 μmol photons m−1 s−1 provided by a bank of cool white fluorescent tubes. Throughout the experimental period, algal concentration in cultures was checked thrice a day using improved Neubauer hemocytometer.
In nursery tanks, from the third day after PL stocking, water was exchanged twice a day (morning and evening) accounting to 80% of total volume, using natural seawater filtered down to 5 µ level. The daily feeding quantity for commercial feed ranged from 60 to 150 g day-1 (depending on age) for every 100,000 PL divided in to six equal rations. The total algal density in nursery tanks was maintained at 40,000 cells ml-1 with C. muelleri and T. suecica at a ratio of 3:1 respectively. The natural diets were washed thoroughly in UV-sterilized water, processed and cut into small pieces and equal quantities of all three were squeezed through 500 micron mesh, diluted with water and evenly distributed in tanks. Natural diets were fed only during day time (four times a day) and were supplemented at a rate equivalent to 20% of commercial diet fed in a day (on dry weight basis).
Each diet treatment had twenty replicates. Before start up and at the end of experiments, thirty PL from each replicate were individually weighed by adding to a pre-weighed beaker with water in a digital balance (0.001 mg accuracy). Growth rate week-1 was calculated using the following formula:
Growth week-1 = (Final weight – Initial weight / Rearing period in days) x 7
Due to facility limitation as well as to obtain more replicates per treatment, these experiments had to be run twice consecutively under similar conditions. Each experiment was carried out for a period of 10 days (PL age 11 to 20).
Dry Weight and Protein Content
dried samples were ground and assayed for nitrogen content in a Carlo Erba 1106 automated CNS elemental analyzer (Carlo Erba Instruments, Milan, Italy) with acetanilide as standard. Protein was estimated by multiplying nitrogen content by 5.25 (Jobling, 1983). Samples were analysed in triplicate.
Enzymatic Analysis
For enzyme assays, each day of experiment thirty numbers of PL 20 were collected 2 h after feeding from each replicate of a treatment. All selected PLs had digestive tract full so as to guarantee maximum digestive enzyme activity. The PLs were washed with distilled water and immediately frozen at -80°C until analysis. For analysis, two separate frozen samples from each replicate were weighed, homogenized with 1500 μl ice-cold Tris-HCl buffer (46 mM Tris, pH 8.1 containing 11.5 mM CaCl2 at 25°C). Homogenates were centrifuged at 13,000 rpm for 6 minutes (Ribeiro and Jones, 2000). The removed supernatants at 25°C were immediately used for enzyme analysis.
Assay of Trypsin Activity
The trypsin activity in crude homogenates was assayed using 1mM Nά-p-toluenesulphonyl-L-arginine methyl ester (TAME) as substrate. Samples of 300 µl enzyme extract were mixed with 1.2 ml of TAME in the same Tris-HCl buffer (Hummel 1959) used during homogenisation. Specific trypsin activity was expressed as tissue activity (IU mg-1 protein). Enzyme activity was recorded as change in absorbance at 247 nm in a spectrophotometer for 3 min (Rick, 1984). A unit of trypsin activity is the amount of enzyme required to cleave 1 µmol TAME min-1 under the assay conditions. Each sample was assayed in duplicate.
RNA, DNA Assay
At the end of nursery experiment, 40 numbers of PL from each replicate of all four treatments were blotted dry and weighed. Abdominal muscle tissue was excised and stored immediately at -80°C until nucleic acid analysis. Total RNA and DNA were extracted in two separate samples of a replicate using the procedure of Schmidt and Thannhauser (1945) as modified by Munro and Fleck (1969) and quantified using the dual wavelength method (Munro and Fleck, 1969; Ashford and Pain, 1986). Care was taken to confirm the absence of RNase and DNase in the reagents and containers used. Type III RNA from Baker’s yeast (Sigma, St. Louis, MO, USA, R-7125) and DNA from Calf thymus (Sigma D-3664) were used as standards. RNA and DNA concentrations were expressed as µg nucleic acid per 100 mg wet weight.
Grow-out Experiments
Forty numbers of PL21 from each replicate were transferred to individual 1 m2 (i.e. 40 sq.m-1 density) pens made of 750 micron polypropylene mesh, inside the HDPE-lined shrimp pond (0.25 ha). The bottom of pens had 8 cm of sand substratum and escape of shrimp was prevented by inserting pen fence into the substratum. No food was offered during the initial two days of experimental period and after they were fed 20% body weight per day using a starter diet (CP Aqua, Thailand). The pens were monitored twice daily for mortality and dead ones removed. The experiment was terminated on the 14th day and final survival was determined. Temperature and dissolved oxygen (DO) concentration were measured using handy oxygen meter (YSI model 550A, YSI Inc., Yellow Springs, OH, USA) and salinity was determined using a refractometer (ATC-S / Mill-E, ATAGO Co. Ltd., Tokyo, Japan).
Statistical Analysis
Except where indicated, results are presented as mean±S.E. Normality of data was tested using Lilliefors' test and homoscedasticity using Bartlett's test. Where required, transformation of data was carried out. The statistical significance of the differences between treatments was determined using one way analysis of variance (ANOVA). When significance was noticed between treatments, comparison of means was conducted using Tukey’s honestly significant difference test. Simple linear regression equation was fitted using least-squares method. Pearson’s correlation coefficient (r) was estimated to know the strength of relationship between variables. Percentage values were arcsine transformed before analysis. All analyses were carried out using SYSTAT 13 statistical software (Systat Inc., USA) and differences were considered significant at P<0.05.
Results
Throughout nursery feeding experimental period, estimated water quality variables were within accepted limits specified for commercial conditions. In nursery tanks, temperature ranged from 27.8 to 29.6°C, dissolved oxygen (DO) was always above 6.2 mg L-1 and salinity 35 ppt. In the pond, temperature and salinity values ranged between 26.8 to 30.3°C, 35 to 37 ppt. respectively, and oxygen always above 5.6 mg L-1.
Morphometric Changes
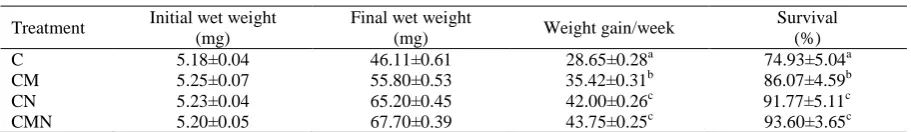
and survival than those fed other diets. The best results were recorded with PLs fed mix of all three diets (CMN). Results indicated that addition of natural diets in C or in CM treatments enhanced weight gain and survival (P<0.05). Although, addition of microalgae to C regime improved survival and growth (P<0.05), its inclusion in CN regime tanks did not show much effect (P=0.141).
Protein Content
Protein content (mg g-1 dry wt) of PL20 was much influenced by diets (P<0.001). With all treatments, PL protein content increased with larval stage, attaining the maximum at PL20 stage (Figure 1). At the end of experiment, PLs fed commercial diet alone (C) had the lowest protein content (697±3.98 mg g-1 dry wt) and was significantly (P<0.05) lower than all the other treatments. Highest protein content (732±3.93 mg g-1 dry wt) was registered with larvae fed mixture of all three diets (CMN) followed by CN (720±2.92 mg g-1 dry wt) and CM regime (712±3.16 mg g-1 dry wt). Tukey’s test with PL20 protein content confirmed that all diet comparisons exhibited statistical significance (P<0.05), except between CN and CM treatments (P=0.582).
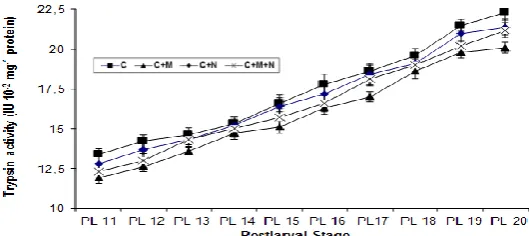
Trypsin Activity
Irrespective of the diet fed, trypsin activity (IU mg-1 protein-1) increased in all treatments with age (Figure 2). Throughout the experiment, highest trypsin activity was noticed with PLs fed commercial diet (C) followed by PLs from CN regime and lowest in CM. Interestingly, two treatments that included microalgae (CMN and CM) recorded lowest enzyme activity response. However, ANOVA failed to show any significant difference in enzyme activity between the four treatments (P=0.388).
Correlation matrix (Table 2) showed that the growth rate was related to survival (r=0.643), protein content (r=0.413) and trypsin activity (r=0.214). While protein content registered positive relationship with survival (r=0.638), it was negative with trypsin activity (r=-0.149).
Biochemical Changes
Mean RNA concentration of PL20 ranged from
307.84 µg 100 mg wt-1 with PLs from C regime to 396.62 µg 100 mg wt-1 with those from CMN regime (Figure 3). RNA content of shrimp from C regime was significantly poorer than rest of the treatments (P<0.05). Noticeably, addition of natural feeds or microalgae to commercial diet regime (C) improved the RNA content significantly (P<0.05). However, addition of microalgae to CN regime did not alter RNA concentration (i.e. in CMN, P=0.142).
Mean DNA concentration was lowest with PLs from CMN treatment (Figure 3). PL20 from control tanks recorded the highest DNA value of 63.9 µg 100 mg wt-1 and differed significantly from CN (59.1 µg 100 mg wt-1) and CMN treatment value (P<0.05), but not from CM tanks (61.7 µg 100 mg wt-1). Mean RNA: DNA ratio differed significantly between all treatments (P<0.001) and value ranged from 4.84 (C) to 6.82 (CMN, Figure 3).
Analysis of data indicated a highly significant (P<0.001) relationship between shrimp growth rate in nursery tanks and PL20 RNA: DNA ratio, for all treatments (Figure 4). Regression analysis proved that more than 81 % of variation in growth rate could be explained by changes in RNA: DNA ratio. Similarly, analysis between PL20 RNA content and nursery growth rate (Figure 5) registered a coefficient of determination (R2) of 0.78 (P<0.001). But, DNA values failed to show any strong interaction with growth rate (R2=0.236).
Pond Survival
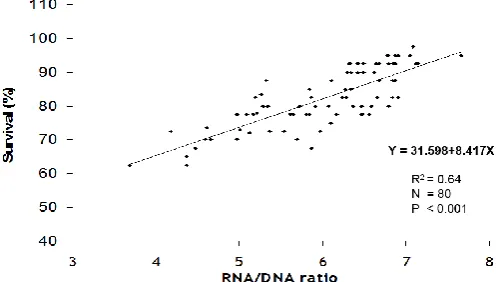
Post-stocking survival in ponds after two weeks of stocking showed significant difference between treatments (P<0.001; Table 2). Best survival was noticed with PL from CMN regime and was lowest (74.6±1.53 %) with those from C tanks. Comparison of PL20 RNA:DNA ratio with their two week post-stocking survival in pond indicated a positive association between the two (Figure 6). Regression analysis between two gave a relationship of Y =31.598+8.417X (Y=survival) with R2 value of 0.64.
Correlation matrix (Table 2) indicated that RNA content of PL20 was positively influenced by PL20 protein content (r=0.426) and had appreciable impact on ratio (r=0.840) and post-stocking survival (r=0.573).
Table 1. Growth characteristics of Fenneropenaeus indicus postlarvae fed different diet combinations for 10 days
Treatment Initial wet weight (mg)
Final wet weight
(mg) Weight gain/week
Survival (%) C
CM CN CMN
5.18±0.04 5.25±0.07 5.23±0.04 5.20±0.05
46.11±0.61 55.80±0.53 65.20±0.45 67.70±0.39
28.65±0.28a 35.42±0.31b 42.00±0.26c
43.75±0.25c
74.93±5.04a 86.07±4.59b 91.77±5.11c
93.60±3.65c Values are means (± S.E.). Values in same column with different superscript differ significantly (P<0.05).
Figure 1. Protein content (mean±S.E.) of F. indicus postlarvae fed different diet combinations.
C=Commercial diet, CM= Commercial diet plus microalgae, CN=Commercial diet plus natural diet. CMN=Commercial diet plus microalgae plus natural diet.
Figure 2. Trypsin activity (mean±S.E.) during different stages of development in F. indicus postlarvae fed different diet
combinations. Definition to abbreviations given in Figure 1.
Table 2. Correlation matrix of weight gain, survival, protein, trypsin activity, RNA, DNA and RNA/DNA ratio of F. indicus
postlarvae
Variables Growth Survival Protein Trypsin RNA DNA Ratio Pond survival
Growth 1 0.643 0.413 0.214 0.845 -0.134 0.895 0.500
P=0.000 P=0.000 P=0.315 P=0.000 P=0.237 P=0.000 P=0.000
Survival 0.643 1 0.638 -0.053 0.721 -0.343 0.723 0.450
P=0.000 P=0.000 P=0.642 P=0.000 P=0.002 P=0.000 P=0.000
Protein 0.413 0.638 1 -0.149 0.426 -0.303 0.580 0.281
P=0.000 P=0.000 P=0.187 P=0.000 P=0.006 P=0.000 P=0.11
Trypsin 0.214 -0.053 -0.149 1 0.013 0.292 -0.167 -0.202
P=0.315 P=0.642 P=0.187 P=0.907 P=0.008 P =0.139 P=0.073
RNA 0.845 0.721 0.426 0.013 1 -0.174 0.840 0.573
P=0.000 P=0.000 P=0.000 P=0.907 P=0.123 P=0.000 P=0.000
DNA -0.134 -0.343 -0.303 0.292 -0.174 1 -0.671 -0.617
P=0.237 P=0.002 P=0.006 P =0.008 P=0.123 P=0.000 P=0.000
Ratio 0.895 0.723 0.580 -0.167 0.840 -0.671 1 0.780
P=0.000 P=0.000 P=0.000 P=0.139 P=0.000 P=0.000 P=0.000
Pond survival
0.500 0.450 0.281 -0.202 0.573 -0.617 0.780 1
P=0.000 P=0.000 P=0.011 P=0.073 P=0.000 P=0.000 P=0.000
Figure 3. Mean (±SD) of RNA, DNA concentrations and RNA:DNA ratio of postlarvae fed different diets. Bars denote
Figure 4. Relationship between RNA:DNA ratio of PL20 stage postlarvae and growth rate of postlarvae in nursery with data
from all replicates of four treatments.
Figure 5. Relationship between RNA content of PL20 stage postlarvae and growth rate of postlarvae in nursery with data
from all replicates of four treatments.
Figure 6. Relationship between RNA:DNA ratio of PL20 stage postlarvae and post-stocking survival of postlarvae on day
14 in the pond.
Discussion
The natural feeds used as dietary supplement in this experiment have been individually tried for shrimp PL and have been reported as suitable protein source that improved survival and growth (Gopal and Paulraj, 1993). Deshimaru et al. (1985) found that P. monodon fed with soft parts of clam Venerupis
(DHA) and 20:4 n-6 (Cahu et al., 1995). The natural diets are also characterized as containing betaine and nucleotides which have been documented as having attractant qualities (Jones et al., 1997). Authors have also suggested growth promoting factors in mussel (Foster and Beard, 1973) and squid (Cruz-Suarez et al., 1987). It has also been reported that addition of natural diet (clam Villorita cyprinoids), increased the moulting rate of F. indicus juveniles (Regunathan and Nair, 1993).
Agreeing with the present results, Ribeiro and Jones (2000) also noticed that natural diet (mussel) regime outperformed artificial diet alone fed F. indicus PL in growth performance. But the results are not comparable as the authors have reported growth in terms of increase in length day-1. Poor performance of penaeid PL fed artificial diets has been previously reported (Amjad, 1990).
Combination of all three diets registered better results than individual or pair-wise combinations, evidenced by the best results with all diet treatment (CMN). This could be very well contributed to the better nutritional profile. Brito et al. (2004) also noticed that for the PL of Litopenaeus vannamei
(Boone) and Litopenaeus setiferus a combination of
Artemia, microparticulate commercial diet and algae was a better feed than Artemia or commercial diet alone. The best growth reported with all diet combination is also supported by significantly higher protein content in PL20.
Better performance of PL fed commercial diet plus microalgae combination (CM) compared to commercial diet alone tanks (C) suggest that the PL could assimilate microalgae and boost growth. Moss (1994a) reported that for a limited period, juvenile L. vannamei fed the diatom, Chaetoceros sp. exhibited growth not significantly different from a commercial diet fed treatment. Postlarval brown shrimp,
Farfantepenaeus aztecus could rapidly assimilate the diatom, Skeletonema costatum (Gleason, 1986). Both the algae used in this study have been reported as a good source of HUFA (Volkman et al., 1989) in addition to usual nutrient sources available in algae namely protein, lipids, carbohydrates vitamins and minerals (Ju et al., 2012). Microalgae also act as feed attractant and carotenoid sources (Regunathan and Wesley, 2006; Silva-Neto et al., 2012) Healthy phytoplankton bloom in water is also provide proper turbidity and subsequently stabilize the shrimp. Comparison between CM and CN treatments indicated that either in nursery or in pond experiments they do not differ significantly in terms of survival (but differ in weight gain in nursery), suggesting a better role of natural feeds on growth boosting than on survival improvement.
Highest trypsin activity was noticed when commercial diet alone was fed. Authors have suggested that it is an adjustment mechanism to low availability of dietary protein or to relatively poor digestibility of the diet (Le Vay et al., 1993; Kumlu
and Jones, 1995; Lemos and Rodriguez, 1998). It is suggested that high activity levels may maximize the assimilation of scarce compounds such as protein or carbohydrates (Lemos and Rodriguez, 1998), or increase the absorption of feeds (Le Vay et al., 1993). Low digestive capacity of artificial feeds has been noticed in PL of Penaeus monodon (Amjad, 1990). The low growth with commercial diet despite a strong trypsin response indicates that PL are unable to assimilate sufficient dietary protein to support growth equivalent to other treatments. The fact that feed which stimulated highest enzyme activity registered lowest growth has also been noticed by Le Vay et al.
(1993) in Marsupenaeus japonicus, Kumlu and Jones (1995) in F. indicus and Martin et al. (2006) in
Litopenaeus schmitti.
The noticeable enzyme activity increase from PL15 may reflect an adaptation to low protein content in commercial diet to maximize assimilation as mentioned before. In this context, the initial nearly constant trypsin response (from PL11 to PL14) suggests an initial acclimation period as reported in
M. japonicus fed prepared diet (Lemos and Rodriguez, 1998).
The addition of microalgae to CN tanks or to C tanks seems to reduce the enzyme activity. It could be that algal co-feed contributes extra digestible nutrients. It has been argued that under conditions of high food availability (here by the presence of algae), digestive enzyme levels are reduced as energy requirements are met without need for highly efficient digestion (Harms et al., 1991). The increasing trend in enzyme activity with postlarval age noticed in present study corroborates the observation by Ribeiro and Jones (2000). The authors noticed that tryptic enzyme response in F. indicus PL was highly correlated to length (0.978) and increased with size regardless of diet fed.
The higher concentration of RNA with shrimp fed commercial diet and natural diet combination indicate higher nutrient supply and protein synthesis. This is again confirmed by the significant association between protein and RNA content. Higher feeding rate and faster growth in shrimp resulted in increased RNA concentrations (Moss, 1994a, b). Dagg and Littlepage (1972) found that RNA concentrations of
reported highest DNA concentration with starved shrimp (L. vannamei) juvenile compared to those fed. With present results, variations in RNA: DNA ratio values were mainly due to variation in RNA content, with well-fed larvae (CMN) having higher concentrations of RNA and highest ratio value. Several studies have shown that there is a linear relationship between the rate of protein synthesis and the RNA: DNA ratio (Buckley et al., 1999) i.e. higher the ratio, better the feeding condition. James and Mustafa (2004) reported that nauplii from better nourished P. monodon broodstock registered higher RNA: DNA ratio. It has been reported that shrimp larvae with higher RNA: DNA ratio showed better dry as well as organic biomass and survival (Nunez et al., 2002). While, ratio values obtained with PL fed 10 days in the present study could account for 82% variation in growth rate, Moss (1994a) reported that more than 75% of the variation in growth rate could be explained with ratio values.
Studies have proven the influence of PL nutrition on its post-stocking survival (Palacios et al., 2004). Better nourished PL has more chances of coping with the stress involved with transportation and in adapting to new environment. Moreover, diets that result in higher survival and growth also produce PLs more resistant to stress tests (Paibulkichakul et al., 1998).
In other words, larvae with higher RNA: DNA ratio (best nutritional status) should be able to survive better and thus the ratio estimation should help to predict survival. As estimation of survival in open pond is not possible, pens are used in the experiments. The results clearly reiterate the fact that nursery feeding with natural feeds supplementation improved the survival performance of PL in pond. The relationship between RNA: DNA ratio of PL20 and post-stocking survival (r=0.780, P<0.05) suggests possible use of this index to assess the quality of PL before transferring them to pond and even to compare batches of PL. So, this index could be used to predict the PL survival in grow-out either alone or in combination with presently employed techniques like salinity stress test (Palacios and Racotta, 2007), and coefficient of variation of morphometric traits (Hernandez et al., 2001).
The results from present study further confirms the greater sensitivity of RNA:DNA index as an indicator of early shrimp PL’s physiological condition, as it has been reported with larvae (Nunez
et al., 2002) and juveniles (Moss,1994b). Differences in ratios were noticed in less than 24 hours after juvenile shrimp were exposed to different food sources (Moss, 1994a).
In summary, with analysis of growth rate, protein content and RNA: DNA ratio estimation, it could be ascertained that inclusion of natural feeds boosted the growth rate and survival by enhancing nutritional condition of shrimp. So, in regular nursery feeding natural diet mix could be used as
supplementary feed coupled with higher water exchange, as left over feed would seriously affect water quality. Co-feeding of commercial diet and natural diets would also bring down the cost associated with imported commercial diet. The study also confirms that RNA: DNA ratio could be used as a useful index to predict post-stocking survival.
Acknowledgements
The Author would like to thank Dr.Saeed A. Banaimoon, Professor, Hadramout University, Mukalla, Republic of Yemen, for technical support throughout the study.
References
Amjad, S. 1990. Growth and survival of Penaeus monodon
(Fabricius) larvae and postlarvae on natural and artificial diets. PhD thesis, Bangor: School of Ocean Sciences, University of Wales, UK, 332 pp.
Anand, P.S.S., Kohli, M.P.S., Dam Roy, S., Sundaray, J.K., Kumar, S., Sinha, A., Pailan, G.H. and Sukham, M.K. 2013. Effect of dietary supplementation of periphyton on growth performance and digestive enzyme activities in Penaeus monodon. Aquaculture, 392– 395: 59–68. doi:10.1016/j.aquaculture.2013.01.029 Ashford, A.J. and Pain, V.M. 1986. Effect of diabetes on
the rates of synthesis and degradation of ribosomes in rat muscle and liver in vivo. Journal of Biological Chemistry, 261: 4059-4065.
Brito, R., Chimal, M.E., Gelabert, R., Gaxiola, G. and Rosas, C. 2004. Effect of artificial and natural diets on energy allocation in Litopenaeus setiferus (Linnaeus, 1767) and Litopenaeus vannamei (Boone, 1931) early postlarvae. Aquaculture, 237: 517-531.
doi: 10.1016/j.aquaculture.2004.05.012.
Buckley, L.J., Caldarone, E. and Ong, T.L. 1999. RNA-DNA ratio and other nucleic acid based indicators for growth and condition of marine fishes. Hydrobiologia, 401: 265-277. doi: 10.1007/978-94-011-4201-4_20. Cahu, C., Cuzon, G. and Quazuguel, P. 1995. Effect of
highly unsaturated fatty acids, α–tocopherol and ascorbic acid in broodstock diet on egg composition and development of Penaeus indicus. Comparative Biochemistry and Physiology, 112(A): 417-424. doi: 10.1016/0300-9629(95)02009-8
Cara, B., Moyano, F.J., Zambonino, J.L. and Fauvel, Ch. 2004. Actividad tripsina y quimotripsina como indicadores de condición larvaria: estudio de restricción alimentaria y calidad de puesta. Conferencias Científica, III Congreso Iberoamericano Virtual de Acuicultura, 547-556.
Cordova-Murueta, J.H. and García-Carreno, F.L. 2002. Nutritive value of squid and hydrolyzed protein supplement in shrimp feed. Aquaculture, 210: 371-384. doi: 10.1016/S0044-8486(02)00011-X
Cruz-Suarez, L.E., Guillaume, J. and Van Wormhoudt, A. 1987. Effect of various levels of squid protein on growth and some biochemical parameters of Penaeus japonicus Bate juveniles, Nippon Suisan Gakkaishi, 53: 2083-2088.
Biology, 17: 162-170.
Deshimaru, O., Kuroki, K., Mazid, M.A. and Kitamura, S. 1985. Nutritional quality of compounded diets for prawn Penaeus monodon. Bulletin of the Japanese Society of Scientific Fisheries, 51: 1037-1044. doi: 10.2331/suisan.51.1037
Foster, R.M. Jr. and Beard, T.W. 1973. Growth experiments with the prawn Palaemon serratus fed with fresh and compounded foods. Fisheries Investigations, 27(2): 16.
Gleason, D.F. 1986. Utilization of salt marsh plants by postlarval brown shrimp: carbon assimilation rates and food preferences. Marine Ecology Progressive Series, 31: 151-158. doi: 10.3354/meps031151 Gopal, C. and Paulraj, R. 1993. Nutritional studies in
juvenile Penaeus indicus with reference to protein and vitamin requirements. CMFRI Special Publication, 56: 15-23.
Guillard, R.R.L. and J.H. Ryther. 1962. Studies of marine planktonic diatoms. I. Cyclotella nana Hustedt and Detonula confervacea Cleve. Can. J. Microbiol. 8: 229-239.
Harms, J., Anger, K., Klaus, S. and Seeger, B. 1991. Nutritional effects of ingestion rate, digestive activity, growth and biochemical composition of Hyas araneus
L. (Decapoda: Majidae). Journal of Experimental Marine Biology and Ecology, 145: 233-265.
doi: 10.1016/0022-0981(91)90178-Y
Hernandez, C., Voltolina, Rojas, P. and Nieves, M. 2001. Tests of quality of shrimp postlarvae in commercial hatcheries: a case study. Hidrobiologica, 11: 69-74. Hummel, B.C.W. 1959. A modified spectrophotometric
determination of chymotrypsin, trypsin and thrombin. Canadian Journal of Biochemistry and Physiology, 37: 1379-1399. doi: 10.1139/o59-157
James, M.J. and Mustafa, S. 2004. RNA, DNA and protein profiles in nauplii of tiger prawn, Penaeus monodon
in relation to nutritional condition of female broodstock. Journal of Aquaculture in the Tropics, 19: 155-164.
Jobling, M. 1983. A short review and critique of the methodology used in fish growth and nutrition. Journal of Fish Biology, 23: 685-703.
doi: 10.1111/j.1095-8649.1983.tb02946.x
Jones, D.A., Kamarudin, M.S. and Le Vay, L. 1993. The potential for replacement of live feeds in larval culture. Journal of the World Aquaculture Society, 24: 199-210. doi: 10.1111/j.1749-7345.1993.tb00009.x Jones, D.A., Yule, A. and Holland, D.L. 1997. Larval
nutrition. In: I. D’Abramo, D. Conklin, D.M. Akiyama (Eds.), Crustacean Nutrition, World Aquaculture Society, Baton Rouge, LA, USA: 353-389.
Ju, Z.Y., Deng, D.F., and Dominy, W. 2012. A defatted microalgae (Haematococcus pluvialis) meal as a protein ingredient to partially replace fishmeal in diets of Pacific white shrimp (Litopenaeus vannamei, Boone, 1931). Aquaculture, 354, 50-55.
doi: 10.1016/j.biortech.2014.12.047
Kerambrun, E., Henry, F., Courcot, L., Gevaerta, F. and Amara, R. 2012. Biological responses of caged juvenile seabass (Dicentrarchus labrax) and turbot (Scophtalmus maximus) in a polluted harbor. Ecological indicators, 19: 161–171.
doi: 10.1016/j.ecolind.2011.06.035
Khatoon, H., Banerjee, S., Yusoff, F.M. and Shariff, M. 2013. Use of microalgal-enriched Diaphanosoma
celebensis Stingelin, 1900 for rearing Litopenaeus vannamei (Boone, 1931) postlarvae. Aquaculture Nutrition, 19: 163-171. doi: 10.1111/j.1365-2095. 2012.00952.x
Kumlu, M., Jones, D.A., 1995. The effect of live and artificial diets on growth, survival and trypsin activity in larvae of Penaeus indicus. Journal of the World Aquaculture Society, 26: 406-415.
doi: 10.1111/j.1749-7345.1995.tb00836.x
Lee, P.G. and Lawrence, A.L. 1985. Effects of diet and size on growth, feed digestibility and digestive enzyme activities of the marine shrimp, Penaeus setiferus
Linnaeus. Journal of the World Aquaculture Society, 16: 275-287. doi:10.1111/j.1749-7345.1985.tb00210.x Lemos, D. and Rodriguez, A. 1998. Nutritional effects on body composition, energy content and trypsin activity of Penaeus japonicus during early postlarval development. Aquaculture, 160: 103–116.
doi: 10.1016/S0044-8486(97)00241-X
Le Vay, L., Rodriguez, A., Kamarudin, M.S. and Jones, D.A. 1993. Influence of live and artificial diets on tissue composition and trypsin activity in Penaeus japonicus larvae. Aquaculture, 118: 287-297. doi: 10.1016/0044-8486(93)90463-9
Martín, L., Arenal, A., Fajardo, J., Pimentel, E., Hidalgo, L., Pacheco, M., García, C. and Santiesteban, D. 2006. Complete and partial replacement of Artemia nauplii by Moina micrura during early postlarval culture of white shrimp (Litopenaeus schmitti). Aquaculture Nutrition, 12: 89-96. doi:10.1111/j.1365-2095.2006. 00383.x.
Moss, S.M. 1994a. Growth rates, nucleic acid concentrations and RNA:DNA ratios of juvenile white shrimp, Penaeus vannamei Boone, fed different algal diets. Journal of Experimental Marine Biology and Ecology, 182: 193-204. doi:10.1016/0022-0981(94) 90051-5
Moss, S.M. 1994b. Use of nucleic acids as indicators of growth in juvenile white shrimp, Penaeus vannamei. Marine Biology, 120: 359-367.
doi: 10.1007/BF00680209.
Munro, H.N. and Fleck, A. 1969. Analysis of tissue and body fluids for nitrogenous constituents. In: H.N. Munro (Ed.), Mammalian protein metabolism, Academic Press, New York: 423-525.
Nunez, M., Lodeiros, C., Donato, M.D. and Graziani, C. 2002. Evaluation of microalgae diets for Litopenaeus vannamei larvae using a simple protocol. Aquaculture International, 10: 177-187.
doi: 10.1023/A:1022102032684.
Olla, B.L., Davis, M.W. and Ryer, C.H. 1994. Behavioral deficits in hatchery-reared fish: potential effects on survival following release. Aquaculture and Fisheries Management, 25: 19–34.
Paibulkichakul, C., Piyatiratitivorakul, S., Kittakoop, P., Viyakarn, V., Fast, A.W. and Menasveta, P. 1998. Optimal dietary levels of lecithin and cholesterol for black tiger prawn Penaeus monodon larvae and postlarvae. Aquaculture, 167: 273–281.
doi: 10.1016/S0044-8486(98)00327-5
doi: 10.1016/j.jembe.2003.09.007
Palacios, E. and Racotta, I.S. 2007. Salinity stress test and its relation to future performance and different physiological responses in shrimp postlarvae. Aquaculture, 268: 123-135.
doi: 10.1016/j.aquaculture.2007.04.034
Regunathan, C. 2004. Regulation of Critical Control Points using advanced biotools for the improved larviculture performance of Fenneropenaeus indicus H. Milne Edwards, PhD thesis, Vadodara: M.S. University, India, 230 pp.
Regunathan, C. and Nair, K.P. 1993. A study on the black clam Villorita cyprinoides (Gray) as protein source in prawn diet. In: K. Rengarajan, A. Noble, V. Prathibha Kripa, N. Sridhar, M. Zakhriah (Eds.), CMFRI Special Publication No. 55. Central Marine Fisheries Research Institute, Cochin, India: 97-106.
Regunathan, C. and Wesley, S.G. 2006. Pigment deficiency correction in shrimp broodstock using Spirulina as a carotenoid source. Aquaculture Nutrition, 12: 425-432. doi: 10.1111/j.1365-2095.2006.00444.x. Ribeiro, F.A.L.T. and Jones, D.A. 2000. Growth and
ontogenic changes in activities of digestive enzymes in Fenneropenaeus indicus postlarvae. Aquaculture
Nutrition, 6: 53-64. doi:10.1046/j.1365-2095. 2000. 00132.x.
Rick, W. 1984. Trypsin: measurement with Na-p-toluenesulfonyl-L-arginine methyl ester as substrate. In: H.U. Bergmeyer (Ed.), Methods in Enzymatic Analysis,Academic Press, New York: 1013-1024. Schmidt, G. and Thannhauser, S.J. 1945. A method for
determination of deoxyribo-nucleic acid, ribonucleic acid and phosphoproteins in animal tissues. Journal of Biological Chemistry, 161: 83-89.
Silva-Neto, J., Nunes, A.J.P., Sabry- Neto, H. and Sal, M.V.C. 2012. Spirulina meal has acted as a strong feeding attractant for Litopenaeus vannamei at a very low dietary inclusion level. Aquaculture Research, 43: 430–437. doi: 10.1111/j.1365-2109.2011.02846.x Volkman, J., Jeffrey, S.W., Rogers, G.I., Nichols, P.D. and
Garland, C.D. 1989. Fatty acid and lipid composition of 10 species of microalgae used in mariculture. Journal of Experimental Marine Biology and Ecology, 128: 219-240. doi: 10.1016/0022-0981(89)90029-4. Wouters, R., Lavens, P., Nieto, J. and Sorgeloos, P. 2001.