A
NDRZEJS
KOMRA1, A
LICJAK
ĘDZIA2, K
RZYSZTOFD
UDEK3, 4Analysis of the Fossa Volumes of the Human
Cranial Base in the Fetal Period
Analiza objętości dołów podstawy czaszki człowieka
w okresie prenatalnym
1105 Military Hospital, Żary, Poland
2Department of Normal Anatomy, Wroclaw Medical University, Poland
3Machines Construction and Exploitation Institute, Technical University of Wrocław, Poland 4Technique Department, Karkonosze College in Jelenia Góra, Poland
Adv Clin Exp Med 2009, 18, 6, 543–549 ISSN 1230–025X
ORIGINAL PAPERS
© Copyright by Wroclaw Medical University
Abstract
Objectives. The goal of the study was a metrological analysis of the fossa volumes of the human cranial base in the fetal period.
Material and Methods. The survey comprised fetal material collected in the Department of Normal Anatomy, Wroclaw Medical University. The analysis covered 16 fetuses (5 females) at morphological ages of 17–25 weeks of fetal life and v−tublengths of 115–102 mm. The study incorporated anthropological and preparational methods, molding, and image computer analysis using the Irfan View and Scion Image for Windows programs. Sexual dimorphism, particular cranial base fossa volumes, as well as correlations between the volumes and fetal somatic features were studied. Impressions were made using polysiloxane with 18 D 4823 activator, which provided sig− nificant accuracy.
Results. The combination of computer analysis of the cranial fossa impressions and mathematical and statistical analyses allowed an innovative description, far more accurate than before, of cranial base fossa volumes in the growth period. The study did not reveal any significant sexual dimorphism of the examined fetuses’ somatic fea− tures or cranial base fossa measurements. Mean measurements of the anterior and medial fossae on the right and left sides also do not differ significantly, although in particular fetuses the difference reached 12%.
Conclusions. The volume of the medial cranial fossa seems especially interesting as it is significantly larger than those of the anterior and posterior fossae (Adv Clin Exp Med 2009, 18, 6, 543–549).
Key words:fetus, development, fossae of the cranial base, volume.
Streszczenie
Cel pracy.Analiza metrologiczna objętości dołów podstawy czaszki ludzkiej w okresie prenatalnym.
Materiał i metody. Badaniem objęto materiał płodowy pochodzący ze zbiorów Katedry i Zakładu Anatomii Pra− widłowej AM we Wrocławiu. Analizie poddano 16 płodów (w tym 5 żeńskich) w wieku morfologicznym 17–25 ty− dzień życia, o długości v−tub115–202 mm. W pracy zastosowano metodę: antropologiczną, preparacyjną, rewersu (wycisku), komputerowej analizy obrazu za pomocą programu Irfan Viewi programu Scion Image for Windows. Oceniano: dymorfizm płciowy, symetrię i objętość poszczególnych dołów podstawy czaszki, korelacje między ty− mi objętościami a cechami somatycznymi płodów. Do wykonania rewersów użyto polosiloksanu (elastomer sili− konowy o dużej lepkości) z aktywatorem 18 D 4823, który warunkował bardzo dużą dokładność.
Wyniki. W badaniach własnych połączenie metody komputerowej analizy obrazu wycisku dołów podstawy cza− szki z metodą analizy matematycznej i statystycznej pozwoliło w sposób nowatorski i o wiele dokładniejszy niż dotychczas opisać objętość dołów podstawy czaszki w okresie jej wzrostu. Na podstawie przeprowadzonych ba− dań nie zaobserwowano statystycznie istotnego dymorfizmu płciowego cech somatycznych badanych płodów i wymiarów dołów podstawy czaszki. Stwierdzono ponadto, że średnie wymiarów dołów przednich i środkowych po stronie prawej i lewej nie różnią się istotnie, mimo występowania różnic u poszczególnych płodów rzędu 12%.
Wyniki. Na szczególną uwagę zasługuje objętość dołów środkowych czaszki, która jest istotnie większa niż obję− tość dołów przednich i tylnych (Adv Clin Exp Med 2009, 18, 6, 543–549).
With regard to the fossae of the cranial base, their volume is not very common in the literature. This is probably due to the very complicated struc− ture of this area as well as problems in selecting a proper method which would accurately project its geometry. In his survey, Wysocki [1] measured the volumes of human and animal crania with the use of sand or shot. The measurements’ accuracy var− ied from 0.05 to 10 cm3. The author defined the
mean volumes of male and female crania. He also showed that a human being, as a primate, has the most developed and largest cranial volume and the smallest relative surface of the venal foramina.
In physical anthropology [2], anthropometric division includes formulas defining cranial volume:
• L. Manouvrier's formula for cranial volume:
male: VM=
(g – op) ×(eu – eu) ×(ba – b)× 1.14, 2
female: VF=
(g – op) ×(eu – eu) ×(ba – b)× 1.08, 2
• L. Pearson's formula for cranial volume: male: VM= 0.00037 ×(g – op) ×(eu – eu) ×
× (b – ba) + 406.01,
female: VF= 0.00040 ×(g – op) ×(eu – eu) ×
× (b – ba) + 206.00.
A V [cm3] volume ≤ 1149 denotes micro−
cephalia, 1150–1449 cm3 small volume, 1450–
1649 cm3average volume, 1650–1949 cm3 large
volume, and ≥1950 macrocephalia.
Derkowski [3] discusses irregular growth of the anterior cranial fossa in the first trimester and then a more regular increase in the second. He observed significant extension of the depth of the posterior fossa with respect to the plane of the anterior fossa bed (in the third trimester it exceeds 21 cm). The depth of the medial fossa increases to 5 mm in the 27th week of fetal life. The develop−
ment of the cranial base from the 4thto 6thmonths
of fetal life is symmetric with respect to the body’s median plane. Błaszczyk [4] examined posterior cranial fossa in 114 fetuses aged 4–6 months of fetal life and presented strong correlation between the posterior cranial fossa and age. The region’s parameters revealed the greatest growth dynamics between the 4thand 6thmonths of fetal life and then
a gradual slowing down. Up to the 6th month, the
posterior fossa increased most intensively in the anteroposterior direction. In addition, all measure− ment features demonstrated strong correlation with fetal head size.
The normal brain undergoes formation at the cranial base as its shape and growth are directly
and strictly connected with the volumes of the fos− sae. Head circumference usually reflects brain size, brain mass, and cranial capacity. These rela− tionships are especially clear in developmental deformities. Craniosynostosis results from the pre− mature stenosis of sutures (most often the saggital and coronary) with subsequent cranial deforma− tion. It may lead to a decrease in cranial cavity capacity and compression of the normally devel− oping brain [5]. Microcephaly [6], a clinical symp− tom of developmental age, is characterized by small cranial size and relatively large eye sockets. The cranium remains small due to hypoplasia of the brain, which is the stimulus. Microcephaly is diagnosed when the largest size of the head is smaller than three standard deviations for both sex and age of the examined population. Macroce− phaly [7] is a frequent symptom of hydrocephaly or hyperplastic or genetic disorders. Hydrocephaly [8] is a morphological cranial lesion resulting from an extensive amount of m–r fluid in the brain. The secondary extension of cerebral tissue before suture stenosis causes excessive cranial enlarge− ment. The Chiari malformation [9] with a low location of the cerebellar adenoids reveals the strict connection of decreased volume of the pos− terior cranial cavity and the ectopic level of the adenoids. Dandy−Walker's malformation [9], in turn, involves an enlarged posterior cranial cavity, with the cerebellar tentorium in a high position, cerebellar adenoid hypoplasia, as well as chamber IV cystic extension.
It is clear that the majority of diseases of the fetal and natal period reflect the volume, depth, or shape of the fossae of the cranial base. The devel− opment of neurosurgery provides more and more new reparatory possibilities. However, the cranial base is still a poorly understood region.
fossa which enabled the treatment of non−exten− sive diseases including pyramid of the temporal bone, pons−cerebellum angle, and meningiomas of the pyramid posterior surface and ascent.
In their papers, neurosurgeons have always stressed the importance of the anatomical and mor− phometric conditions of the operative area in the surgical access to the area of the cranial base [12]. The goal of this survey was a metrological analy− sis of the volumes of the particular cranial fossae in the fetal period.
Material and Methods
The material comprised reverse molds of cra− nial base fossae from 16 fetuses (Table 1) aged 17–25 weeks of fetal life belonging to the Normal Anatomy Dept. of the Wroclaw Medical Uni− versity. The impressions were made with the use of a special plastic mass. The fetuses' morpholog− ic ages were established on the basis of Scamon and Calkin's tables.
The reverse molds were placed on a stand of the authors’ own construction and photographs were taken in five planes with the use of a stable digital camera (Fig. 1). The images were trans− ferred to a computer and underwent measurements with the Irfan View and Scion Image for Windows programs. In the Scion for Windows program, a special “Measure” option was used after prior scaling of the object. The measurement results were listed in Microsoft Excel.
Fossa volumes were taken by three measure− ments of the volume displaced by the fluid of the reverse molds to within ± 1 ml. The results were
analyzed statistically with the use of the Statistica package. For all the variables (sizes), mean values, standard deviations, medians, and ranges were cal− culated. The compatibility of the variables’ distri− bution with a normal distribution was checked with the Shapiro−Wilk test and the significance level was P< 0.05.
Table 1.Statistics of features characterizing the 16 fetuses
Tabela 1.Statystyki cech somatycznych charakteryzujących 16 płodów
Feature x–±s Me xmin÷xmax
(Cecha pomiarowa)
Morphological age t[week] 20.3 ±2.0 20 17−25
(Wiek morfologiczny t[tydzień])
Crown−rump length v−tub[mm] 153.2 ±22.2 151 115−202
(Długość ciemieniowo−siedzeniowa v−tub[mm])
Body mass [g] 272 ±170 238 82−714
(Masa ciała m[g])
Head circumference HC[mm] 145 ±34 147 83−210
(Obwód głowy HC[mm])
Head length g–op [mm] 49.2 ±9.9 50 32−70
(Długość głowy g–op [mm])
Head width eu–eu[mm] 39.0 ±10.0 40 22−60
(Szerokość głowy eu–eu[mm]) x
– – arithmetic mean, średnia arytmetyczna, s– standard deviation, odchylenie standardowe.Me– median, mediana,
xmin– smallest value, wartość najmniejsza, xmax – largest value, wartość największa.
L R
R L
FCA
FCM
FCP
FCA
FCM
FCA FCM
FCP FCP
Fig. 1. The inner surface of a fetal cranial base and reverse molds of the cranial fossae, top and side views. Adapted denotations: FCA – anterior cranial fossa, FCM – central cranial fossa FCP – posterior cranial fossa, L – left side, R – right side
Results
The distributions of the basic somatic features of the examined fetuses did not differ significantly from the normal distribution, verified by the Sha− piro−Wilk test at the significance level of α= 0.05. Mean values of the measured features of the male and female fetuses were compared with the ttest for unrelated variables (Table 2). Female fetuses were older by 1.5 weeks and larger. However, the differences between male and female features were not statistically significant (P> 0.05). Due to the statistically non−significant sexual dimor− phism, the reverse molds of the sexes were com− bined in further statistical analysis.
Basic statistics for the depth (d), breadth (b), and length (l) of the cranial base fossae: anterior (FCA), middle (FCM) and posterior (FCP), on the right (R) and left (L) side, are presented in Table 3.
Correlation of cranial base and somatic fetal sizes is illustrated by a linear correlation index matrix (Table 5). The strongest correlation was between head length g–op and total fossa volume VFC (Fig. 3).
The middle fossa volume was significantly larger than the anterior or posterior (Figs. 2 and 4). The proportions of the particular fossa volumes (anterior VFCA, middle VFCM, posterior VFCP) in the
total volume of the cranial base fossae (VFC) were VFCA/VFC28.4 ± 4.8%, VFCM/VFC43.4 ± 9.3%, and VFCP/VFC28.2 ±6.0%.
Discussion
The application of silicone elastomer of increased adhesion with 18 D 4823 activator was
Table 2.Comparison of somatic features with relation to sex and Student’s ttest
Tabela 2.Porównanie cech somatycznych w zależności od płci oraz wynik testu t−Studenta
Measured feature Female fetuses Male fetuses t p value
(Cecha pomiarowa) (Płody żeńskie) (Płody męskie)
n= 5 n= 11
Morphological age t[week] 21.5 ±3.0 19.9 ±1.7 1.131 0.274
(Wiek morfologiczny [tydz.])
Crown−rump length v−tub[mm] 162.0 ±33,0 150.3 ±18,3 0.914 0.376 (Długość ciemieniowo−siedzeniowa [mm])
Body mass m[g] 327 ±206 254 ±163 0.725 0.480
(Masa ciała [g])
Head circumference HC[mm] 155 ±54 141 ±28 0.691 0.501
(Obwód głowy [mm])
Head length g–op [mm] 52.8 ±15.7 48.0 ±7.8 0.819 0.427
(Długość głowy [mm])
Head width eu–eu[mm] 43.5 ±16.1 37.5 ±7.4 1.044 0.314
(Szerokość głowy [mm])
ANOVA Friedmana:χ2
(16, 2)= 7,87; p= 0,020
FCA FCM FCP 0
2 4 6 8 10 12 14 16 18 20
V
[ ml
]
Mediana 25%-75% Min.-Maks.
Fig. 2.Comparison of cranial fossa volumes and Friedman's test results
Ryc. 2.Porównanie objętości dołów podstawy czaszki i wynik testu Friedmana
VFC= –26.07 + 0.951 *g–op r= 0.964
30 35 40 45 50 55 60 65 70 75
g-op[mm] 5
10 15 20 25 30 35 40 45
VFC
[ml]
Fig. 3.Correlation diagram and regression model of cranial base fossa volume VFCand cranial length g–op
of innovative character in obtaining the impres− sions. So far, anatomical shape or structure have been visualized by liquids, acrylic mass, or granu− lar substances (e.g. sand). The use of polysiloxane
provided measurements with high accuracy. The 3D−reverse method combined with measurement analysis with the Scion for Windows system [13] did not damage the precious material and enabled Table 3.Statistics of measurements characterizing cranial base fossa morphology in the 16 fetuses
Tabela 3.Statystyki wymiarów charakteryzujących morfologię dołów podstawy czaszki 16 płodów Parameter Symbol Descriptive statistics
(Wymiar) (Statystyki opisowe)
x
– s x
min Me xmax
Fossa depth dFCAR 14.2 3.2 9.4 14.9 19.4
(Głębokość dołu) dFCMR 20.6 5.0 12.7 20.8 28.2
[mm] dFCP 25.1 4.6 15.8 25.0 31.3
dFCAL 14.2 2.9 10.0 14.6 19.2
dFCML 20.2 3.6 14.2 21.0 24.8
Fossa width bFCAR 16.4 3.0 11.9 16.4 22.1
(Szerokość dołu) bFCMR 19.4 3.3 15.0 19.8 25.9
[mm] bFCP 32.3 6.5 24.7 32.6 46.6
bFCAL 16.5 2.6 12.3 16.1 21.7
bFCML 19.7 3.9 14.9 18.9 28.5
Fossa length lFCAR 18.0 3.1 11.3 18.1 25.7
(Długość dołu) lFCMR 21.0 5.2 12.6 20.3 32.2
[mm] lFCP 22.9 4.6 17.7 22.1 33.4
lFCAL 22.4 18.5 11.1 17.5 91.2
lFCML 26.3 16.8 13.6 22.6 87.3
Fossa volume VFCAR 2.9 1.7 0.3 2.5 6.1
(Objętość dołu) VFCAL 2.9 1.3 1.4 2.5 5.3
[ml] VFCA 5.9 2.9 2.2 5.2 11.4
VFCMR 4.4 2.7 0.3 3.6 10.1
VFCML 4.7 2.4 1.6 3.5 9.3
VFCM 9.1 5.0 1.9 6.8 19.1
VFCP 5.7 2.7 2.4 5.1 11.2
VFC 20.7 9.8 6.5 19.6 41.8
Table 4.Comparison of cranial base fossa sizes on the right and left side and Student’s ttest results for related variables Tabela 4.Porównanie wymiarów dołów podstawy czaszki po prawej i lewej stronie oraz wynik testu t−Studenta dla zmien− nych powiązanych
Measurement features Right side Left side t P−value
(Wymiar) R L
Anterior fossa depth dFCA[mm]
(Głębokość dołu przedniego dFCA[mm]) 14.2 ±3.2 14.2 ±2.9 0.027 0.979 Anterior fossa width bFCA[mm]
(Szerokość dołu przedniego [mm]) 20.2 ±3.6 0.586 0.567 0.820
Anterior fossa length lFCA[mm]
(Długość dołu przedniego [mm]) 19.7 ±3.9 –0.591 0.564 0.361
Anterior fossa volume VFCA[ml]
(Objętość dołu przedniego [ml]) 26.3 ±16.8 –1.260 0.227 0.946
Middle fossa depth dFCM[mm]
(Głębokość dołu środkowego [mm]) 4.67 ±2.39 –0.885 0.390 0.567 Middle fossa width bFCM[mm]
(Szerokość dołu środkowego [mm]) 19.4 ±3.3 19.7 ±3.9 –0.591 0.564 Middle fossa length lFCM[mm]
(Długość dołu środkowego [mm]) 21.0 ±5.2 26.3 ±16.8 –1.260 0.227 Middle fossa volume VFCM[ml]
measurement repetition and non−tactile analysis on the computer display. With the use of image com− puter analysis, Derkowski [3] presented an initial allometric increase in the anterior cranial fossa as well symmetry preservation in relation to the medial axis. Błaszczyk [4] showed anterior−poste− rior enlargement of the posterior cranial fossa and correlation with fetal head size. Classical methods were applied by Wysocki [1] in measuring cranial capacity. However, the use of granular materials was not of high accuracy. Due to a number of problems with material collection as well as the
complicated structure of this area, available litera− ture provides information elicited on the basis of USG or ultra−fast MR [14–17].
The authors concluded that no statistically sig− nificant sexual dimorphism of either somatic fea− tures or fossa sizes of the cranial base was observed. The average sizes of the anterior and middle fossae on the right and left side do not dif− fer significantly, although some differences in par− ticular fetuses occurred at the level of 12%. The volume of the middle fossa was significantly greater than those anterior and posterior.
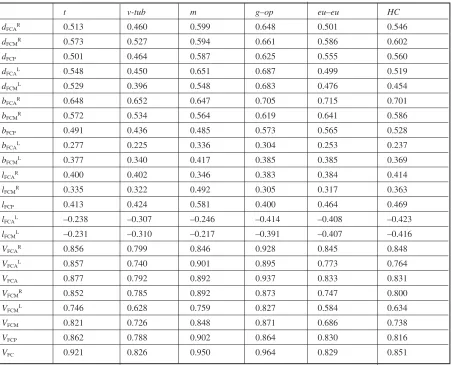
Table 5.Coefficient matrix of Pearson's correlation between somatic features and cranial base fossa sizes
Tabela 5.Macierz współczynników korelacji Pearsona między cechami somatycznymi i wymiarami dołów podstawy czaszki
t v−tub m g–op eu–eu HC
dFCAR 0.513 0.460 0.599 0.648 0.501 0.546
dFCMR 0.573 0.527 0.594 0.661 0.586 0.602
dFCP 0.501 0.464 0.587 0.625 0.555 0.560
dFCAL 0.548 0.450 0.651 0.687 0.499 0.519
dFCML 0.529 0.396 0.548 0.683 0.476 0.454
bFCAR 0.648 0.652 0.647 0.705 0.715 0.701
bFCMR 0.572 0.534 0.564 0.619 0.641 0.586
bFCP 0.491 0.436 0.485 0.573 0.565 0.528
bFCAL 0.277 0.225 0.336 0.304 0.253 0.237
bFCML 0.377 0.340 0.417 0.385 0.385 0.369
lFCAR 0.400 0.402 0.346 0.383 0.384 0.414
lFCMR 0.335 0.322 0.492 0.305 0.317 0.363
lFCP 0.413 0.424 0.581 0.400 0.464 0.469
lFCAL –0.238 –0.307 –0.246 –0.414 –0.408 –0.423
lFCML –0.231 –0.310 –0.217 –0.391 –0.407 –0.416
VFCAR 0.856 0.799 0.846 0.928 0.845 0.848
VFCAL 0.857 0.740 0.901 0.895 0.773 0.764
VFCA 0.877 0.792 0.892 0.937 0.833 0.831
VFCMR 0.852 0.785 0.892 0.873 0.747 0.800
VFCML 0.746 0.628 0.759 0.827 0.584 0.634
VFCM 0.821 0.726 0.848 0.871 0.686 0.738
VFCP 0.862 0.788 0.902 0.864 0.830 0.816
VFC 0.921 0.826 0.950 0.964 0.829 0.851
References
[1] Wysocki J:Anatomia otworów żylnych czaszki człowieka i wybranych gatunków zwierząt. Praca habilitacyjna, Warszawa 2001, 41, 58, 170.
[2] Antropologia fizyczna. http://archeointernet.pl/antropologia.html
[3] Derkowski W:Analiza metrologiczna dołu przedniego czaszki człowieka w okresie prenatalnym w aspekcie kli− nicznym. Praca doktorska, Wrocław 2005, 147.
[4] Błaszczyk E: Analiza morfologii dołu tylnego czaszki u człowieka w okresie prenatalnym. Praca doktorska, Wrocław 1997, 5–30, 37–38, 63–65, 68.
[6] Szczałuba K, Obersztyn E, Mazurczak T: Małogłowie jako częsty objaw w praktyce klinicznej diagnostyka różnicowa z uwzględnieniem etiopatogenezy. www_wadytwarzoczaszki_fora_pl.mht s.1
[7] Roland LP (oprac.):Neurologia Merritta, t. 2, red.: Kwieciński H, Kamińska AM, Wrocław 2008, wyd. 1. pol., 606–610.
[8] Schünke M, Schnite E, Schumacher U, Voll M, Wesker K (oprac.):Prometeusz. Atlas anatomii człowieka, t. 3, red. Aleksandrowicz R, Ciszek B, Kędzia A, Zyss T, Wrocław 2009, wyd. 1. pol., s. 7.
[9] Jurkiewicz E: Radiologia – diagnostyka obrazowa. Neuroradiologia. Zaburzenia rozwojowe ośrodkowego układu nerwowego. I Sesja zjazdowa, Kielce, 3 kwietnia 2009.
[10] Krajewski R: Anatomia i techniki dostępów chirurgicznych stosowanych w leczeniu schorzeń centralnego obszaru podstawy czaszki. www.ptcpc.net/publ/csb/articles/historia.html
[11] Żukiel R, Piestrzeniewicz R, Nowak S, Jankowski R, Wieloch M: Historia leczenia operacyjnego guzów muzgu. Neuroskop 2004, 6, 12.
[12]Anatomia i techniki dostępów chirurgicznych stosowanych w leczeniu schorzeń centralnego obszaru podstawy czaszki. Warszawa 2004. http://www.ptcpc.net/publ/csb/index.html
[13]Scion for Windows http://www.scioncorp.com.
[14] Hata K, Hata T, Senoh D, Makihara K, Aoki S, Takamiya O, Kitao M:Ultrasonographic measurement of the fetal transverse cerebellum in utero. Gynecol Obstet Invest 1989, 28, 111–112.
[15] Adamsbaum C, Moutard LM, Andre C, Merzoug V, Ferey S, Quere PM, Lewin F, Bianco−Fallet C:MRI of the fetal posterior fossa. Pediatr Radiol 2005, 35, 124–140.
[16] Campbell AW, Nardi D, Vintzileos MA, Rodis FJ, Turner WG, Egan FXJ: Transverse cerebellar diameter/abdominal circumference ratio throughout pregnancy: a gestational age – independent method to assess fetal growth. Obstet Gynecol 1991, 77, 893.
[17] Kushnir U, Shalev J, Bronstein M, Bider D, Liptz S, Nebel L, Mashiach S, Ben−Rafel Z:Fetal intracranial anato− my in the first trimester of pregnancy: transvaginal ultrasonographic evaluation. Neuroradiology 1989, 31, 222.
Address for correspondence:
Alicja Kędzia
Department of Normal Anatomy Wroclaw Medical University Chałubińskiego 6a
50−368 Wrocław Poland
E−mail: [email protected]
Conflict of interest: None declared