Available Online at www.ijergs.in
Volume - 5, Issue - 3, May - June - 2019, Page No. 08 - 19
Corresponding Author:Palak Khandelwal, Volume -5, Issue - 3, May – June 2019, Page No. 08 - 19
Pag
e
8
Modelling and Simulation of Multipath Fading Channels for Comparative Analysis of Different M-Array
Modulation Schemes
Palak Khandelwal, M.Tech. 4th Semester in Digital Communication, Jaipur Engineering College, Jaipur, (Rajasthan),
India
E-Mail Id: [email protected]
Ajay Patidar, Assistant Professor in E.C. Department, Jaipur Engineering College, Jaipur, (Rajasthan), India
E-Mail Id: [email protected]
Abstract
The wireless sector has experienced apparent annual growth rates in recent years. Wireless services provide access to the
most rural communities through communications. The wireless revolution has been triggered and supported by several
important factors: the development of microelectronics, smart broadband networks, the positive response of users and the
favorable regulatory climate around the world [1-2].
The purpose of this paper is to study M-ary digital modulation schemes based on the error performance that is very
important in the current communication scenario. The demand for higher data rates and better bandwidth performance is
increasing day by day, but the overall allocation of bandwidth is limited. Therefore, it is essential to study the modulation
schemes that give the best result. M-ary modulation schemes offer better bandwidth performance than other modulation
techniques and provide higher bit rates.
We then study how path and fading affect the modulated signals and the degradation of the symbol error rate due to these
multipath paths and different fading channels. This section deals with signal degradation due to the distribution of
Rayleigh, Rician and Nakagami-m. This whole study is very important if it is considered for the wireless environment
and if everyone knows that the current world is wireless. Another necessary study is how diversity will improve the
degradation of attenuated signals. By applying diversity to the end of the receiver, the version of the incoming signal
gives the best SNR. In this proposed work, the modeling and simulation of multipath fading channels are performed and
the comparison of different modulation techniques is performed by Rayleigh, Rician and Nakagami-m, with MRC
diversity combining for range of diversity order N and modulation order M.
Keywords: Digital Communication System, Fading channels, Antenna Diversity Techniques, M-array modulation
scheme, multipath-fading channel.
Introduction
The wireless communications industry has been experiencing phenomenal annual growth rates over the past several
years. This degree of growth reflects the tremendous demand for commercial communications services such as analog
and digital cellular telephony, and Personal Communications Services (PCS) including high speed data, full motion
video, Internet access, on-demand medical imaging, real-time road maps, and anytime, anywhere video conferencing.
In many applications, wireless telecommunications can eliminate the high costs of installing and maintaining traditional
© IJERGS, All Rights Reserved.
Pag
e
9
Pag
e
9
Pag
e
9
Pag
e
9
Pag
e
9
Pag
e
9
Pag
e
9
Pag
e
9
Pag
e
9
Pag
e
9
Pag
e
9
Pag
e
9
Pag
e
9
Pag
e
9
Pag
e
9
Pag
e
9
Pag
e
9
Pag
e
9
Pag
e
9
Pag
e
9
Pag
e
9
local area networks (WLANs), Bluetooth, Local Multipoint Distribution Systems (LMDS), satellite communications and
radio frequency identification (RFID) operating at frequencies extending into the millimeter-wave regime (>30 GHz).
One of the innovative techniques being developed to meet this increasing demand for higher data rates, better QoS, fewer
dropped calls, higher network capacity and user coverage is use of multiple antennas to improve energy/spectral
efficiency. Antenna diversity reception techniques are used extensively in fading channels to reduce the effect of flat
fading on system performance, including both fixed terminals and mobile communications systems.
Double Digital System and M-Array Modulation Schemes
Digital Communication System
The main work of digital communication system is to transfer digital data from the transmitter to receiver efficiently and
reliably. A basic digital communication system can be represented with the block diagram shown in Fig.1.
Fig.1 Block diagram of a digital communication system
The digital communication system consists of three main blocks: the digital modulator, digital demodulator, and
communication medium. Other elements included in the block diagram are for encoding, interleaving, and encryption.
Digital modulation schemes are classified into two large categories: constant envelope and non-constant envelope. Under
constant envelope class, there are three subclasses: FSK, PSK, and CPM. Under non-constant envelope class, there are
three subclasses: ASK, QAM and other non-constant envelope modulations. Among the listed schemes ASK, PSK, and
FSK are basic modulations, and MSK, GMSK, CPM, MHPM, and QAM, etc. are advanced schemes.
Faddin gChannel Modelling and Antenna Diversity Techniques
Fading Channel Characterization and Modelling
Radio-wave propagation through wireless channels is a complicated phenomenon characterized by various effects, such
© IJERGS, All Rights Reserved.
Pag
e
10
Pag
e
10
Pag
e
10
Pag
e
10
Pag
e
10
Pag
e
10
Pag
e
10
Pag
e
10
Pag
e
10
Pag
e
10
Pag
e
10
Pag
e
10
Pag
e
10
Pag
e
10
Pag
e
10
Pag
e
10
Pag
e
10
Pag
e
10
Pag
e
10
Pag
e
10
Pag
e
10
for tractable communication systems analyses. However, considerable efforts have been devoted to the statistical
modeling and characterization of these different effects. The result is a range of relatively simple and accurate statistical
models for fading channels which depend on the particular propagation environment and the underlying communication
scenario.
Fig.2 Fading channel manifestations
When a received signal experiences fading during transmission, both its envelope and Phase fluctuate over time. For
coherent modulations, the fading effects on the phase can severely degrade performance unless measures are taken to
compensate for them at the receiver. Most often, analyses of systems employing such modulations assume that phase
effects due to fading are perfectly corrected at the receiver, resulting in what is referred to as coherent demodulation. For
non-coherent detection, phase information is not needed at the receiver and therefore the phase variation due to fading
does not affect the performance. Hence performance analyses for both coherent and non-coherent detection over fading
channels requires only knowledge of the fading envelope statistics.
Error Performance of Different M-Array Modulation Scheme
Error Performance
The error performance, which is discussed in this thesis, is mainly caused due to the channel noise. Channel noise is
introduced anywhere between the transmitter output and the receiver input.
Modulation schemes are chosen or designed according to channel characteristic in order to optimize their performance.
© IJERGS, All Rights Reserved.
Pag
e
11
Pag
e
11
Pag
e
11
Pag
e
11
Pag
e
11
Pag
e
11
Pag
e
11
Pag
e
11
Pag
e
11
Pag
e
11
Pag
e
11
Pag
e
11
Pag
e
11
Pag
e
11
Pag
e
11
Pag
e
11
Pag
e
11
Pag
e
11
Pag
e
11
Pag
e
11
Pag
e
11
model, the channel does nothing but add a White Gaussian noise to the signal passing through it. Then the received signal
is represented as
Where is the received signal, is the transmitted signal, and is the additive white Gaussian noise. We calculate error
performance which caused by with zero mean and as variance.
System Performance Measures
Average Signal-to-Noise Ratio
Signal-to-noise ratio (SNR) is the most common performance measure characteristic of a digital communication system.
SNR is measured at the output of the receiver and is directly related to the data detection process. The term noise in
average signal-to-noise ratio refers to the ever-present thermal noise at the input to the receiver and the word average
means to statistical averaging over the probability distribution of the fading[12].
Where γ denotes the instantaneous SNR at the receiver output and denotes the probability density function.
Average Symbol Error Probability:
This performance criterion average symbol error probability (SEP) is the one that is most revealing about the nature of the
system behaviour. The primary reason for the difficulty in evaluating average SEP lies in the fact that the conditional SEP
is, in general, a nonlinear function of the instantaneous SNR, the nature of the nonlinearity being a function of the
modulation/detection scheme employed by the system.
Performance Comparision
In Fig.3-9 we show performance comparison for different modulation techniques is made under Rayleigh, Rician and
Nakagami-m fading with MRC diversity combining for range of diversity order N and modulation order M.
0 5 10 15 20 25 30
10-6 10-5 10-4 10-3 10-2 10-1 100
SNR per bit(dB)
pr
obabi
li
ty
of
s
y
m
bol
er
ror
MDPSK MPSK MQAM MFSK
© IJERGS, All Rights Reserved.
Pag
e
12
Pag
e
12
Pag
e
12
Pag
e
12
Pag
e
12
Pag
e
12
Pag
e
12
Pag
e
12
Pag
e
12
Pag
e
12
Pag
e
12
Pag
e
12
Pag
e
12
Pag
e
12
Pag
e
12
Pag
e
12
Pag
e
12
Pag
e
12
Pag
e
12
Pag
e
12
Pag
e
12
0 5 10 15 20 25 30
10-6 10-5 10-4 10-3 10-2 10-1 100
SNR per bit(dB)
pr
obabi
li
ty
of
s
y
m
bol
er
ror
MDPSK MPSK MQAM MFSK
Fig.4 SEP comparison of MFSK, MQAM, MPSK and MDPSK for M=8, K=2 and N=10
0 5 10 15 20 25 30
10-6 10-5 10-4 10-3 10-2 10-1 100
SNR per bit(dB)
pr
obabi
li
t
y
of
s
y
m
bol
er
r
or
MDPSK MPSK MQAM MFSK
© IJERGS, All Rights Reserved.
Pag
e
13
Pag
e
13
Pag
e
13
Pag
e
13
Pag
e
13
Pag
e
13
Pag
e
13
Pag
e
13
Pag
e
13
Pag
e
13
Pag
e
13
Pag
e
13
Pag
e
13
Pag
e
13
Pag
e
13
Pag
e
13
Pag
e
13
Pag
e
13
Pag
e
13
Pag
e
13
Pag
e
13
0 5 10 15 20 25 30
10-6 10-5 10-4 10-3 10-2 10-1 100
SNR per bit(dB)
pr
obabi
li
ty
of
s
y
m
bol
er
ror
MDPSK MPSK MQAM MFSK
Fig.6 SEP comparison of MFSK, MQAM, MPSK and MDPSK for M=8, m=4 and N=10
0 5 10 15 20 25 30
10-6 10-5 10-4 10-3 10-2 10-1 100
SNR per bit(dB)
pr
obabi
li
ty
of
s
y
m
bol
er
ror
MDPSK MPSK MQAM MFSK
© IJERGS, All Rights Reserved.
Pag
e
14
Pag
e
14
Pag
e
14
Pag
e
14
Pag
e
14
Pag
e
14
Pag
e
14
Pag
e
14
Pag
e
14
Pag
e
14
Pag
e
14
Pag
e
14
Pag
e
14
Pag
e
14
Pag
e
14
Pag
e
14
Pag
e
14
Pag
e
14
Pag
e
14
Pag
e
14
Pag
e
14
0 5 10 15 20 25 30
10-6 10-5 10-4 10-3 10-2 10-1 100
SNR per bit(dB)
pr
obabi
li
ty
of
s
y
m
bol
er
ror
MDPSK MPSK MQAM MFSK
Fig.8 SEP comparison of MFSK, MQAM, MPSK and MDPSK for M=16, K=0 and N=10
0 5 10 15 20 25 30
10-6 10-5 10-4 10-3 10-2 10-1 100
SNR per bit(dB)
pr
obabi
li
ty
of
s
y
m
bol
er
ror
MDPSK MPSK MQAM MFSK
© IJERGS, All Rights Reserved.
Pag
e
15
Pag
e
15
Pag
e
15
Pag
e
15
Pag
e
15
Pag
e
15
Pag
e
15
Pag
e
15
Pag
e
15
Pag
e
15
Pag
e
15
Pag
e
15
Pag
e
15
Pag
e
15
Pag
e
15
Pag
e
15
Pag
e
15
Pag
e
15
Pag
e
15
Pag
e
15
Pag
e
15
0 5 10 15 20 25 30
10-6 10-5 10-4 10-3 10-2 10-1 100
SNR per bit(dB)
pr
obabi
li
ty
of
s
y
m
bol
er
ror
MDPSK MPSK MQAM MFSK
Fig.10 SEP comparison of MFSK, MQAM, MPSK and MDPSK for M=16, m=2 and N=10
0 5 10 15 20 25 30
10-6 10-5 10-4 10-3 10-2 10-1 100
SNR per bit(dB)
pr
obabi
li
ty
of
s
y
m
bol
er
ror
MDPSK MPSK MQAM MFSK
© IJERGS, All Rights Reserved.
Pag
e
16
Pag
e
16
Pag
e
16
Pag
e
16
Pag
e
16
Pag
e
16
Pag
e
16
Pag
e
16
Pag
e
16
Pag
e
16
Pag
e
16
Pag
e
16
Pag
e
16
Pag
e
16
Pag
e
16
Pag
e
16
Pag
e
16
Pag
e
16
Pag
e
16
Pag
e
16
Pag
e
16
Table 1: Comparison of SEP for MPSK for different values of M and N (SNR=20)
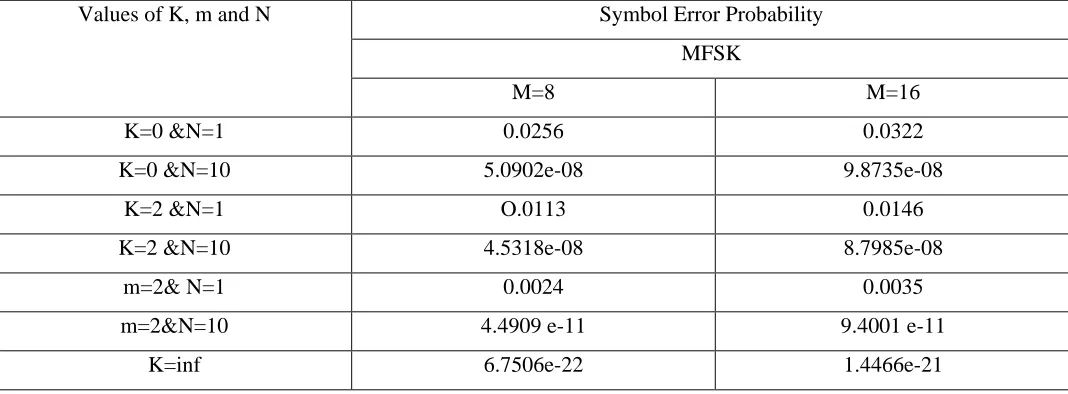
Table 2: Comparison of SEP for MFSK for different values at M and N (SNR=20)
Values of K, m and N Symbol Error Probability
MPSK
M=8 M=16
K=0 &N=1 0.0324 0.1099
K=0 &N=10 2.668e-05 0.0121
K=2 &N=1 0.0156 0.0695
K=2 &N=10 2.529e-06 0.0119
m=2& N=1 0.0056 0.0508
m=2&N=10 3.1620 e-06 0.0087
K=inf 5.253e-08 0.0057
Values of K, m and N Symbol Error Probability
MFSK
M=8 M=16
K=0 &N=1 0.0256 0.0322
K=0 &N=10 5.0902e-08 9.8735e-08
K=2 &N=1 O.0113 0.0146
K=2 &N=10 4.5318e-08 8.7985e-08
m=2& N=1 0.0024 0.0035
m=2&N=10 4.4909 e-11 9.4001 e-11
© IJERGS, All Rights Reserved.
Pag
e
17
Pag
e
17
Pag
e
17
Pag
e
17
Pag
e
17
Pag
e
17
Pag
e
17
Pag
e
17
Pag
e
17
Pag
e
17
Pag
e
17
Pag
e
17
Pag
e
17
Pag
e
17
Pag
e
17
Pag
e
17
Pag
e
17
Pag
e
17
Pag
e
17
Pag
e
17
Pag
e
17
Table 3: Comparison of SEP for MQAM for different values of M and N (SNR=20)
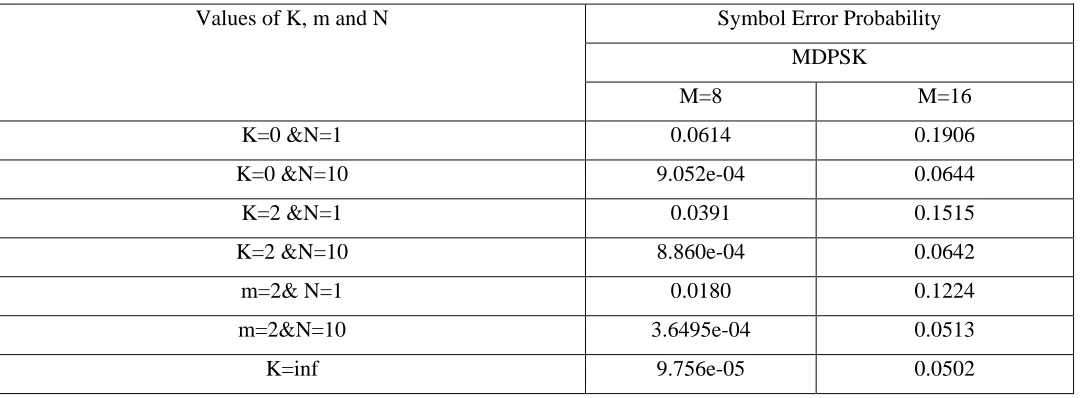
Table 4: Comparison of SEP for MDPSK for different values of M and N (SNR=20)
Values of K, m and N Symbol Error Probability
MDPSK
M=8 M=16
K=0 &N=1 0.0614 0.1906
K=0 &N=10 9.052e-04 0.0644
K=2 &N=1 0.0391 0.1515
K=2 &N=10 8.860e-04 0.0642
m=2& N=1 0.0180 0.1224
m=2&N=10 3.6495e-04 0.0513
K=inf 9.756e-05 0.0502
Conclusion and Future Work
The focus of this proposed work is on the mathematical analysis of the M-ary modulation schemes over frequency
non-selective slowly fading environment with N-branch receiver diversity using maximal ratio combining (MRC) technique.
The error performance is based on MGF approach which is better in terms of applicability.
This paper begins with an elaborate discussion of the M-ary modulation schemes as, M-ary Phase shift keying, M-ary
Frequency shift keying, M-ary Quadrature Amplitude modulation, Differential M-ary phase shift keying with their
constellation diagrams. Later elaborate discussion of the small scale fading models, and antenna diversity combining
techniques and goes on to underline the importance of study of MRC diversity combining in different fading channels.
Subsequently, a detailed introduction to error probability analysis is presented and the usefulness of our MGF approach in
analyzing SEP is highlighted.
Values of K, m and N Symbol Error Probability
MQAM
M=8 M=16
K=0 &N=1 0.0268 0.0727
K=0 &N=10 6.381e-06 7.812e-04
K=2 &N=1 0.0157 0.0466
K=2 &N=10 6.072e-06 7.614e-04
m=2& N=1 0.0044 0.0022
m=2&N=10 2.8363 e-07 2.4058 e-04
© IJERGS, All Rights Reserved.
Pag
e
18
Pag
e
18
Pag
e
18
Pag
e
18
Pag
e
18
Pag
e
18
Pag
e
18
Pag
e
18
Pag
e
18
Pag
e
18
Pag
e
18
Pag
e
18
Pag
e
18
Pag
e
18
Pag
e
18
Pag
e
18
Pag
e
18
Pag
e
18
Pag
e
18
Pag
e
18
Pag
e
18
It mainly contains the analysis of the probability of error of the M-ary signals over Rician and Nakagami-m fading
channel. From the curves and the mathematical analysis of the signals it is observed that as the number of signals or
number of M increases (M≥0, 1, 2… M), the error probability or more clearly the probability of Symbol error rate is
increased. It was also observed that the M-ary Frequency Shift Keying is giving the best probability of error over AWGN
channel. All this analysis is very much important for the basic analysis of any communication system, as the digital M-ary
modulation offers much more advantages than other modulation schemes. A generic approach for the accurate
performance evaluation of transmit diversity (also known as simulcast transmission) over fading channels is also an
interesting future research topic.
References
1. I. Munteanu, A. I. Bratcu, N.-A. Cutululis, and E. Ceang, Optimal Control of Wind Energy Systems towards a Global
Approach. Berlin, Germany: Springer-Verlag, 2008.
2. G. L. Stuber, Principles of Mobile Communication, 2nd ed. Norwell, MA: Kluwer Academic Publishers, 2001.
3. I. S. Gradshteyn and I. M. Ryzhik, Table of Integrals, Series, and Products, 6th ed. A. Jeffrey, ed. (San Diego:
Academic Press, 2000)
4. Qinfang Sun, Huanchun Ye, and Won-Joon Choi, Private Communications, Feb. 9, 2004.
5. C. S. Patel, G. L. Stuber, and T. G. Pratt, “Comparative analysis of statistical models for the simulation of Rayleigh
faded cellular channels,” IEEE Trans. Commun., vol. 53, pp. 1017-1026, June 2005.
6. J. G. Proakis, Digital Communications, 4th ed. New York: McGraw Hill, 2001.
7. M. Slack, “The probability distributions of sinusoidal oscillations combined in random phase,” IEE Proceedings, vol.
93, pp. 76-86, 1946.
8. W. R. Bennett, “Distribution of the sum of randomly phased components,” Quart. Appl. Math., vol. 5, pp. 385-393,
Jan. 1948.
9. K. Ohtani, K. Daikoku, and H. Omori, “Burst error performance encountered in digital land mobile radio channel,”
IEEE Trans. Veh.Technol., vol. 30, no. 4, pp. 156-160, Nov. 1981.
10. J. M. Morris, “Burst error statistics of simulated Viterbi decoded BPSK on fading and scintillating channels,” IEEE
Trans. Commun., vol. 40, pp. 34-41, 1992.
11. M. K. Simon and M.-S. Alouini, Digital Communication over Fading Channels, 2nd ed. New York: John Wiley &
Sons, 2005.
12. S. O. Rice, “Statistical properties of a sine wave plus random noise,” Bell Syst. Tech. J., vol. 27, pp. 109-157, Jan.
1948.
13. G. L. Stüber, Principles of Mobile Communication. Norwell, MA: Kluwer, 1996.
14. M. J. Gans, “A power-spectral theory of propagation in the mobile radio environment,” IEEE Trans. Veh. Technol.,
vol. VT-21, pp. 27–38, Feb. 1972.
15. W. R. Young Jr, “Comparison of mobile radio transmission at 150, 450, 900, and 3700 Mc.,” Bell Syst. Tech. J., vol.
© IJERGS, All Rights Reserved.
Pag
e
19
Pag
e
19
Pag
e
19
Pag
e
19
Pag
e
19
Pag
e
19
Pag
e
19
Pag
e
19
Pag
e
19
Pag
e
19
Pag
e
19
Pag
e
19
Pag
e
19
Pag
e
19
Pag
e
19
Pag
e
19
Pag
e
19
Pag
e
19
Pag
e
19
Pag
e
19
Pag
e
19
16. R. M. Gray and L. D. Davisson, Random Processes: A Mathematical Approach for Engineers. Englewood Cliffs, NJ:
Prentice-Hall, 1986.
17. M. F. Pop, “Statistical Analysis of Sum-of-Sinusoids Fading Channel Simulators,” M. Sc. thesis, Queen’s Univ.,
Kingston, ON, Canada, 1999.
18. J. Goldman, “Statistical properties of a sum of sinusoids and Gaussian noise and its generalization to higher
dimensions,” Bell Syst. Tech. J., vol. 53, no. 4, pp. 557–580, Apr. 1974.
19. A. Papoulis, Probability, Random Variables, and Stochastic Processes, Toronto, ON, Canada: McGraw-Hill, 1991.
20. I. S. Gradshteyn, I. M. Ryzhik, and A. Jeffrey, Eds., Table of integrals, series, and products, 5 ed. New York: