RP-HPLC Method Development and Validation for the Simultaneous Estimation of Etodolac and Paracetamol in Tablet Dosage Form
8
0
0
Full text
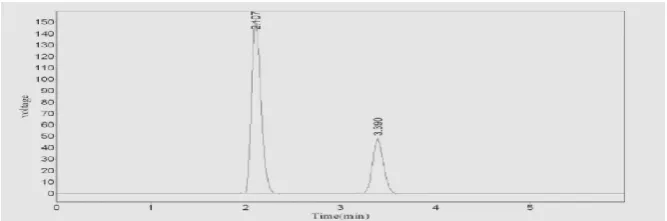
(2) 31 Tabassum. et al / Int. J. of Pharmacy and Analytical Research Vol-3(1) 2014 [30-37]. MATERIALS AND METHODS Chemicals/ Reagents and Solvents Etodolac -300mgand Paracetamol-425mg (ETOVA-P) tablet were obtained from, IPCA Laboratories. Ltd. Mumbai. Double Distilled Water (HPLC grade), Methanol (HPLC grade), Acetonitrile (HPLC grade), orthophosphoric acid and Potassium-dihydrogen phosphate were of reagent grade. The pharmaceutical preparations of combination of Etodolac and paracetamol that is ETOVA-P tablet (IPCA Laboratories. Ltd. Mumbai).. Instrumentation and Equipments The HPLC analysis was accomplished on WATERS high pressure liquid chromatograph outfitted with 515 reciprocating dual column HPLC pump, a manually operating Rheodyne injector with 20μL sample loop, X-terra C8 4.6mm x 150mm analytical column reversed-phase material. of 5μ size and a 2487 model UV-Visible detector. All the parameters of HPLC were controlled by N 2000 chromatographic system software. Other instruments used were TECHCOMP UV-Vis spectrophotometer of model 2310, Shimadzu electronic balance of model XEX-200, ADWA of model AD102U digital pH meter and ENERTECH of model SE60US ultrasonic bath sonicator.. ANALYTICAL METHOD DEVELOPMENT Optimization of UV conditions A X-terra symmetry C8 (4.6mm x 150mm, 5m) was used for chromatographic separation. Ther mobile phase composed of pH3Buffer (Orthophosphoricacid): Acetonitrile ( 50 : 50 ) at flow rate 0.9 mL/min with run time 6mins. Mobile phase and sample solution were filtered through a 0.45μm membrane filter and degassed.The detection of both drugs ws carried out at 260nm.. Figure-1.Isobestic point of Etodolac and Paracetamol. Optimized Method Parameters Mobile Phase : Phosphate buffer (3.0 pH): Acetonitrile(50:50) Column (Stationary Phase): X-terra (C8) (4.6mm x 150mm, 5m) Flow rate (ml/min): 0.9 Column temperature (°C): Ambient Volume of injection loop (l): 20 Detection wavelength (nm):260 Drug RT (min): Etodolac- 2.1, Paracetamol- 3.3. Figure 1.1.Optimized chromatogram www.ijpar.com.
(3) 32 Tabassum. et al / Int. J. of Pharmacy and Analytical Research Vol-3(1) 2014 [30-37]. PROCEDURE FOR PREPARATION OF SOLUTION Preparation of buffer. measured. %Assay was calculated by using the formula.. Take 1000ml of HPLC grade water. Dissolve 2.72 grams of Potassium di hydrogen phosphate salt and Adjusted the pH to 3.0 with orthophosphoric acid.. Calculation Assay % = AT. WS. DT. P. Avg. Wt. --------- x -------- -x ------- x ------- x ------------- X 100. Preparation of mobile phase. AS. A mixture of above prepared buffer 500 ml (50%), and 100 ml of HPLC grade Acetonitrile (50%) were mixed and degassed in ultrasonic water bath for 5 minutes. The mobile phase was filtered through 0.45 µ filter under vacuum.. Diluent Preparation Use Mobile phase Diluent Phase. ASSAY Preparation of the Etodolac and Paracetamol standard & sample solution Preparation of Standard Solution. DS. WT. 100. Label Claim. Label Claim Where: AT = Average area counts of sample preparation. AS = Average area counts of standard preparation. WS = Weight of working standard taken in mg. P = Percentage purity of working standard LC = LABEL CLAIM mg/ml.. ANALYTICAL METHOD VALIDATION The HPLC method was validated in accordance with ICH guidelines.. Accurately weighed and transferred 10 mg of Etodolac and 12.5 mg of Paracetamol working standard into a 10ml clean dry volumetric flask and added about 7.0ml of diluent. It was sonicated to dissolve completely and made volume up to the mark with the same diluent. (Stock solution) From this, 5 ml of the solution was pipette into another 50ml volumetric flask and diluted up to the mark with diluent From this, 2.4 ml of the solution was pipetted into another 20 ml volumetric flask and diluted up to the mark with diluent.. Sample Solution Preparation Accurately weighed and transferred tablet powder equivalent to 8 mg of Etodolac and 10 mg of Paracetamol working standard into a 100 ml clean dry volumetric flask and added about 70ml of diluent. It was sonicated to dissolve completely and made volume up to the mark with the same diluent. (Stock solution) From this, 3 ml of the solution was pipetted into another 10ml volumetric flask and diluted up to the mark with diluent... Procedure 20 µL of the standard and sample solutions were injected into the chromatographic system and areas for the Etodolac and Paracetamol peaks were. Accuracy Accuracy was carried out by % recovery studies at three different concentration levels. To the preanalyzed sample solution of ETO and PARA a known amount of standard drug powder of ETO and PARA were added at 50, 100 and 150 % level.. Precision The system precision of the method was verified by five replicate injections of standard solution containing ETO and PARA. The method precision was carried out the analyte five times using the proposed method. Repeatability was measured by multiple injections of a homogenous sample of ETO and PARA.. Linearity The linearity was determined separately for ETO and PARA. Linearity of the method was studied by injecting 5 concentrations of both drugs prepared in methanol and calibration curves were constructed by plotting peak area against the respective concentrations.. Limit of detection and Limit of quantitation Sensitivity of the proposed method was estimated in terms of Limit of Detection (LOD) and Limit of Quantitation (LOQ). LOD = 3.3 x ASD/S and LOQ. www.ijpar.com.
(4) 33 Tabassum. et al / Int. J. of Pharmacy and Analytical Research Vol-3(1) 2014 [30-37]. = 10 x ASD/S, Where, ‘ASD’ is the average standard deviation and ‘S’ is the slope of the line.. Robustness Robustness was evaluated by making deliberate variations in few method parameters such as variation of wave length; flow rate and change in mobile phase composition. The robustness of the method was studied for ETO and PARA.. RESULTS Selection of Chromatographic Conditions and Optimization of Mobile Phase:. Mobile phase was optimized to separate ETO and PARA using Symmetry C8 column (150 mm x 4.6 mm i.d., 5μm). Initially, ACN and phosphate buffer. in the Equal proportions were tried as mobile phase but the splitting of the peaks for both these drugs was observed. Therefore, after adjustment of pH of mixed phosphate buffer to 3.0 with orthophosphoric acid, and mobile phase composition (ACN and phosphate buffer in 50:50 % v/v) was tried for resolution of both drugs. Good resolution and symmetric peaks were obtained for both drugs when the pH of the mobile phase (buffer) was adjusted to 3.0. The flow rate of the mobile phase was 0.9 mL min-1. Under optimum chromatographic conditions, the retention time for ETO and PARA was found to be 2.1 and 3.3 min, respectively when the detection was carried out at 260 nm. A typical chromatogram of two drugs is shown in (Figure 1).. Table-1: ACCURACY DATA. Drugs. Etodolac. Paracetamol. Amount Added. Amount Found. % Recovery. (mg). (mg). 12.0. 5.28. 99.5 %. 18.0. 10.0. 100.25 %. 30.0. 14.9. 98.00 %. 22.5. 5.12. 100.00 %. 30.0. 10.0. 100.00 %. 37.5. 15.0. 100.00 %. % of mean recovery. 99.25 %. 100.00%. Table2: SYSTEM PRECISION ETODOLAC. PARACETAMOL. S.NO. RT. AREA. RT. AREA. 1. 2.098. 1931909. 3.373. 667961. 2. 2.090. 1885618. 3.348. 669145. 3. 2.090. 1853618. 3.365. 653218. 4. 2.082. 1857934. 3.340. 647193. 5. 2.098. 1864418. 3.373. 642990. Average. 2.0916. 1878699. 3.3598. 656101.4. Standard Deviation. 0.0066993. 32184.49. 0.015057. 11941.19. % RSD. 0.31999. 1.713126. 0.45627. 1.82. www.ijpar.com.
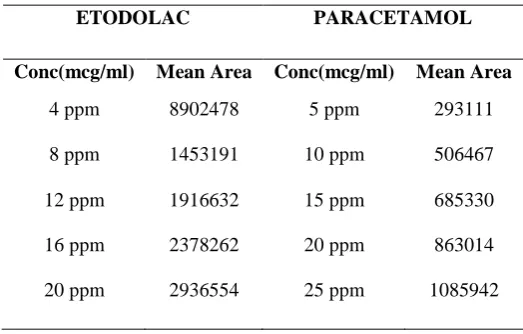
(5) 34 Tabassum. et al / Int. J. of Pharmacy and Analytical Research Vol-3(1) 2014 [30-37]. Table3: METHOD PRECISION ETODOLAC. PARACETAMOL. S.NO. RT. AREA. RT. AREA. 1. 2.115. 1786036. 3.39. 681699. 2. 2.09. 1828867. 3.348. 685004. 3. 2.09. 1848587. 3.357. 691862. 4. 2.098. 1783285. 3.373. 687733. 5. 2.115. 1816632. 3.382. 685330. Average. 2.1016. 1812681.4. 3.37. 686325.6. Standard Deviation. 0.012661. 28021.94976. 0.017364. 3767.485. 0.602. 1.545883891. 0.51525. 0.55. RSD. Table 4: Linearity results of Etodolac and Paracetamol ETODOLAC. PARACETAMOL. Conc(mcg/ml). Mean Area. Conc(mcg/ml). Mean Area. 4 ppm. 8902478. 5 ppm. 293111. 8 ppm. 1453191. 10 ppm. 506467. 12 ppm. 1916632. 15 ppm. 685330. 16 ppm. 2378262. 20 ppm. 863014. 20 ppm. 2936554. 25 ppm. 1085942. Fig 2: LINEARITY GRAPHS OF ETODOLAC AND PARACETAMOL. www.ijpar.com.
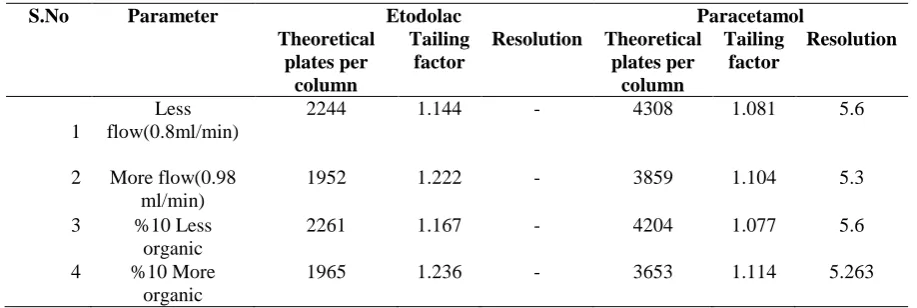
(6) 35 Tabassum. et al / Int. J. of Pharmacy and Analytical Research Vol-3(1) 2014 [30-37]. Table 5: LOD AND LOQ RESULTS. S.No. Drug name. Standard deviation. Slope. LOD. LOQ. 1. Etodolac. 14864. 123512. 0.361034. 1.203446. 2. Paracetamol. 7244. 38844. 0.559469. 1.864895. Table 6 Robustness Result For Etodolac And Paracetamol At Different Condition S.No. Parameter. 1 2 3 4. Less flow(0.8ml/min). Theoretical plates per column 2244. More flow(0.98 ml/min) %10 Less organic %10 More organic. Etodolac Tailing factor. Resolution. Paracetamol Theoretical Tailing Resolution plates per factor column 4308 1.081 5.6. 1.144. -. 1952. 1.222. -. 3859. 1.104. 5.3. 2261. 1.167. -. 4204. 1.077. 5.6. 1965. 1.236. -. 3653. 1.114. 5.263. RESULTS AND DISCUSSION Accuracy The accuracy of the method studied at three different concentration levels i.e. 50 %, 100 % and 150 % showed acceptable % recoveries in the range of 99.25% % for ETO and 100 % for PARA. The results are shown in Table 1.. Precision The precision study was evaluated on the basis of % RSD value was found to be in the range 0.3 – 1.82 and 0.5 – 1.5 %, respectively. As the RSD values were < 2% therefore developed method was precise. Results of precision study are shown in Table 2 & 3.. Linearity The linearity was determined separately for ETO and PARA. Linearity of the method was studied by injecting 5 concentrations of both drugs prepared in methanol and calibration curves were constructed by plotting peak area against the respective concentrations. The ETO and PARA followed linearity in the concentration range of 4– 20 μg. mL-1 and 5-25μg mL-1; respectively. The results are shown in Table 4.and Fig no 2.. Limit of detection and Limit of quantitation The LOD for ETO and PARA was found to be 0.361034 and 1.203446μg, respectively. The LOQ for ETO and PARA was found to be 0.559469 and 1.864895 μg, respectively. The low values of LOD and LOQ indicates high sensitivity of the method. The results are shown in Table 5.. Robustness study Robustness of the method was studied by making deliberate changes in the chromatographic conditions and the effects on the results were examined. The low value changes of theoretical plates, tailing factor indicating robustness of the method. When the method was performed by two different analysts under the same experimental and environmental conditions it was found to be rugged and % RSD (less than 2 %) indicating ruggedness of the method. The results are shown in Table 6.. www.ijpar.com.
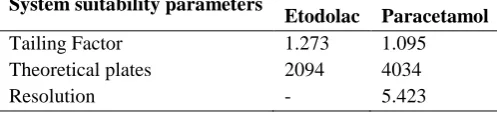
(7) 36 Tabassum. et al / Int. J. of Pharmacy and Analytical Research Vol-3(1) 2014 [30-37]. Analysis of marketed tablet formulation 3 replicates of the samples solutions (20 μL) were injected for quantitative analysis. The amounts of ETO and PARA estimated were found to 99.09 % and 98.42 %, respectively. A good separation and resolution of both drugs indicates that there was no interference from the excipients commonly present. in pharmaceutical formulations. The results are shown in Table 7.. System Suitability Test. The system suitability parameters such as resolution, number of theoretical plates and tailing factor were studied and were summarized in Table 8. Table 7: ASSAY RESULTS. Assay Results Drug Etodolac. Amount present/tablet 325mg. % of Assay 99.09. Paracetamol. 400mg. 98.42. Table 8: SYSTEM SUITABILITY PARAMETERS System suitability parameters Tailing Factor Theoretical plates Resolution. Etodolac 1.273 2094 -. Paracetamol 1.095 4034 5.423. ACKNOWLEDGEMENT CONCLUSION The developed RP-HPLC method is simple, precise, accurate, selective and reproducible. The method has been found to be adequately in RT and robust can be used for simultaneous determination of Etodolac and Paracetamol in tablet formulation. The method was validated as per ICH guidelines.. I Like to thankful to Pharma Tech Solution, Cherlapally, Hyderabad, India for providing the gift samples of Etodolac and Paracetamol. And also to the principal Dr.K.Rajeswar Dutt Smt.Sarojini Ramulamma College of Pharmacy, Mahabubnagar, Andhra pradesh, India and special thanks for Mrs. J.PRIYA madam and Ms.Ramathilagam madam as well as my friends who helped during the project work.. REFERENCES [1] Joel GH, Lee EL, Alfred GG. Goodman and Gilman’s the pharmacological basis of Therapeutics. 11th ed. Mc Graw Hill, New York, U.S.A; 2001. p. 635. [2] http://en.wikipedia.org/wiki/Etodolac. [3] Indian Pharmacopoeia. Indian Pharmacopoeia Commission, Ghaziabad. 2010; 2: 1318,1859. [4] British Pharmacopoeia. Ph Euro monograph 1590. London, Medicines and Health care products Regulatory Agency (MHRA) 2003; 1: 752,1417. [5] United States Pharmacopoeia. The Pharmacopoeia of United States 27th ed. and The National Formulary 22nd ed. Asia edition 2004;770 [6] Rang HP, Dale MM, Ritter JM, Flower RJ, Rang and Dale’s pharmacology 6th Ed. Elsevier, London; 2007; 607. [7] Patidar R, Baghel US, Patela S, Singhal M, Patidara N, Englaa G, et al. Simultaneous estimation spectrophotometric estimation of Paracetamol and Etodolac in tablet dosage forms. Journal of Global Pharma Technology. 2009;1(1):62-6. www.ijpar.com.
(8) 37 Tabassum. et al / Int. J. of Pharmacy and Analytical Research Vol-3(1) 2014 [30-37]. [8] Balan P, Carolin N, Lakshmi PM, Vanaja RM, Rajasekar S. Simultaneous estimation of Etodolac and Paracetamol by uv spectrophotometric method in tablet formulation. J Pharm Res. 2011;4(6):1663-5. [9] Gandhi SV, Chaube PH, Despande PB, Kulakarni VG. High Performance Thin Layer Chromatographic Analysis of Paracetamol and Etodolac in Spiked Human Plasma. J Pharm Biomed Sci. 2010;7 (13). [10] Gandhi SV, Chaube PH, Despande PB, Kulakarni VG. High Performance Thin Layer Chromatographic Analysis of Paracetamol and Etodolac in Combined Tablet dosage Form. J.Chem.Pharm.Res.,2012,4(3):1750-1755 [11] Shaikh KA, Devkhile AB. Simultaneous determination of Aceclofenac, Paracetamol, and Chlorzoxazone by RP-HPLC in pharmaceutical dosage form. J Chromatogram Sci. 2008 ; 46: 649-652. [12] GraceSNLhttp://www.sciencedirect.com/science/article/pii/073170859400859COR1, Critchley JAJH. The estimation of paracetamol and its major metabolites in both plasma and urine by a single High-Performance Liquid Chromatography assay. J Pharm Biomed Anal. 1994;12:1563-72. [13] Erdal D, Abdil O, Halil A, Dumitru B. Chemometric approach to simultaneous chromatographic determination of Paracetamol and Chlorzoxazone in tablets and spiked human plasma. J Liq Chromatograph Relat Technol. 2006; 29: 1803-22. [14] Deepali G, Pandurang D. Simultaneous Estimation of Aceclofenac and Paracetamol in solid dosage form by RP-HPLC Method. Int J of ChemTech Res. 2010;2:942-6. [15] Momin MY, Yeole PG, Puranik MP, Wadher SJ. Reverse phase HPLC method for determination of Aceclofenac and Paracetamol in tablet dosage form.Indian J Pharm sci. 2006; 68: 387-9. [16] Vaijanath GD, Sweta BS, Gunaji SB, Manisha P, Vivek KJ. Simultaneous determination of Etodolac and Acetaminophen in tablet dosage form by RP-LC. Chromatographia. 2009; 69(9-10): 1019-23. [17] Vyas AJ, Aggarwal NA, Nagori BP, Patel JK, Jobanputra CR, Viramgama DS Simultaneous estimation of Nabumetone and Paracetamol by Vierodt’s method in combined tablet dosage form. International Journal of ChemTech Research. 2010; 2(1): 543-47. *******************************. www.ijpar.com.
(9)
Figure
Related documents
When only one sampling point is used to establish the depth distribution of an FRN, it is important to demonstrate why this particular point can be expected to provide
The UNRWA/UNESCO education programme included in 1983 general education for some 336,207 chil- dren at elementary and preparatory levels in 651 UNRWA/UNESCO schools; vocational
We investigated the impact of physical fitness, BMI and gender of the provider on the quality of ECC when per- forming CVRs of 15:2 and 30:2. Our main findings are as follows: 1)
Conclusions: The findings from this study indicate the importance of “ pushing ” active classroom teachers from the design to the mapping arena by instituting curriculum
Mortality rates were calculated by determining the fraction of dogs that died at any time point compared to all dogs alive at that time point. Ratios of males to females were
supported, the B value of for previous experience of entrepreneur factor = .716> 0.01, which indicated that there is a positive and significant impact of previous
Methods: We identified all Dutch families in which two or three siblings were diagnosed with Pompe disease and described genotype, acid α -glucosidase activity, age at symptom
To better solve the problems discussed above, in this paper, we construct a KP-ABS-UT (key-policy attribute based signature with untrusted authority and traceabil- ity) scheme,
