R E S E A R C H
Open Access
IGENT: efficient entropy based algorithm for
genome-wide gene-gene interaction analysis
Min-Seok Kwon
1, Mira Park
2, Taesung Park
1,3*From
The 3rd Annual Translational Bioinformatics Conference (TBC/ISCB-Asia 2013)
Seoul, Korea. 2-4 October 2013
Abstract
Background:With the development of high-throughput genotyping and sequencing technology, there are growing evidences of association with genetic variants and complex traits. In spite of thousands of genetic variants discovered, such genetic markers have been shown to explain only a very small proportion of the underlying genetic variance of complex traits. Gene-gene interaction (GGI) analysis is expected to unveil a large portion of unexplained heritability of complex traits.
Methods:In this work, we propose IGENT, Information theory-based GEnome-wide gene-gene iNTeraction method. IGENT is an efficient algorithm for identifying genome-wide gene interactions (GGI) and gene-environment interaction (GEI). For detecting significant GGIs in genome-wide scale, it is important to reduce computational burden significantly. Our method uses information gain (IG) and evaluates its significance without resampling.
Results:Through our simulation studies, the power of the IGENT is shown to be better than or equivalent to that of that of BOOST. The proposed method successfully detected GGI for bipolar disorder in the Wellcome Trust Case Control Consortium (WTCCC) and age-related macular degeneration (AMD).
Conclusions:The proposed method is implemented by C++ and available on Windows, Linux and MacOSX.
Background
Recently, genome-wide association studies (GWAS) have been successful in understanding biological mechanisms and elucidating pathways that underlie complex genetic diseases [1]. However, GWAS were shown to explain only a small portion of the heritability of most complex diseases [2]. In order to find ‘missing heritability’ of complex diseases and understand genetic causes of dis-eases, gene-gene interaction (GGI) is expected to play an important role, because complex diseases are known to be controlled by multiple contributing genetic loci.
There are several statistical methods for detection of gene-gene interaction (GGI) [3]. One of conventional methods to characterize the interaction is regression analysis that includes main effects and relevant
interaction terms. However, higher-order interaction may often cause the cell counts to be sparse, so that the parameter estimator may not be obtained. In order to avoid the sparsity problem in higher-order interaction, data mining methods such as support vector machine (SVM) and random forest (RF) were applied to find GGI. However, these methods could handle only a small number of variants due to their heavy computation [4,5].
The multifactor dimensionality reduction (MDR) method proposed by Ritchieet al. [6] is a non-parametric method that reduces the number of dimensions by converting a high-dimensional multi-locus model to a one-dimensional model to avoid the sparsity problem. MDR evaluates classi-fiers, which are SNP combinations associated with the dis-ease of interest, to predict and classify disdis-ease status through cross-validation and permutation testing. The
k-fold cross-validation splits the data intoksubsets. The classifier is modelled on (k-1) subsets of the data and
* Correspondence: [email protected] 1
Interdisciplinary program in Bioinformatics, Seoul National University, Seoul, 151-747, Korea
Full list of author information is available at the end of the article
estimated by calculation of test accuracy on the remaining subset. This process is repeated for each subset. In addition to cross-validation, the permutation test can assess the sta-tistical significance of MDR classifiers. However, it is unfea-sible to use permutation tests for genome-wide scale interaction analysis because the permutation test is compu-tationally intensive. To overcome this heavy computational burden, Pattinet al. proposed an efficient hypothesis test using extreme value distribution (EVD) [7]. Their simula-tion results showed that the proposed testing method requires at least 20 permutation data to keep up with simi-lar power of 1000-fold permutation test.
Although MDR has a simple structure and fast compu-tation, it is hard to find high-order interactions in large-scaled dataset because of its exhaustive searching scheme. For example, detection of 2nd order interactions for 300,000 SNPs requires computing 4.5 × 10¹⁰ combina-tions by MDR. When we use 10-fold cross-validation or 1000-fold permutation test, it takes 10 times or 1000 times longer.
Wanet al. proposed BOOST, which is a fast method for detecting gene-gene interaction using Boolean operation-based screening and testing [8]. BOOST is computation-ally efficient and detects statistical significant interactions based on approximated likelihood ratio statistic. Their simulation study showed that BOOST has higher statisti-cal power than PLINK.
Recently, several approaches based on information theory for modelling GGI have been proposed [9-11]. Shannon started the information theory in 1948 by introducing the entropy that is measure for complexity in mathematical theory of communications [12].
Dawyet al. [9] proposed a relevance-chain method to identify the strongly associated lower-order interactions and build high-order interaction with the use of condi-tional mutual information. This method can provide fast detection of high-order interaction but it shows poor performance for GGI with no strong marginal effects. Chandaet. al. [10] proposed the k-way interaction infor-mation (KWII) metric and the total correlation informa-tion (TCI) for GGI identificainforma-tion. These entropy-based measures represent the amount of information of redun-dancy and dependency between SNPs and an environ-mental variable. This method performs a permutation test for statistical significance of detected interaction
models. Ruiz-Marín et al. [11] proposed an
entropy-based test for identification of single-locus association analysis. Although it showed a more powerful perfor-mance than the conventional Fisher tests, this method needs to be extended to handle GGI analysis. Yeeet al. [13] proposed a modified entropy based method to eval-uate the interactions between single SNP combinations. Their method was shown to be superior to the MDR
method in most simulation cases. However, applying this entropy based method directly to the genome-wide scale data would be infeasible because of computation-ally intensive permutations.
In this paper, we develop a fast and efficient method, named IGENT, Information theory-based GEnome-wide gene-gene iNTeraction method, using entropy to identify the gene-gene interaction in genome-wide scale. IGENT supports two types of strategies to identify gene-gene interactions related with diseases in genome-wide scale. One is an exhaustive search approach for lower-order interactions such as 2nd order interaction, and the other is a stepwise selection approach for higher-order interac-tion. With tens of thousands of SNPs from thousands of samples, it is difficult to calculate higher-order interac-tion exhaustively because the computainterac-tional burden is too heavy. IGENT provides a stepwise approach for higher-order interactions. The evaluation is based on the approximated gamma distribution of information gain without using permutation procedure, which allows us to overcome the computation burden for the GGI analysis in genome-wide scale [14].
Methods
Information theory
For detecting GGI associated with phenotypes, our mea-sure is based on basic concept of information theory. The entropy, which measures the quantity of an uncertainty, is defined as
H(Y) =−
j
p(Y =yj) log2p(Y =yj),
where the entropyH(X)of a discrete random variableY
is a function of the probability distributionp(Y=yj)which measures the average amount of information contained in
Y, or equivalently, the amount of uncertainty removed
upon revealing the outcome ofY. Conditional entropy of
Ygiven another discrete random variableXis
H(X—Y) =−
i
p(X=xi)H(Y—X=xi) The information gain (IG) is defined as follows,
IG(Y—X) =H(Y)−H(Y—X)
IG which is also called mutual information (MI) can be explained as the reduction in entropy (or uncertainty) of one random variable given another. It is known that the IG follows gamma distribution with parameter
a= (|X|−1) (|Y|−1) andb = 1/(Nln 2) approximately for the independentXand Yrandom variables [14].
IG(Y|X)∼
1
2(|Y| −1)(|X| −1), 1
Nln 2
whereNis the sample size and |X| and |Y| denote the number of levels of the random variablesXandY.
Entropy-based gene-gene interaction analysis
We use the information gain to detect GGI associated with phenotype. Given a case-control study with n
indi-viduals, letY be the disease status and X be the SNP
combinations, then
H(Y) =H(disease status)
H(Y—X) =H(disease status—SNP combination)
IG is given as
IG=H(Y)−H(Y—X)
The value of IG represents the true association strength. Since, under the null hypothesis of no associa-tion, IG follows a gamma distribution approximately by (1), we can assess the statistical significance of the asso-ciation of SNP combinations and disease.
Exhaustive searching approach and stepwise selection approach
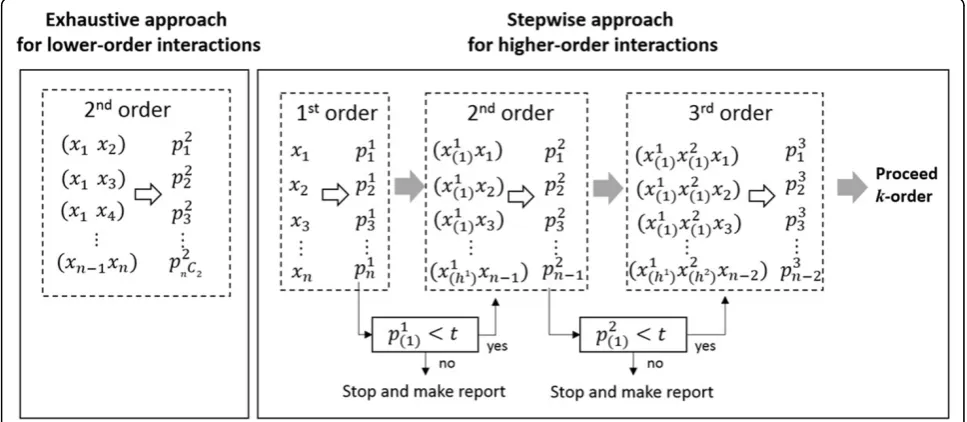
We propose IGENT, an entropy-based gene-gene interac-tion method for genome-wide interacinterac-tion analysis. IGENT supports exhaustive search (IGENT_exhaustive) for lower-order interaction and stepwise search (IGENT_stepwise) for higher-order interaction. In Figure 1, our exhaustive search approach and stepwise selection approach are described graphically.
IGENT_exhaust performs an exhaustive search for all possible combinations of variants for the given low
order. IGENT_stepwise selects higher-order interactions in a stepwise manner. The detailed steps are summar-ized as the follows.
1. Initial step: for all SNPs, calculate 1st order IGk
when k is order (in 1storder, k = 1.).
2. Select SNP or SNP combinations withpk <t, when
pkis p-value of hypothesis testing using the gamma dis-tribution andtis significant threshold.
3. Calculate IGk+1 for k+1 order interactions for the combinations with selected SNP or combinations adding additional other single SNP.
4. If there are significant interactions ink+1 order,k=k
+ 1 and repeat step 2~4. Otherwise, stop forward addition and repeat 2~4 step with the next ranked combinations.
This IGENT_stepwise selection approach reduces search space dramatically. With large genome-wide scale data, this approach makes it feasible to discover higher-order interactions. Although this stepwise algorithm is not guaranteed to find the global optimum interaction model, it provides at least a local optimum interaction model with some marginal effects. Therefore, this step-wise approach may have a limitation in detecting the gene-gene interactions without any marginal effects.
Implementation
Our method is implemented by C++ language. It is run-nable on Windows, LINUX and MacOSX. This program supports both exhaustive search and stepwise search.
Simulation studies
The main purpose of our method is to identify epistatic interactions from genome-wide data. In order to detect
Figure 1Exhaustive approach and stepwise approach in IGENT. t is threshold,pkjis p-value forjthcombination ink-order interaction.pk
(i)isi
th
gene-gene interaction for genome-wide data, computa-tional efficiency is a key issue. In simulation 1, we com-pared the computational efficiency of IGENT and other methods such as BOOST, MDR, RF and SVM. Among these methods, only IGENT and BOOST was shown to be feasible to analyze gene-gene interaction in genome-wide scale, as shown in simulation 1 of Results section. Thus, we mainly compared IGENT and BOOST in gen-ome-wide scale with regard to the power of identifying causal gene-gene interaction through simulations 2, 3, and 4. In simulation 5, we compared IGENT_exhaust and IGENT_stepwise.
For these simulation studies, we use following three epistatic models:
1) Epistatic model set 1 : Eight interaction models
Models 1-1, 1-2, and 1-3 have different strength of genetic effects while fixing the interaction structure, the minor allele frequencies (MAF) and prevalence which have been used by Namkunget al. [15]. Models 1-4, 1-5, and 1-6 have different interaction structures and penetrance functions which were used by Ritchie
et al. [16]. Models 1-7 and 1-8 were used by Bush
et al. [17]. Eight interaction models are summarized in additional file 1.
2) Epistatic model set 2 : four interaction models with main effects
Model 2-1 is a multiplicative model. Model 2-2 is an epistasis model that has been used to describe hand-edness and the colour of swine. Model 2-3 is a clas-sical epistasis model. Model 2-4 is the XOR model. The details of these four models have been described by Wan et al. [8].
3) Epistatic model set 3 : Seventy interaction models without main effects
Seventy Disease models without main effects have
been proposed by Velez et al. [18]. These 70
epi-static models are distributed across six heritability values (0.01, 0.025, 0.05, 0.1, 0.2, and 0.4) and two different MAFs (0.2 and 0.4).
Using these epistatic model sets, we conduct the fol-lowing five simulation studies.
Simulation 1: comparing computational efficiency for genome-wide gene-gene interaction analysis
To compare computational efficiency with IGENT, BOOST, MDR, SVM and RF, we construct simulation data using the epistatic model set 1. Each epistatic mod-els contains 2000 individuals balanced between cases and controls. Various numbers of SNPs (50, 100, 500, 1K, 2K, 5K, 10K, 100K, 350K, and 500K) are considered. All analysis are carried out on single core of a 3.16 GHz CPU with 4G memory on LINUX.
Simulation 2: estimating type I error in null simulation To take an assessment in terms of type I error, we con-struct 1000 replicates of null simulation data with 1000 SNPs and 1000 individuals based on the epistatic model set 1. In this null simulation data, all SNPs have no asso-ciation with disease status. Using null simulation, we compare false positive rates of IGENT and BOOST. Simulation 3: comparing the power of gene-gene interaction with main effects
To compare the power of IGENT and BOOST in gene-gene interaction with main effects, we use the epistatic model set 2. The MAFs of disease-associated SNPs is set to be 0.1, 0.2, and 0.4. Each data set has 1000 SNPs from 800 and 1600 individuals. We generate 100 replicate data sets under each setting. Using this simulation, we com-pare the power of IGENT and BOOST for gene-gene interaction with main effects.
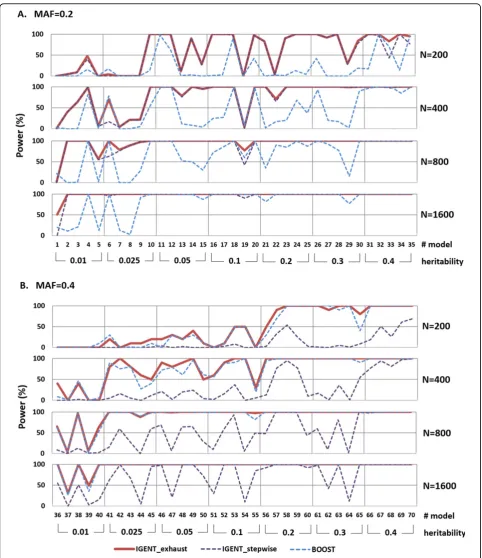
Simulation 4: comparing the power of gene-gene interaction without main effects
For evaluation of finding causal gene-gene interaction with no marginal effects, we use the epistatic model set 3. Using these 70 epistasis models in the set, we generate 100 replicate sets with 1000 SNPs (one pair is causal interaction, others are non-causal SNPs), and four sample sizes (200, 400, 800, and 1600 individuals).
Simulation 5: comparing the efficiency of stepwise search approach
For comparison of the efficiency of IGENT_stepwise, we use the epistatic model set 1. We generate 100 replicate set with 50 SNPs from 400 individuals. Through this simulation, we compare the power and computational efficiency of IGENT_stepwise and IGENT_exhaust.
Genome-wide data
Bipolar disorder (BD) data analysis
Using bipolar data from the Wellcome Trust Case Con-trol Consortium (WTCCC) [19], we demonstrated
genome-wide gene-gene interaction analysis for 2nd
-order and higher--order interaction. SNPs with call rates <95% were excluded from the analysis. SNPs showing Hardy-Weinberg equilibrium (HWE) p-value<5.7 × 10⁻⁷ were filtered out. Of the remaining SNPs, only SNPs showing MAF of at least 5% were carried forward for further analysis. All quality control steps were conducted using PLINK version 1.07 [20] and R scripts. We performed imputation using fastPHASE version 1.2 [21] to increase the density of interrogated SNPs. After quality control and imputation process, WTCCC-BD dataset contained 354,022 SNPs and 4,806 samples.
IGENT was applied for exhaustive two-way interaction
analysis of 6.27 × 10¹⁰ pairs of SNPs for WTCCC-BD
Age-related macular degeneration (AMD) data analysis For real data application, we used the AMD data set which contains 116,209 SNPs genotyped with 96 cases and 50 controls from the Age-Related Eye Disease Study (AREDS) [22]. We conducted the same quality control process as in the BD data analysis except forMAF < 0.01. All quality control steps were conducted using PLINK version 1.07 [20] and R scripts. After quality control pro-cess, we used remained 102,504 SNPs from 146 indivi-duals. Pair-wise interaction analysis of all 5,253,483,756 pairs was conducted with IGENT_exhaust and BOOST. Also, IGENT_stepwise was performed for higher-order interactions.
Results
Simulation results
In this section, we perform simulation studies to evaluate the properties of IGENT and to compare it with other pre-vious proposed methods. In order to detect gene-gene interaction with genome-wide data, computational effi-ciency is a key issue. In simulation 1, we compared the computational efficiency of IGENT and other methods such as BOOST, MDR, RF, and SVM. Among these meth-ods, only IGENT and BOOST were shown to be feasible to analyze gene-gene interaction in genome-wide scale in simulation 1. We mainly compared IGENT and BOOST in regard to the power of identifying causal gene-gene interaction in simulations 2, 3, and 4. In simulation 5, we compared IGENT_stepwise and IGENT_exhaust.
Simulation 1: comparing computational efficiency for genome-wide gene-gene interaction analysis
In order to compare the computational efficiency of IGENT and other methods including BOOST, MDR, RF,
and SVM, we conducted 2ndorder interaction analysis
with various the number of SNPs (50 to 500K). We used LIBSVM library [23] and“randomforest”R package [24] for SVM and RF methods, respectively. All methods used an exhaustive search strategy for fair comparison.
Table 1 presents computation times to finish 2ndorder interaction analysis by each method. In simulation data with 350K SNPs, IGENT_exhaust and BOOST can finish the interaction analysis within about 2.17 days and 1.8 days, respectively. However, due to their heavy computa-tion times, MDR, RF, and SVM are not feasible to conduct the gene-gene interaction analysis with genome-wide data-set. For focusing on genome-wide interaction analysis, we thus compare the power of IGENT and BOOST in simula-tions 2, 3, and 4.
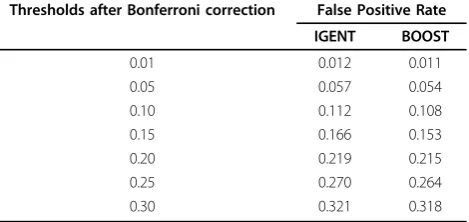
Simulation 2: estimating type I error in null simulation The type 1 error rates of IGENT_exhaust and BOOST are shown in Table 2. Although the type I error rates of IGENT_exhaust and BOOST seem to be slightly higher than the nominal value, it can be shown that the type I
errors of IGENT and BOOST agree with the nominal value lying within the confidence interval.
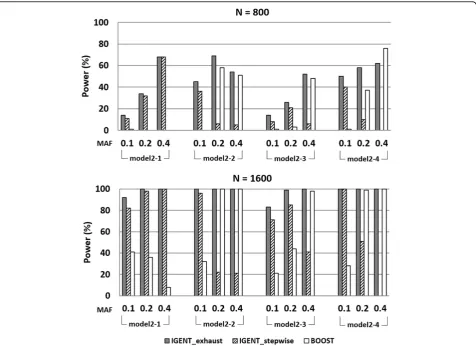
Simulation 3: comparing the power of gene-gene interaction with main effects
In simulation 3, we compared the IGENT_exhaust, IGENT_stepwise, and BOOST for detecting causal gene-gene interactions with main effects. In simulation data, IGENT used both exhaustive mode and stepwise mode, and BOOST used an exhaustive mode for searching the 2nd order interactions. The power is calculated as the propor-tion of 100 data sets in which the interacpropor-tions of the dis-ease-associated SNPs are detected. In all simulation data, we counted the interaction with its p-value (after multiple comparison procedure by Bonferroni correction) < 0.05. In stepwise mode, only variants with marginal p-value < 0.05 were proceeded to the next step for calculating 2ndorder interactions. In simulation 3, the detection probability of IGENT_exhaust showed the best performance in most models except for Models 2-4 (Figure 2). The performance of BOOST became worse in the simulation models with low minor allele frequency (MAF 0.1 and 0.2). In
Table 1 Computation time of IGENT, BOOST, MDR, RF, and SVM.
SNP size IGENT_exhaust BOOST MDR RF SVM
50 <1s <1s 1s 11s 13s
100 <1s <1s 4s 46s 53s
500 <1s <1s 1m 8s 20m 23m
1K 3s 1s 4m 25s 1h 15m 1h 29m
2K 8s 6s 19m 52s 5h 5h 50m
5K 38s 30s 2h 4m 1d 6h 1d 12h
10K 2m 34s 2m 7s *8h 16m *5d 5h *6d 3h 100K 4h 23m 3h 32m *35d *520d *614d 350K 2d 4h 1d 19h *422d *6366d *7524d 500K 4d 10h 3d 15h *861d *12992d *15353d
Computation time is measured in simulation 1 dataset which have 2000 individuals. All methods used an exhaustive search strategy for 2nd order interaction analysis.
* This computing time is estimated from the computing time in simulation data with 5000 SNPs.
All analysis are carried out on single core of a 3.16 GHz CPU with 4G memory on LINUX.
Table 2 Comparison of the type I error in null simulation
Thresholds after Bonferroni correction False Positive Rate
IGENT BOOST
0.01 0.012 0.011
0.05 0.057 0.054
0.10 0.112 0.108
0.15 0.166 0.153
0.20 0.219 0.215
0.25 0.270 0.264
simulation 3, the average power of IGENT_stepwise was about 60% relative to IGENT_exhaust, but its computing time was less than 1%(only 0.43%) of IGENT_exhaust. Simulation 4: comparing the power of gene-gene interaction without main effects
In simulation 4 which has causal gene-gene interaction without main effects, IGENT_exhaust performed better than or equivalent to BOOST in most simulation models. In simulation model with lower MAF and small sample size, BOOST showed poor performance. However, they provided equivalent results for models with a MAF of 0.4 or large sample sizes (Figure 3).
Simulation 5: comparing the efficiency of stepwise analysis and exhaust analysis of IGENT
We evaluated the performance of IGENT_stepwise in simulation 5 based on epistatic model set 1. All models were designed with the 2ndorder interaction effects and no marginal effects. Although these simulation models do not include the higher-order interaction effects over the
2ndorder, it is possible for spurious higher-order interac-tion to show the large effects on phenotype. To allow for finding spurious higher-order interactions, we exhaustively identified interactions from 1stto 4thorders. By comparing the identified interactions from IGENT_exhaust to those from IGENT_stepwise, we were able to evaluate the per-formance of IGENT_exhaust.
Table 3 shows IGENT_stepwise has the 66~93% of power of the IGENT_exhaust by using only 12~36% com-putation of the IGENT_exhaust. For the genome-wide interaction analysis, IGENT_stepwise can perform high-order interaction analysis very efficiently.
Analysis of real data: WTCCC bipolar disorder (BD) data
We conducted genome-wide two-way interaction analysis and higher-order interactions with WTCCC-BD dataset [19]. The IGENT_exhaust completed all two-way interac-tion pairs (6.25 × 10⁹) in about 74 hours on a 3.16 GHz
CPU with 4G memory on LINUX. IGENT_stepwise took about 1.5 hour in higher order interactions on the same system. Through exhaustive two-way interactions, IGENT_ exhaust reported 39 significant interactions. Among these
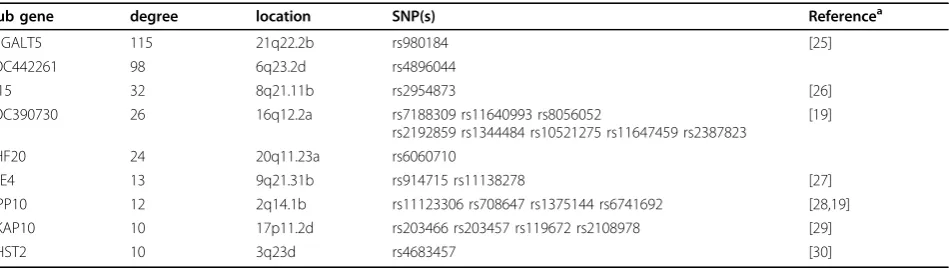
39 interactions, 26 pairs were also reported by IGENT_ stepwise. Among these hub genes, LOC390730, DPP10, and CDC25B have been reported with strong marginal effects in a previous study [19] (Table 4). B2GALT5, PI15,
TLE4, AKAP10, and CHST2 did not show significant asso-ciations in single locus analysis but showed strong interac-tions. These genes have been reported as causal genes associated with bipolar disorder in other studies [25-30].
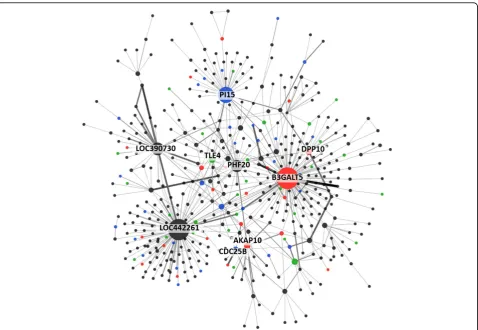
In Figure 4, using two-way interaction analysis by IGENT, we constructed the interaction network of WTCCC-BD. In two-way interaction network, a node represents a gene with SNP(s), edge is interaction reported by IGENT analysis. Node size shows the degree of the node and edge width shows the number of SNP-SNP interactions. All significant interactions were anno-tated by HuGE navigator database [31] and GWAS cata-log [32]. This network graph represents two-way interactions of genome-wide association with bipolar disorder and facilitates biological interpretations.
Analysis of real data: AMD data
We conducted 2nd order interaction analysis and
high-order interaction analysis using IGENT and BOOST for AMD data. Table 5 shows the top 5 interactions or SNP identified by IGENT. In the case of AMD data, there are SNPs (rs380390 (CFH) and rs1329428 (CFH)) with strong marginal effect. These SNPs were also reported
previously that they have strong association with AMD disorder [22]. IGENT also detected two interactions (CFH (rs380390) SGCD (rs931798) and CFH (rs1329428) -MED27 (rs9328536)). These two interactions also have a SNP with a strong marginal effect.
Discussion
In this paper, we proposed a fast analysis for searching for high-order interactions associated with complex dis-eases. IGENT uses information gain which represents association strength with GGI and phenotype without a specific genetic model. The IG measure can be used to compare the association strength across different order of interactions. IGENT adopts an exhaustive search scheme that investigates all possible interactions in lower-order interactions and a stepwise search scheme for higher-order interactions. The permutation and exhaustive search schemes of the previous GGI methods are computationally too intensive to be employed in large genome-wide scale data set for high-order interactions.
Note that IGENT is as fast as BOOST and shows bet-ter performance than BOOST. BOOST has been known to have a limitation that the degree of freedom of the
Table 3 Efficiency of stepwise analysis
Model Powerain Stepwise
approach
Power in exhaustive approach
ratio of powerb
Computation in stepwise approachc
ratio of computationd
1 0.69 1.00 0.69 148.4 0.12
2 0.71 0.92 0.77 149.7 0.12
3 0.67 0.80 0.84 154.7 0.13
4 0.87 0.94 0.93 147.6 0.12
5 0.62 0.88 0.70 147.0 0.12
6 0.63 0.96 0.66 145.3 0.12
7 0.19 0.25 0.76 167.3 0.14
8 0.15 0.17 0.88 445.6 0.36
a
Detection probability,
b
the ratio of power between stepwise approach and exhaustive approach
c
Average number of combinations to be computed in stepwise approach
d
Computation ratio is the ratio of computation amount of stepwise approach and computation amount of exhaustive approach. The computation of exhaustive approach is calculated using2C50= 1225.
Table 4 Hub genes (degree of nodes≥10) in two-way interactions of WTCCC-BD
Hub gene degree location SNP(s) Referencea
B3GALT5 115 21q22.2b rs980184 [25]
LOC442261 98 6q23.2d rs4896044
PI15 32 8q21.11b rs2954873 [26]
LOC390730 26 16q12.2a rs7188309 rs11640993 rs8056052
rs2192859 rs1344484 rs10521275 rs11647459 rs2387823
[19]
PHF20 24 20q11.23a rs6060710
TLE4 13 9q21.31b rs914715 rs11138278 [27]
DPP10 12 2q14.1b rs11123306 rs708647 rs1375144 rs6741692 [28,19]
AKAP10 10 17p11.2d rs203466 rs203457 rs119672 rs2108978 [29]
CHST2 10 3q23d rs4683457 [30]
statistical test should be reduced when the contingency table is too sparse due to low MAF [8]. IGENT, how-ever, presents stable performance in various epistasis models even with low MAF.
To evaluate significance of IGENT’s result, we used hypothesis testing framework by approximating the gamma distribution. It is known that IG follows the gamma distribution under the null hypothesis. Using approximation to the gamma distribution instead of per-mutation, we can easily calculate statistical significant interactions and save the computation time remarkably. A stepwise approach is more efficient than exhaustive approach in terms of computation. However, this stepwise
approach has a trade-off between computational efficiency and detection of optimal gene-gene interactions. Our step-wise approach, IGENT_stepstep-wise, reduced a search space extremely for detecting GGI with marginal effects. Although GGI without marginal effects can be generated mathematically [33-35], it is still unclear in practice how the GGI model without marginal effect is biologically asso-ciated with a complex disease [3].
In an exhaustive search scheme, our simulation result showed that IGENT_exhaust consistently had better performance than BOOST, as shown in Figures 2 and 3. Although both BOOST and IGENT showed efficient and fast computational performances, IGENT showed power higher than or equivalent to that of BOOST.
Conclusions
In conclusion, we proposed a fast and efficient enhanced entropy-based GGI analysis method. Due to its fast and efficient computation scheme, it can easily identify the gene-gene interaction in genome-wide scale. Through real GWAS data analysis, IGENT successfully identified low order and high order interactions. IGENT has been
Figure 4Gene-gene interaction network for WTCCC-BD dataset. Red nodes represent genes reported in previous GWAS literature with bipolar disorder dataset. Blue nodes are the genes related with bipolar disorder in previous literature. Green nodes are the genes related with other psychiatric disorders (schizophrenia and depression disorder). Width of edge is the significance level of interaction.
Table 5 Interaction analysis result using AMD data set
rank SNP P
1 CFH(rs380390) SGCD(rs931798) 8.454 × 10⁻¹² 2 CFH(rs1329428) MED27(rs9328536) 1.943 × 10⁻¹⁰
3 CFH(rs380390) 2.087 × 10⁻⁷
4 INPP4B(rs3775640) 3.128 × 10⁻⁷
implemented with C++, and is available in http://bibs. snu.ac.kr/software/igent.
Additional material
Additional file 1:Eight epistatic interaction models used in simulation 3. Additional file descriptions text (including details of how to view the file, if it is in a non-standard format).
List of abbreviations used
IGENT, Interactions analysis method in Genome-wide scale based on ENTropy; WTCCC, the Wellcome Trust Case Control Consortium; BD, Bipolar disorder; SVM, support vector machine; RF, random forest; GGI, gene-gene interaction; IG, information gain;
Competing interests
The authors declare that they have no competing interests.
Authors’contributions
MK performed the programing and the analysis, and drafted the manuscript. MP participated in the design of the study. TP conceived of the study, and participated in its design and coordination and helped to draft the manuscript. All authors write, read and approved the final manuscript.
Acknowledgements
This work was supported by the National Research Foundation of Korea (NRF) grant funded by the Korean government (MSIP) (2012R1A3A2026438, 2008-0062618) and by the Korea Healthcare Technology R&D Project, Ministry for Health & Welfare, Republic of Korea (A101915).
Declarations
Publication for this article has been funded by the Seoul National University. This article has been published as part ofBMC Medical GenomicsVolume 7 Supplement 1, 2014: Selected articles from the 3rd Translational Bioinformatics Conference (TBC/ISCB-Asia 2013). The full contents of the supplement are available online at http://www.biomedcentral.com/ bmcmedgenomics/supplements/7/S1.
Authors’details
1Interdisciplinary program in Bioinformatics, Seoul National University, Seoul, 151-747, Korea.2
Department of Preventive Medicine, Eulji University, Daejeon, 301-768, Korea.3Department of Statistics, Seoul National University, Seoul, 151-747, Korea.
Published: 8 May 2014
References
1. Seng KC, Seng CK:The success of the genome-wide association approach: a brief story of a long struggle.Eur J Hum Genet2008,
16:554-64.
2. Eichler EE, Flint J, Gibson G, Kong A, Leal SM, Moore JH, Nadeau JH:
Missing heritability and strategies for finding the underlying causes of complex disease.Nat Rev Genet2010,11:446-50.
3. Cordell HJ:Detecting gene-gene interactions that underlie human diseases.Nat Rev Genet2009,10:392-404.
4. Chen SH, Sun J, Dimitrov L, Turner AR, Adams TS, Meyers DA, Chang BL, Zheng SL, Grönberg H, Xu J, Hsu FC:A support vector machine approach for detecting gene-gene interaction.Genet Epidemiol2008,32:152-67. 5. Winham SJ, Colby CL, Freimuth RR, Wang X, de Andrade M, Huebner M,
Biernacka JM:SNP interaction detection with random forests in high-dimensional genetic data.BMC bioinformatics2012,13:164.
6. Ritchie MD, Hahn LW, Roodi N, Bailey LR, Dupont WD, Parl FF, Moore JH:
Multifactor-dimensionality reduction reveals high-order interactions among estrogen-metabolism genes in sporadic breast cancer.Am J Hum Genet2001,69:138-47.
7. Pattin KA, White BC, Barney N, Gui J, Nelson HH, Kelsey KT, Andrew AS, Karagas MR, Moore JH:A computationally efficient hypothesis testing
method for epistasis analysis using multifactor dimensionality reduction.
Genet Epidemiol2009,33:87-94.
8. Wan X, Yang C, Yang Q, Xue H, Fan X, Tang NL, Yu W:BOOST: A fast approach to detecting gene-gene interactions in genome-wide case-control studies.Am J Hum Genet2010,87:325-40.
9. Dawy Z, Goebel B, Hagenauer J, Andreoli C, Meitinger T, Mueller JC:Gene mapping and marker clustering using Shannon’s mutual information.
IEEE/ACM Trans Comput Biol Bioinform2006,3:47-56.
10. Chanda P, Zhang A, Brazeau D, Sucheston L, Freudenheim JL, Ambrosone C, Ramanathan M:Information-theoretic metrics for visualizing gene-environment interactions.Am J Hum Genet2007,81:939-63. 11. Ruiz-Marín M, Matilla-García M, Cordoba JA, Susillo-González JL,
Romo-Astorga A, González-Pérez A, Ruiz A, Gayán J:An entropy test for single-locus genetic association analysis.BMC Genet.2010,11:19.
12. Shannon CE:A mathematical theory of communication.Bell Syst Tech J 1948,23:379-423.
13. Yee J, Kwon MS, Park T, Park M:A modified entropy-based approach for identifying gene-gene interactions in case-control study.PLoS ONE2013,
8:e69321.
14. Goebel B, Dawy Z, Hagenauer J, Muller J:An approximation to the distribution of finite sample size mutual information estimates.Proc IEEE Int’l Conf Comm2005, May.
15. Namkung J, Kim K, Yi S, Chung W, Kwon MS, Park T:New evaluation measures for multifactor dimensionality reduction classifiers in gene-gene interaction analysis.Bioinformatics2009,25:338-45.
16. Ritchie MD, Hahn LW, Moore JH:Power of multifactor dimensionality reduction for detecting gene-gene interactions in the presence of genotyping error, missing data, phenocopy, and genetic heterogeneity.
Genet Epidemiol2003,24:150-7.
17. Bush WS, Edwards TL, Dudek SM, McKinney BA, Ritchie MD:Alternative contingency table measures improve the power and detection of multifactor dimensionality reduction.BMC Bioinformatics2008,9:238-244. 18. Velez DR, White BC, Motsinger AA, Bush WS, Ritchie MD, Williams SM,
Moore JH:A balanced accuracy function for epistasis modeling in imbalanced datasets using multifactor dimensionality reduction.Genet Epidemiol2007,31:306-15.
19. Wellcome Trust Case Control Consortium:Genome-wide association study of 14,000 cases of seven common diseases and 3,000 shared controls.
Nature2007,447:661-78.
20. Purcell S, Neale B, Todd-Brown K, Thomas L, Ferreira MA, Bender D, Maller J, Sklar P, de Bakker PI, Daly MJ, Sham PC:PLINK: a tool set for whole-genome association and population-based linkage analyses.Am J Hum Genet2007,81:559-75.
21. Scheet P, Stephens M:A fast and flexible statistical model for large-scale population genotype data: applications to inferring missing genotypes and haplotypic phase.Am J Hum Genet2006,78:629-44.
22. Klein RJ, Zeiss C, Chew EY, Tsai JY, Sackler RS, Haynes C, Henning AK, SanGiovanni JP, Mane SM, Mayne ST, Bracken MB, Ferris FL, Ott J, Barnstable C, Hoh J:Complement factor H polymorphism in age-related macular degeneration.Science2005,308:385-9.
23. Chang CC, Lin CJ:LIBSVM: A library for support vector machines.ACM Transactions on Intelligent Systems and Technology2011,2(3):1-27. 24. Breiman L:Random Forests.Machine Learning2001,45:5-32.
25. Hamshere ML, Green EK, Jones IR, Jones L, Moskvina V, Kirov G, Grozeva D, Nikolov I, Vukcevic D, Caesar S, Gordon-Smith K, Fraser C, Russell E, Breen G, St Clair D, Collier DA, Young AH, Ferrier IN, Farmer A, McGuffin P, Wellcome Trust Case Control Consortium, Holmans PA, Owen MJ, O’Donovan MC, Craddock N:Genetic utility of broadly defined bipolar schizoaffective disorder as a diagnostic concept.Br J Psychiatry2009,195:23-9. 26. Martinowich K, Schloesser RJ, Manji HK:Bipolar disorder: from genes to
behavior pathways.J Clin Invest2009,119:726-36.
27. Laje G, Allen AS, Akula N, Manji H, John Rush A, McMahon FJ:Genome-wide association study of suicidal ideation emerging during citalopram treatment of depressed outpatients.Pharmacogenet Genomics2009,19:666-74. 28. Djurovic S, Gustafsson O, Mattingsdal M, Athanasiu L, Bjella T, Tesli M,
Agartz I, Lorentzen S, Melle I, Morken G, Andreassen OA:A genome-wide association study of bipolar disorder in Norwegian individuals, followed by replication in Icelandic sample.J Affect Disord2010,126:312-6. 29. Iwamoto K, Ueda J, Bundo M, Kojima T, Kato T:Survey of the effect of genetic
30. van Winkel R, Genetic Risk and Outcome of Psychosis (GROUP) Investigators:Family-based analysis of genetic variation underlying psychosis-inducing effects of cannabis: sibling analysis and proband follow-up.Arch Gen Psychiatry2011,68:148-57.
31. Yu W, Gwinn M, Clyne M, Yesupriya A, Khoury MJ:A navigator for human genome epidemiology.Nat Genet2008,40:124-5.
32. Hindorff LA, Sethupathy P, Junkins HA, Ramos EM, Mehta JP, Collins FS, Manolio TA:Potential etiologic and functional implications of genome-wide association loci for human diseases and traits.Proc Natl Acad Sci USA2009,106:9362-7.
33. Botstein D, Risch N:Discovering genotypes underlying human phenotypes: past successes for mendelian disease, future approaches for complex disease.Nat Genet2003, ,33 Suppl:228-37.
34. Kotti S, Bickeboller H, Clerget-Darpoux F:Strategy for detecting susceptibility genes with weak or no marginal effect.Hum Hered2007,63:85-92. 35. Culverhouse R, Suarez BK, Lin J, Reich T:A perspective on epistasis: limits
of models displaying no main effect.Am J Hum Genet2002,70:461-71.
doi:10.1186/1755-8794-7-S1-S6
Cite this article as:Kwonet al.:IGENT: efficient entropy based algorithm
for genome-wide gene-gene interaction analysis.BMC Medical Genomics
20147(Suppl 1):S6.
Submit your next manuscript to BioMed Central and take full advantage of:
• Convenient online submission
• Thorough peer review
• No space constraints or color figure charges
• Immediate publication on acceptance
• Inclusion in PubMed, CAS, Scopus and Google Scholar
• Research which is freely available for redistribution