BioMed Central
BioMedical Engineering OnLine
Open Access
BioMedical Engineering OnLine2002,
1 x
Research
Cardiac arrhythmia classification using autoregressive modeling
Dingfei Ge, Narayanan Srinivasan* and Shankar M Krishnan
Address: Biomedical Engineering Research Centre Nanyang Technological University, Singapore 639798
E-mail: Dingfei Ge - [email protected]; Narayanan Srinivasan* - [email protected]; Shankar M Krishnan - [email protected] *Corresponding author
Abstract
Background: Computer-assisted arrhythmia recognition is critical for the management of cardiac disorders. Various techniques have been utilized to classify arrhythmias. Generally, these techniques classify two or three arrhythmias or have significantly large processing times. A simpler autoregressive modeling (AR) technique is proposed to classify normal sinus rhythm (NSR) and various cardiac arrhythmias including atrial premature contraction (APC), premature ventricular contraction (PVC), superventricular tachycardia (SVT), ventricular tachycardia (VT) and ventricular fibrillation (VF).
Methods: AR Modeling was performed on ECG data from normal sinus rhythm as well as various arrhythmias. The AR coefficients were computed using Burg's algorithm. The AR coefficients were classified using a generalized linear model (GLM) based algorithm in various stages.
Results: AR modeling results showed that an order of four was sufficient for modeling the ECG signals. The accuracy of detecting NSR, APC, PVC, SVT, VT and VF were 93.2% to 100% using the GLM based classification algorithm.
Conclusion: The results show that AR modeling is useful for the classification of cardiac arrhythmias, with reasonably high accuracies. Further validation of the proposed technique will yield acceptable results for clinical implementation.
Background
Automatic ECG analysis is critical for diagnosis and treat-ment of critically ill patients. Modeling and simulation of ECG under various conditions are very important in un-derstanding the functioning of the cardiovascular system as well as in the diagnosis of heart diseases. Arrhythmias represent a serious threat to the patient recovering from acute myocardial infarction, especially ventricular ar-rhythmias like ventricular tachycardia (VT) and ventricu-lar fibrillation (VF). In particuventricu-lar, VT and VF are life-threatening conditions and produce significant haemody-namic deterioration [1]. There is a need for quick
identifi-cation of these conditions. Other arrhythmias like atrial premature contraction (APC), premature ventricular con-traction (PVC) and superventricular tachycardia (SVT) are not as lethal as VF, but are important in diagnosing the disorders of the heart. The reliable detection of these ar-rhythmias constitutes a challenge for a cardiovascular di-agnostic system. Consequently, significant amount of research has focused on the development of algorithms for accurate diagnosis of ventricular arrhythmias.
Various studies have been performed to classify various cardiac arrhythmias [2–16]. A number of techniques have Published: 13 November 2002
BioMedical Engineering OnLine 2002, 1:5
Received: 8 September 2002 Accepted: 13 November 2002
This article is available from: http://www.biomedical-engineering-online.com/content/1/1/5
BioMedical Engineering OnLine 2002, 1 http://www.biomedical-engineering-online.com/content/1/1/5
been used for identification of arrhythmias including cor-rection waveform analysis [5], time-frequency analysis [7], complexity measures [13], and a total least squares-based Prony modeling algorithm [16]. Different features are extracted from the ECG for classification of ventricular arrhythmias including QRS and ST segment based values, heart rate, spectral features, AR coefficients, complexity measures and nonlinear measures [2–16].
Cardiac arrhythmias using two intracardiac channels can be detected using the correlation waveform analysis (CWA) [5]. CWA was used to detect morphologic changes in the intracardiac electrogram when compared to electro-grams during sinus rhythm. Each electrogram had its re-spective template and the templates were obtained by signal averaging the waveform from a passage of sinus rhythm. The software trigger was used to align the tem-plate with the cycle being tested. A window size of N point defined each cycle.
Methods such as direct ECG feature detection [6], Fourier transform [12], time-frequency analysis [7] and complex-ity analysis [13] have also been employed. The main ob-jective of the direct ECG feature detection was to investigate how many different ventricular conduction de-fects (VCD) categories can be formed by advanced cluster
analysis methods, which reduce the number of classifica-tion parameters into a reasonably small set for a meaning-ful classification. The second objective was to investigate to what extent a select set of repolarization parameters would help in identification of distinct VCD subgroups. The study of detection of ECG features show that the key features of ECG are QRS duration, T axis angle, T ampli-tude, QRS axis angle and spatial angle. Typically, morpho-logical features related to the P, QRS and ST waves are used for ECG signal analysis [1].
A technique based on averaged threshold crossing inter-vals was proposed for the detection of VT and VF based on heart rate measurements [4]. A modified sequential detec-tion algorithm was further proposed to improve the accu-racy of detecting VT and VF [10]. A Fourier transform based algorithm has been proposed for the detection of supraventricular rhythms from ventricular rhythms [12]. Power spectra computed from the QRS complexes extract-ed from ECG signals were classifiextract-ed using a neural net-work. High sensitivity and specificity values greater than 98% have been reported for discriminating supraventricu-lar rhythms from ventricusupraventricu-lar rhythms. However, SVT and VT were grouped together as ventricular rhythms. A new algorithm based on complexity measures was proposed for the detection of NSR, VT and VF [13]. The algorithm was tested for varying lengths of data and very high accu-racy values were achieved for data lengths of 7 sec for clas-sifying NSR, VT and VF. The algorithm was suggested for real-time implementation in automatic external defibril-lators.
Recently, a new approach for the discrimination among VF, VT and SVT has been developed using a total least squares-based Prony modeling algorithm [16]. Two fea-tures, energy fractional factor (EFF) and predominant fre-quency (PF) were derived from the total least squares based Prony model. A two-stage classification method is used in which the EFF is used for discriminating SVT from VT and VF in the first stage followed by using PF for fur-ther separation of VF and VT the second stage. A classifica-tion accuracy of 95.24%, 96.00% and 97.78% were reported for SVT, VF and VT respectively for the Prony modeling algorithm. However, the total least squares-based Prony modeling technique did not consider NSR, APC and PVC for feature extraction and discrimination.
AR modeling has been used extensively to model heart rate variability (HRV) and for power spectrum estimation of ECG and HRV signals [17–21]. Amplitude modulated sinusoidal signal model, which is a special case of the time-dependent AR model have been applied to modeling ECG signals [17]. Adaptive AR modeling with Kalman fil-tering has been used [20]. Parameters extracted from AR modeling have been used for arrhythmia classification in
Figure 1
BioMedical Engineering OnLine 2002, 1 http://www.biomedical-engineering-online.com/content/1/1/5
conjunction with other features [8]. For example, two AR coefficients, along with the mean-square value of the QRS complex segments were utilized as features for classifica-tion of normal and abnormal PVC, where the predicclassifica-tion order was only 2, a fuzzy adaptive resonance theory map-ping (ARTMAP) was used for classification. The best result of PVC correct detection were 92% under the ratios of the training data size and testing data size was 2 to 4 [8]. It has been suggested that increasing the model order would not reduce the prediction error implying that a linear predic-tor order of two is sufficient for fast cardiac arrhythmia de-tection [22].
The objective of the present study is to model the ECG sig-nal and classify certain cardiac arrhythmias at the ICU. Most of the techniques involve significant amounts of computation and processing time for extraction of fea-tures and classification. The other disadvantage is the
small number of arrhythmias classified using a given tech-nique with most techtech-niques being used to classify two to three arrhythmias [2,4–13,15,16]. There is a need for ex-tending a particular technique for a larger number of ar-rhythmias. In addition, the proposed technique should be amenable to real-time implementation so that it can be used in intensive care units.
In this study, the ECG signals were modeled using AR analysis for classifying cardiac arrhythmias. The advantage of AR modeling is its simplicity and it is suitable for real-time classification at the ICU or ambulatory monitoring. AR models are popular due to the linear form of the sys-tem of simultaneous equations involving the unknown AR model parameters and the availability of efficient algo-rithm for computing the solution [23,24]. AR modeling has been used in various applications including classifica-tion of physiological signals like electroencephalograms
Figure 2
BioMedical Engineering OnLine 2002, 1 http://www.biomedical-engineering-online.com/content/1/1/5
[25]. AR modeling is adapted for extracting good features from ECG signals, thus enabling the discrimination of cer-tain ECG arrhythmias. The computed AR coefficients were checked for modeling accuracy for the various types of ECG signals. Various pattern classification techniques have been applied to the classification of arrhythmias [3,12,14,16,26–28]. In the current study, the AR coeffi-cients computed from the ECG signals were classified us-ing a generalized linear model (GLM) [29]. Various arrhythmias including Atrial Premature Contraction (APC), Premature Ventricular Contraction (PVC), Super-ventricular Tachycardia (SVT), Ventricular Tachycardia (VT) and Ventricular Fibrillation (VF) were classified.
Methods
Preprocessing
ECG data for the analysis and classification was obtained from the MIT-BIH arrhythmia database, the MIT-BIH
Ven-tricular Arrhythmia database and the MIT-BIH supraven-tricular arrhythmia database. Various ECG segments were selected from the databases for modeling and classifica-tion. The data set included around 200 segments each of normal ECGs, APCs, PVCs, SVTs, VTs and VFs. The sam-pling frequency of the data from the MIT-BIH Arrhythmia database was 360 Hz, the sampling frequency of the data from the MIT-BIH ventricular arrhythmia database was 250 Hz and the sampling frequency of the data from the MIT-BIH supraventricular arrhythmia was 128 Hz. The data from the MIT-BIH arrhythmia and supraventricular arrhythmia databases were re-sampled so that all the data used in the analysis had a sampling frequency of 250 Hz.
Prior to modeling, the ECG signals were preprocessed to remove noise due to power line interference, respiration, muscles tremors, spikes etc., and to detect the R peaks in the ECG signals. The R peaks of ECG were detected using
Figure 3
BioMedical Engineering OnLine 2002, 1 http://www.biomedical-engineering-online.com/content/1/1/5
Tompkins's algorithm [30]. The sample size affects the segment selected for AR modeling and care must be taken to pick at least one cardiac cycle so that the signal can be accurately modeled and can be useful in diagnosis. Cardi-ac cycle length or RR intervals differ for a normal sinus rhythm and vary for different arrhythmias. A normal ECG sinus rhythm refers to the usual case in health adults where the heat rate is 60–100 beats per minutes. In APC, a RR interval is shorter than normal, and the subsequent interval is no longer than normal. In VF, the RR intervals are much shorter than in a normal sinus rhythm. In the current study, a sample size of 300 (1.2 seconds) was used which consists of one hundred samples before the R peak and 200 samples after the R peak. It is adequate to capture most if not all of the information from a particular cardiac cycle.
AR Modeling
AR analysis models the ECG signal as the output of a lin-ear system driven by white noise of zero mean and un-known variance [23,24]. AR models have the form
where v[k] is the ECG time series, n[k] is zero mean white noise, ai's are the AR coefficients, and P is the AR order.
A critical issue in AR modelling is the AR order used to model a signal. It is necessary to select an appropriate AR order so that the signal is modelled with sufficient accura-cy so as to be useful for classification. Various model or-ders were used to estimate the accuracy of the
Figure 4
BioMedical Engineering OnLine 2002, 1 http://www.biomedical-engineering-online.com/content/1/1/5
reconstructed signals. The criteria used for evaluating the model order selection in this project were the correlation coefficient ρ and the signal-to-noise (SNR) ratio. The cor-relation coefficient ρ is computed using
where v(i) and (i) are the original and the simulated signals at the ith instant, and m and are the mean of the
original and simulated signals respectively and N is the length of the modeled signal. The signal-to-noise ratio is given by
Burg's algorithm was used to estimate the AR coefficients with a pre-selected model order P[23,24].
GLM-based classification
In the current study, AR coefficients were used to classify cardiac arrhythmias. A stage-by-stage GLM based classifi-cation model has been used for classificlassifi-cation of the vari-ous cardiac arrhythmias. A GLM is given by [29]
Figure 5
A patient ECG and simulated ECG with PVC
ρ =
( )
−(
)
(
( )
−)
( )
−(
)
(
( )
−)
( )
=
= =
∑
∑
∑
v i m v i m
v i m v i m
i N
i N
i N
! !
! !
1
2 2
1 1
2
v
!
BioMedical Engineering OnLine 2002, 1 http://www.biomedical-engineering-online.com/content/1/1/5
Figure 6
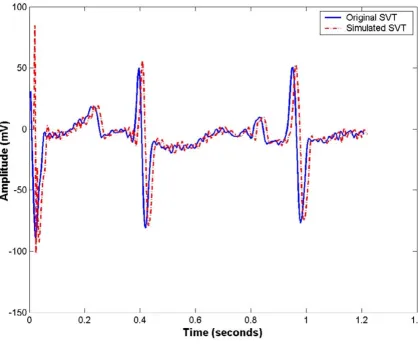
A patient ECG and simulated ECG with SVT
Table 1: Mean AR coefficients for ECG classes
Classes a(2) a(3) a(4) a(5)
NSR -2.244 1.855 -0.664 0.084
APC -2.351 1.871 -0.409 -0.089
PVC -2.238 2.112 -1.343 0.484
SVT -2.743 3.144 -1.844 0.479
VT -1.376 0.061 0.334 -0.009
BioMedical Engineering OnLine 2002, 1 http://www.biomedical-engineering-online.com/content/1/1/5
= Aβ + ∈ (4)
where = [y1,y2,...,yN]T is an N-dimensional vector of
observed responses, β = [β0, β1,...,βP]T is a P+1
dimension-al vector of unknown parameters, A is N× (P + 1) matrix of known predictors (AR coefficients) and ∈ = [∈1,∈2,...,∈N]T is an N dimensional error vector.
The least squares estimator is given by
β = (ATA)-1AT (5)
Generalized linear model based classification was per-formed in stages to differentiate between the normal ECG
signals and the various cardiac arrhythmias. The various stages of classification and groupings in every stage are shown in Fig 1. During the training phase, the estimator β was computed based on the known classes of ECG seg-ments that form the training set. The AR coefficients and the previously estimated β were used to compute the cor-rect response at a particular stage of classification during the testing phase. To perform the stage by-stage classifica-tion, Euclidean distance measure between the AR coeffi-cients of different classes was used to determine the groupings of classes at each stage. The AR coefficients [a(2),a(3),a(4),...,a(P+1)] of a particular ECG segment were mapped to a response (1 or -1) in every stage of clas-sification. In the current study, the observation matrix A = [I, A2, A3, A4,..., Ap+1] where I is an identity vector and the
column vectors A2, A3, A4,..., Ap+1 consist of AR coeffi-cients a(2), a(3), a(4),...,a(p+1) respectively of all the ECG segments selected for training. The elements of vector
Figure 7
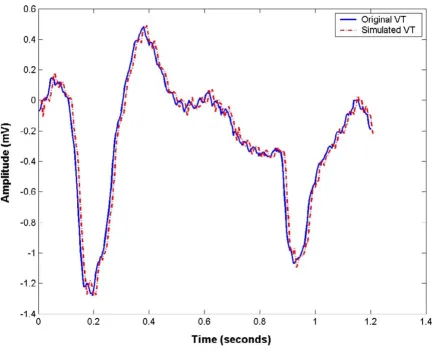
A patient ECG and simulated ECG with VT
ˆ
Y
ˆ
Y
ˆ
Y
BioMedical Engineering OnLine 2002, 1 http://www.biomedical-engineering-online.com/content/1/1/5
were assigned values 1 or -1 depending on the member-ship of an ECG segment to a corresponding class or group. The number of elements in was the number of exam-ples in the training set. The estimator β was computed at each stage of classification based on the selected training sets. During testing, the output response (Y1 in stage 1, Y2 in stage 2, etc) was computed using the AR coefficients and the previously estimated β at each stage. A threshold value of zero was used to classify the output response as belonging to a group at a particular stage. Sixty samples from each class were used for training and the remaining was used for testing in the classification phase. The train-ing sets were picked randomly and the sensitivity and spe-cificity were measured for the NSR and the arrhythmias multiple times. The sensitivity and specificity was com-puted for all the classes as given by
where TE represents the total number of events, FN repre-sents false negative, and FP represents false positive [2]. The average sensitivity and specificity values were com-puted for NSR and the cardiac arrhythmias.
Results
The AR modeling was applied to six different types of ECG signals from the MIT-BIH database. Classification was per-formed using a GLM-based classification algorithm.
Figure 8
A patient ECG and simulated ECG with VF
BioMedical Engineering OnLine 2002, 1 http://www.biomedical-engineering-online.com/content/1/1/5
AR modeling results
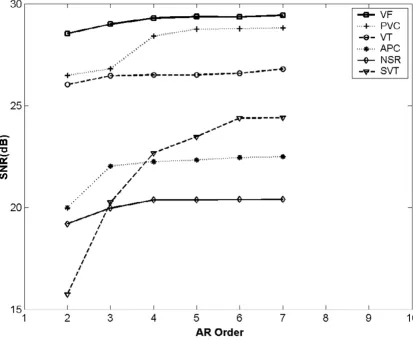
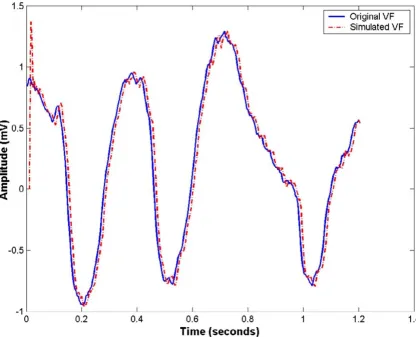
Two main criteria, SNR and ρ were used to evaluate the performance of the AR model with different model orders. The correction coefficients for all ECG signals were 0.99. The SNR was calculated to be from 15.7 dB to 29.43 dB. Figure 2 shows the variation of SNR as a function of mod-el order P. The SNR increased initially with modmod-el order P, but remains almost constant for model orders greater than or equal to four. In addition, computing the AR coeffi-cients of higher orders would increase the number of com-putations. Hence, AR model of order four was used for further classification. The parameters computed using this model order were good enough to achieve a good SNR and correlation coefficient ρ and were found to be sensi-tive enough to differentiate the five types of ECG signals. The original NSR, APC, PVC, SVT, VT and VF segments as well as the modeled segments are shown in Figs 3,4,5,6,7 and 8.
The results were consistent with other studies on the selec-tion of model order for AR modeling [22]. AR modeling has been used for compression and it has been found that increase in accuracy by increasing the order of the predic-tor is negligible for predicpredic-tors of order higher than 3 [22].
The mean AR coefficients for all the ECG types used in the current study are shown in Table 1.
Classification results
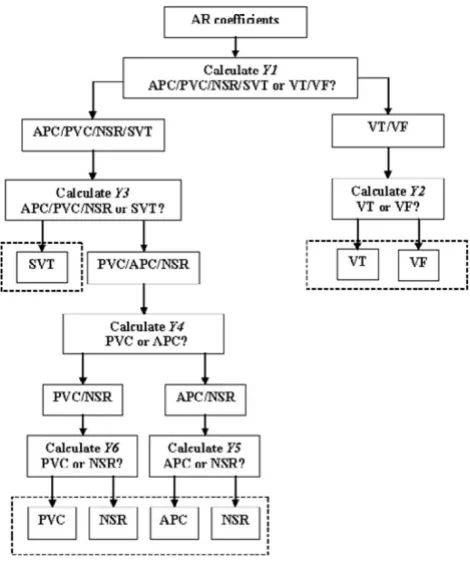
AR coefficients computed with order four were used for classification. Six types of ECG signals namely, NSR, APC, PVC, SVT, VT, and VF were considered for classification. Classification was performed using a generalized model linear model, which was applied in various stages. Figure 1 shows the stage-by-stage GLM-based classification algo-rithm for classifying various ECG signals. The six classes were separated into two groups with Normal, APC, PVC, and SVT signals forming one group and VT and VF form-ing another group at stage one. This groupform-ing was evident by computing the Euclidean distance between the mean AR coefficients from various classes. The Euclidean dis-tance between classes VF and VT was small. Similarly, the Euclidean distance among classes Normal, APC, PVC and SVT was small. The distance between VF/VT and Normal/ APC/PVC/SVT was large and hence in the first stage, class-es VT and VF were grouped together. The other group con-sisted of classes Normal, APC, PVC and SVT. In the second stage, VT and VT were differentiated. Stages three, four, five and six were used to differentiate between NSR, APC, PVC and SVT as shown in Fig 1.
The least squares estimator β was computed for various stages and the value Y was used to determine the classes in each stage. In the first stage (Y1), the AR coefficients from an ECG signal was separated into two groups, one consist-ing of NSR, APC, PVC and SVT and the other consistconsist-ing of VT and VF. In the second stage (Y2), VT and VF were dif-ferentiated. In the third stage (Y3), SVT was distinguished from NSR, APC and PVC. In the later stages (Y4, Y5 and
Y6), NSR, APV and PVC were distinguished from each other and classified.
Table 2: GLM-based classification results for a sample training set
Testing data set Database Classification Resulting Classification
Classes NSR APC PVC SVT VT VF
143 NSR 133 6 4 0 0 0
140 APC 4 136 0 0 0 0
155 PVC 3 0 147 5 0 0
133 SVT 0 0 0 133 0 0
143 VT 0 0 0 0 140 3
142 VF 0 0 0 0 2 140
Table 3: Performance of GLM-based arrhythmia classification
Classes Sensitivity Specificity
NSR 93.2% 94.4%
APC 96.4% 96.7%
PVC 94.8% 96.8%
SVT 100% 96.2%
VT 97.7% 98.6%
BioMedical Engineering OnLine 2002, 1 http://www.biomedical-engineering-online.com/content/1/1/5
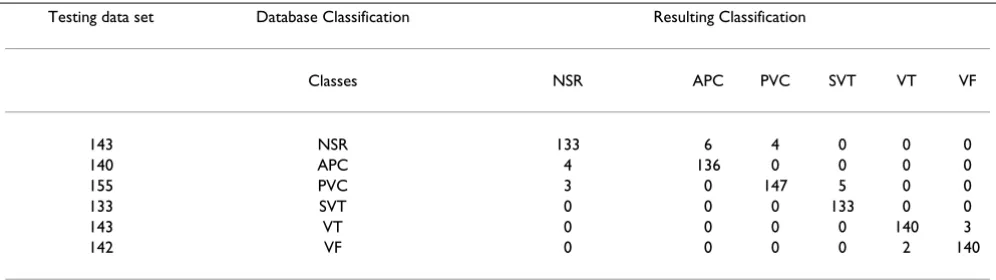
The GLM was tested with 143 NSRs, 140 APCs, 155 PVCs, 143 VTs, 142 VFs, and 133 SVTs, which were obtained from the data sets by excluding the training data for each class. The sensitivity and specificity values were computed for all the ECG classes. The results of the GLM based clas-sification are shown in Tables 2 and 3. The results for a sample training set are shown in Table 2 and the mean classification sensitivity and specificity for various classes are shown in Table 3. The accuracy of detecting NSR, APC, PVC, SVT, VT and VF were 93.2%, 96.4%, 94.8%, 100%, 97.7%, and 98.6% respectively.
Discussion
Different values of AR modeling orders were tested for the ECG signals and the results showed that AR order of four is sufficient to model the ECG signal for the purpose of classification of selected arrhythmias. AR coefficients were used to classify the ECG beats into normal and five select-ed abnormal conditions. A stage-by-stage generalizselect-ed lin-ear model classification algorithm was used to distinguish between the different types of arrhythmias under consid-eration in the current study.
The classification results show that AR modeling can be used to discriminate between different arrhythmias. The classification results achieved using AR modeling is com-parable to the recently published results on the classifica-tion of cardiac arrhythmias [8–16]. Normal and abnormal PVC conditions have been classified using LPC coeffi-cients classified using a fuzzy ARTMAP classifier with sen-sitivity of 97% and specificity of 99% [8]. Accuracy of 93% and 96% has been reported for VT and VF respectively us-ing a modified sequential probability ratio test algorithm [10]. An overall accuracy of 93% to 99% was achieved with decimated ECG data and artificial neural networks [14]. However, the data set consisted of a high number of NSR and PVC beats and the performance of beats includ-ing atrial premature beats was not very high. The total least squares-based Prony modeling technique produced an accuracy of 95.24%, 96% and 97.78% for SVT, VT and VF respectively [16].
AR modeling based classification algorithm has demon-strated good performance in classification. The algorithms are easy to implement and the AR coefficients can be eas-ily computed. Preprocessing involves the detection of R peaks for which a number of techniques are available that can be implemented for real-time processing. A detailed comparison of computation times has not been per-formed; however, it is noted that computing the AR coef-ficients is simpler than most proposed measures for arrhythmia recognition. In addition, the computations were performed for 1.2 seconds of data only compared to 3 to 7 seconds for the complexity measures based
nique [13] and 5 to 9 seconds in the Prony modeling tech-nique [16].
Some of the proposed techniques use only a smaller number of arrhythmias (2–3) than the current study [2,4– 13,15,16]. The fuzzy ARTMAP technique has been used to classify normal and abnormal PVC conditions only [8]. A time sequenced adaptive filter has been proposed for VT and VF alone [9]. A real time discrimination algorithm with a Fourier-transform neural network has been has been proposed to distinguish between superventricular rhythms and ventricular rhythms in which PVC and VT were lumped together as belonging to a single class of ven-tricular rhythms [12]. The complexity measure-based technique has been used to classify NSR, VT and VF [13]. A QRS feature based-algorithm for decimated ECG data using artificial neural networks has been proposed that in-clude various types of beats including APC and PVC, but they do not include the life threatening conditions like VT and VF [14]. The Prony modeling technique has been used to classify SVT, VT and VF but their study does not in-clude episodes from normal, APC or PVC [16]. The cur-rent study classifies six diffecur-rent ECG classes and the performance is comparable to those studies that involve fewer classes.
In the current study, a fixed sample size has been used for AR modeling. A variable sample size based on the estima-tion of the R-R interval might yield better results inde-pendent of the heart rate of the subjects. The generalization capabilities of the AR model and the classi-fication algorithms can be refined by applying the pro-posed approach to a larger data set. Further work is in progress to extend the proposed approach for classifica-tion of other types of cardiac arrhythmias as well as apply-ing it to other signals of the cardiovascular system such as the hemodynamic signals, particularly for real-time appli-cations. AR modeling is a linear modeling technique and might not necessarily be suitable for ECG signals under all conditions. Further work can be done to extend the cur-rent work to nonlinear parametric models that can better capture the non-linear and non-stationary nature of the ECG.
In addition to their utility in classification and diagnosis, AR coefficients can also be used for compression. AR mod-eling can lead to a low cost, high performance, simple to use portable telemedicine system for ECG offering a com-bination of diagnostic capability with compression.
Conclusions
BioMedical Engineering OnLine 2002, 1 http://www.biomedical-engineering-online.com/content/1/1/5
are suitable for real-time implementations and can be used for compression as well as diagnosis.
Authors' contributions
DG carried out the analysis and implementation as well as testing of the software simulations. NS participated in the design and coordination of the study and testing of the software simulations. SMK conceived of the study and participated in its design and coordination.
All authors read and approved the final manuscript.
References
1. Goldschlager N, Goldman MJ: Principles of Clinical Electrocardi-ography.Appleton and Lange 1989
2. Barro S, Ruiz R, Cabello D, Mira J: Algorithmic sequential deci-sion-making in the frequency domain for life threatening ventricular arrhythmias and imitative artefacts: a diagnostic system.J Biomed Eng 1989, 11:320-328
3. Coast DA, Stren RM, Cano GG, Briller SA: An approach to cardi-ac arrhythmia analysis using hidden Markov models. IEEE Trans Biomed Eng 1990, 37:826-836
4. Thakor NV, Zhu YS, Pan KY: Ventricular tachycardia and fibril-lation detection by a sequential hypothesis testing algo-rithm.IEEE Trans Biomed Eng 1990, 37:837-843
5. Caswell SA, Kluge KS, Chiang CMJ: Pattern recognition of cardi-ac arrhythmias using two intrcardi-acardicardi-ac channels. Proc Comp Cardiol 1993, 181-184
6. Zhou SH, Rautaharju PM, Calhoun HP: Selection of a reduced set of parameters for classification of ventricular conduction de-fects by cluster analysis.Proc Comp Cardiol 1993, 879-882 7. Afonoso VX, Tompkins WJ: Detecting ventricular fibrillation:
Selecting the appropriate time-frequency analysis tool for the application.IEEE Eng Med Biol Mag 1995, 14:152-159 8. Ham FM, Han S: Classification of cardiac arrhythmias using
fuzzy ARTMAP.IEEE Trans Biomed Eng 1996, 43:425-430 9. Finelli CJ: The time-sequenced adaptive filter for analysis of
cardiac arrhythmias in intraventricular electrograms.IEEE Trans Biomed Eng 1996, 43:811-819
10. Chen SW, Clarkson PM, Fan Q: A robust sequential detection al-gorithm for cardiac arrhythmia classification.IEEE Trans Bi-omed Eng 1996, 43:1120-1125
11. Guvenir HA, Acar B, Demiroz G, Cekin A: A supervised learning algorithm for arrhythmia analysis.Comp Cardiol 1997, 24: 433-436
12. Minami KC, Nakajima H, Toyoshima T: Real-time discrimination of ventricular tachyarrythmia with Fourier-transform neural network.IEEE Trans Biomed Eng 1999, 46:179-185
13. Xu SZ, Yi SZ, Thakor NV, Wang ZZ: Detecting ventricular tach-ycardia and fibrillation by complexity measure.IEEE Trans Bi-omed Eng 1999, 46:548-555
14. Melo SL, Caloba LP, Nadal J: Arrhythmia analysis using artificial neural network and decimated electrocardiographic data.
Comp Cardiol 2000, 27:73-76
15. Small M, Yu DJ, Grubb N, Simonotto J, Fox KAA, Harrison RG: Au-tomatic identification and recording of cardiac arrhythmia.
Comp Cardiol 2000, 27:355-358
16. Chen SW: Two-stage discrimination of cardiac arrhythmias using a total least squares-based prony modeling algorithm.
IEEE Trans Biomed Eng 2000, 47:1317-1326
17. Mukhopadhyay S, Sircar P: Parametric modelling of ECG signal.
Med Biol Eng Comp 1996, 34:171-173
18. Pinna GD, Maestri R, Cesare AD: Application of time series spec-tral analysis theory: analysis of cardiovascular variability sig-nals.Med Biol Eng Comp 1996, 34:142-148
19. Bennett FM, Chrisstini DJ, Ahmed H, Lutchen K: Time series mod-eling of heart rate dynamics.Proc Comp Cardiol 1993, 273-276 20. Arnold M, Miltner WHR, Witte H: Adaptive AR modeling of
non-stationary time series by means of Kalman filtering.IEEE Trans Biomed Eng 1998, 45:553-562
21. Mainardi LT, Bianchi AM, Baselli G, Cerutti S: Pole-tracking algo-rithms for the extraction of time-variant heart rate variabil-ity spectral parameters.IEEE Trans Biomed Eng 1995, 42:250-258 22. Lin KP, Chang WH: QRS feature extraction using linear
predic-tion.IEEE Trans Biomed Eng 1989, 36:1050-1055
23. Marple SL: Digital spectral analysis with applications.Prentice Hall, Englewood Cliffs, New Jersey 1987
24. Ljung L: System Identification: Theory for the user.Prentice Hall, Englewood Cliffs, New Jersey, 1999
25. Anderson CW, Stolz EA, Shamssunder S: Multivariate autoregres-sive models for classification of spontaneous electroen-cephalographic signals during mental tasks.IEEE Trans Biomed Eng 1998, 45:277-286
26. Miller AS, Blott BH, Hames TK: Review of neural network appli-cations in medical imaging and signal processing.Med Biol Eng Comp 1992, 30:449-464
27. Ramirez-Rodriguez CA, Hernandez-Silveira MA: Multi-thread im-plementation of a fuzzy neural network for automatic ECG arrhythmia detection.Comp Cardiol 2001, 28:297-300
28. Silipo R, Marchesi C: Artificial neural networks for automatic ECG analysis.IEEE Trans Sig proc 1998, 46:1417-1425
29. McCullagh P, Nelder JA: Generalized Linear Model.Chapman and Hall, London, 1989
30. Tompkins W: Biomedical Digital Signal Processing.Prentice Hall, Englewood Cliffs, New Jersey 1993
Publish with BioMed Central and every scientist can read your work free of charge "BioMed Central will be the most significant development for disseminating the results of biomedical researc h in our lifetime."
Sir Paul Nurse, Cancer Research UK
Your research papers will be:
available free of charge to the entire biomedical community
peer reviewed and published immediately upon acceptance
cited in PubMed and archived on PubMed Central
yours — you keep the copyright
Submit your manuscript here:
http://www.biomedcentral.com/info/publishing_adv.asp