BioMedCentral
BioMedical Engineering OnLine
Open Access
Review
Physiological basis and image processing in functional magnetic
resonance imaging: Neuronal and motor activity in brain
Rakesh Sharma*
1and Avdhesh Sharma
2,3Address: 1Departments of Medicine and Radiology, Columbia University, New York, NY 10032 U.S.A, 2Department of Electrical Engineering, Indian Institute of Technology, New Delhi 110016 India and 3Department of Electrical Engineering, Jai Narain Vyas University, Jodhpur Rajasthan 342001, India
Email: Rakesh Sharma* - [email protected]; Avdhesh Sharma - [email protected] * Corresponding author
Functional magnetic resonance imagingimage processingsegmentation, registrationvisual activitymotor activityneurophysiological activity
Abstract
Functional magnetic resonance imaging (fMRI) is recently developing as imaging modality used for mapping hemodynamics of neuronal and motor event related tissue blood oxygen level dependence (BOLD) in terms of brain activation. Image processing is performed by segmentation and registration methods. Segmentation algorithms provide brain surface-based analysis, automated anatomical labeling of cortical fields in magnetic resonance data sets based on oxygen metabolic state. Registration algorithms provide geometric features using two or more imaging modalities to assure clinically useful neuronal and motor information of brain activation. This review article summarizes the physiological basis of fMRI signal, its origin, contrast enhancement, physical factors, anatomical labeling by segmentation, registration approaches with examples of visual and motor activity in brain. Latest developments are reviewed for clinical applications of fMRI along with other different neurophysiological and imaging modalities.
Introduction
Recent investigations focused on specific brain regional and functional specificity to delineate the specific distri-bution of neural activities at a given moment in the brain as a whole. Functional magnetic resonance imaging (fMRI) was introduced to map the changes in brain local blood flow and oxygenation or hemodynamics that corre-spond to regional neuronal activity of brain accompany-ing metabolic events. It extended brain anatomical imaging to map structures and specific function of human brain. High resolution, noninvasive neural activity by a blood oxygen level dependent signal has tremendous potentials for assessing the neurological status and neuro-surgical risk [1-4]. Later fMRI applications extended the
understanding of neuronal and motor activities associ-ated with different brain regional functions. Presently, fMRI serves as non-invasive imaging of neurophysiologi-cal activities of brain that depend more on physiologineurophysiologi-cal characteristics of brain.
The paper reviews the physiological basis of fMRI signal origin and contrast mechanisms with state-of-art fMRI segmentation and registration algorithms to identify cor-tical visual response and event related corcor-tical areas asso-ciated with neurophysiological measurements and potential image post-processing directions in future.
Published: 05 May 2004
BioMedical Engineering OnLine 2004, 3:13
Received: 12 January 2004 Accepted: 05 May 2004
This article is available from: http://www.biomedical-engineering-online.com/content/3/1/13
Historically, these observations initially were supported by reports on local reduction in deoxyhemoglobin due to increased blood flow without change in oxygen extraction [5]. Deoxyhemoglobin acts as paramagnetic endogenous contrast agent and alters the T2* weighted magnetic reso-nance image signal [6-9] and serves as the source of the signal for fMRI. Last decade was an excitement for clinical application of 1.5 T-7.0 T clinical scanners to observe functional activity of visual cortex [12-16], the motor cor-tex [18-21] and Broca's area of speech and language-related activities [20,21]. fMRI and conventional neuro-physiological techniques have been in use to localize the specific functions of the human brain [22-27].
Increased neuronal activity needs the metabolic support. For that, blood flow provides the substrates. Still there is paucity in information of metabolic requirements and hemodynamic response in different brain functions. Recent trend was focused on identification of brain regions involved with characteristic oxygenation-sensitive MRI response function.
The visual response function
The oxygen concentration in brain serves as a tool to map cortical regions responsible for performing various cogni-tive tasks because oxygenation level in accogni-tive cortex changes between baseline and tasking conditions i.e. pat-tered lights protocols affect the spatiotemporal response and characteristics in the visual system. These visual stim-ulations generate the signal rise due to differences between tonic and phasic MRI hemodynamic responses after the onset of activation i.e. rapid rise in BOLD response due to rapid increase in the blood flow or enhanced oxygen delivery / oxygen consumption. Recently, the delayed upregulation of oxidative glucose consumption in brain and a slow venous blood volume (balloon model) suggested them as two processes. These were relevant for fMRI mapping studies with shorter pro-tocol timings [28]. The link between neuronal activity and blood flow characteristics forms the basis for functional mapping using fMRI. These characteristics such as cerebral blood flow (CBF), cerebral volume (CBV), metabolic regional oxygen (CMRO2), and BOLD signal form an
a region. The rate of oxygen inflow is proportional to cer-ebrovascular blood rate (CBR). During functional brain activation, increased CBF produces a washout of Hbr as contrast agent by counteracting the effect of increased CMRO2. Local blood volume fraction determines the deoxyhemoglobin content of a voxel at any level of blood oxygenation. As blood vessels swell, magnetic fields extend further into the tissue, causing a signal loss in the extravascular space. BOLD contrast can be approximated as changes in the BOLD relaxation rate scale with changes in the deoxy hemoglobin concentrations i.e. BOLD con-trast (X) = K.A [Hbr], where 'x' depends upon the magnetic
field strength and the sample volume.
A BOLD framework is based upon conservation of oxygen mass (Fick's Law) i.e. at the steady-state, unidirectional extraction of oxygen from the blood is the difference between the 'flow' of oxygen 'into' and 'out' of the vol-ume, FO2IN -, F
O2OUT = dV/dt. The resulting expression
takes a form like the following:
∆R2 = -K [Hbr]o{∆F/Fo - ∆V/Vo - ∆M/Mo} (1)
F, V, and M refer to CBF, CBV, and CMR02 respectively. Subscript "o" indicates baseline values prior to stimula-tion. BOLD signal changes are positive when the quantity in brackets is positive. Positive stimulus-induced BOLD represent the relative changes in CBF that exceed over combined effect of changes in CBV and CMR02. [Hbr]o is proportional to V and Mo and inversely proportional to F as shown in Figure 1 that combine to generate BOLD sig-nal. Equation (1) stands good for small functional changes while intravascular signal contributions affect the linear relationship between ∆R2, and ∆[Hbr] dependence on blood oxygen and blood volume. The term ∆V/Vo is relative change in total venous hemoglobin.
BioMedical Engineering OnLine 2004, 3 http://www.biomedical-engineering-online.com/content/3/1/13
across systems and BOLD stimuli poorly represent the coupling.
CBF and CMRO2
Regional basal cerebral oxygen and glucose utilization show a molar ratio consistently less than 6(CMRO2/
CMR-glu - 5.5), suggesting that the oxidative glucose metabolism
(C6H1206 + 6 O2 + 6H20 + 6C02) is the primary source of
energy. Tight linear couplings have been shown for regional basal measurements of CBF versus CMRglu and CBF versus CMR02 [29].
Stimulus-induced activation
Blood oxygen is delivered to the brain by diffusion along an oxygen concentration gradient that falls in the tissue. Brain has low oxygen reserves so blood flow increases the oxygen delivery (temporal resolution) resulting with reduced blood transit time through the capillaries' decreased oxygen 'extraction fraction' or restricted
capil-lary area and vascular resistance at the local level. So, the regional trajectories represent the temporal physiological quantities determined from the baseline or average state i.e. the diffusion and regional coupling of CBF and CMRO2 match during brain activation. The current view-point of CBF-CMR02 coupling and regional relationship with rate of oxygen delivery explained the events during brain activation by Buxton-Frank diffusion-limited model of oxygen delivery [30]. The exact scaling between relative changes in blood flow (f) = F/Fd and relative changes in oxygen delivery (M) depend upon the baseline value of the extraction fraction (Eo)and extent of capillary dilation as:
(v) = V / Vo (2)
M = f (1 - (l - Eo)v/f)/ E o (3)
Figure represents the "Oxygen oversupply" hypothesis
Figure 1
Cerebral vascular resistance is defined as the total pressure drop across a vascular bed. In the brain, intravascular pres-sure drops from mean arterial blood prespres-sure in large arteries to venous pressure in the large veins. The brain activation increases CBF by reducing cerebral vascular resistance corresponding to an increase in CBV. Blood flow and blood volume both exhibit different temporal responses [32]. However, the basal blood level of deoxy-genated hemoglobin is determined by the ratio of CMR02
to CBF. Neurophysiological changes in fMRI alter BOLD signal by resetting the ratio of basal CMR02 to CBF, and altering CBV [33].
Sensitivity of fMRI signal
Blood volume fraction, oxygen extraction fraction, distri-bution of vessels, arterial oxygenation neurophysiological factors and intravascular or extravascular signals depend upon the pulse sequence, field strength, degree of activa-tion and the physiology of the funcactiva-tional variable etc. Sensitivity is the product of the relative change in brain 'activation' (flow, volume, oxygenation, etc.) and 'ampli-fication' factor expressing the intrinsic sensitivity per unit change:
Sensitivity = (activation) × (amplification) (4)
The amplification factor applies spatial resolution to the pattern of brain activation but it is independent of the degree of activation [32]. For detecting changes in local brain functional activity, fMRI signal-to-noise ratio (fSNR) refers to the time-averaged value of signal divided by the temporal standard deviation of the signal: fSNR = St/σt.
Similarly, contrast for fMRI or functional CNR per unit time (fCNR) may be expressed as the ratio of time dependent signal changes (δS) to time-dependent noise: fCNR = δSt /σt, fSNR × δSt/St (5)
Basic functional MRI sequences and functional MRI contrast
FLASH or single-shot EPI sequences with prolonged echo times are employed depending on the desired spatial or
encoding, as it dominates the image contrast. Basic emphasis is on high speed yield and image acquisition times of the order of 100 ms and excellent maximum vol-ume coverage by multi-slice fMRI imaging at the expense of limited in-plane resolution.
In contrast, FLASH sequences require multiple RF excita-tions with low flip angles < 90° that normally generate only a single gradient echo per repetition interval. As large TE values also prolong the repetition time, typical imaging times are in the range of several seconds. The ability to select an arbitrary compromise between temporal and spatial resolution is best exploited for gaining access to high-resolution maps at the expense of less volume cover-age. However, EPI images also suffer from several una-voidable artifacts.
Neurophysiological factors in functional MR
contrast
BioMedical Engineering OnLine 2004, 3 http://www.biomedical-engineering-online.com/content/3/1/13
A basic EPI sequence FLASH (top) and single-shot EPI Sequence (bottom) for functional Imaging is shown with reversible read-ing gradients and pulses to generate rapid images in less than a minute
Figure 2
Validation and physical factors in Functional MRI
BOLD and fMRI characteristics are important determi-nants in validation process of ultrafast fMRI image acqui-sition of raw data and 'task to functional map' correlation by postprocessing and statistical analysis. We describe these concepts that validate brain activation, fMRI spatial resolution and BOLD events. 'Brain activation' is read as 'statistically significant pixel intensity changes' associated with a given set of tasks to denote the area of neuronal activation. It is a scalar number given by MRI system upon completion of image reconstruction including magnetic correction and other inherent factors. MRI spatial resolu-tion is low in the range of 4 mm3 on high field MR
scan-ners. BOLD events are neuronal events. T2* contrast changes seen in fMRI are an empirically observed biolog-ical phenomenon. For fMRI, T2* contrast is 'weak' suscep-tibility effect of deoxy-hemoglobin (deoxy-Hb).
Susceptibility effects and T2* contrast
In MRI, regional field inhomogeneity is common due to high paramagnetic susceptibility, ferromagnetic suscepti-bility and air sinuses, Bo inhomogeneity. The susceptibil-ity effect may affect a large area of the image matrix and can introduce image deformity. The smaller susceptibility effects introduce the pixel intensity changes in nearby pix-els generating the T2 * contrast. This is the basis of fMRI that represents a 'statistical' method based on pixel inten-sity changes in the brain placed in high magnetic field B.
Magnet shimming
MRI is performed grossly by using high order gradient 1st
and 2nd order shim coils to correct Bo inhomogeneity.
Human brain undergoes the continuous motion and hard to shim i.e. the line width of human brain is 200–400 Hz. Slice thickness and slab size over that focused shimming reduces the inhomogeneity. Fast spin echo (FSE) images
are insensitive but echo planar images (EPI) are sensitive to inhomogeneity. In fMRI, selective excitation selects the appropriate slice thickness with appropriate inter slice gap between the slices.
Nyquist ghost
The unique k-space trajectory of the EPI sequence results in the appearance of a characteristic artifact termed 'Nyquist ghost'. However, in practice the most common cause of Nyquist ghost is minor field perturbation as shown in Figure 3. Nyquist ghost represents the fictitious activation encountered in fMRI. Direct adaptation of such paradigms to fMRI typically introduces task-correlated Nyquist ghost and fictitious activation.
Pixel misalignment and limitation of spatial resolution
Pixel misalignment causes the fictitious activation due to subject motion as shown in Figure 4. Many "motion cor-rection" post-processing algorithms have been developed based on the two-dimensional imaging and three-dimen-sional misalignments. The theoretical limit of the spatial resolution for fMRI is approximately 4 mm3. fMRI image
of the normal brain can be used to evaluate the relative intensity of cerebral cortex at various sites relative to CSF as shown in Figure 4. The substantial variation in the intensity of cortex is primarily due to the partial volume phenomenon as shown in Figure 5. The correction algo-rithms such as 're-slicing', 'standardization', or 'motion correction' image-processing methods as shown in Figure 6 have been reported [37]. Basically, each raw image data is used for statistical analysis. In the following description, some representative examples of application of these physiological principles of fMRI are illustrated.
the figure represents Nyquist ghost in panel A and representative fictitious activation in panel B
Figure 3
BioMedical Engineering OnLine 2004, 3 http://www.biomedical-engineering-online.com/content/3/1/13
Functional MRI signal of motor and visual
stimulation
Two examples of fMRI experiments of motor and visual stimulation are described.
Visual Stimulation and fMRI
The typical BOLD time course (shown in black) shows 4 'active' states and 4 'resting' states are shown in Figure 7. With prior knowledge of the activation timing (shown in red), a statistical test is performed on the data to deter-mine active areas of the brain. In brief, MP-RAGE (mag-netization prepared, rapid acquisition gradient echo) sequence generates a 3D anatomic image of the head and brain. fMRI is performed with T2*-weighted gradient recalled EPI. The visual stimuli are created on a visual stimulus generator graphics card. The stimuli are pre-sented dichoptically using polar filters and adjustable right-angle prisms for optical superimposition of the right and left image are shown in Figure 7. The stimuli appear as 'radial checkerboards', in which the high-luminance contrast checks exchanged position as a sinusoidal func-tion of time. During rest (baseline) periods, subjects view a small black fixation mark superimposed onto a homogeneous field. The experimental paradigms contain five different epochs: Alternating monocular stimulation
[A]; Simultaneous binocular stimulation [B]; left eye lead-ing-right eye trailing [LR]; Right eye leading-left eye trail-ing [RL]; and baseline. Each rest epoch is followed by one of the described epochs of checkerboard stimulation. The complete sequence of one repetition is shown in Figures 7 and 8. In a recent report, BOLD contrast in visual cortex related to binocular interactions in primary visual cortex could be revealed by fMRI at high field 4 T MRI. Binocular and monocular stimulations were characteristic of high contrast radial checkerboard pattern-stimulated neurons tuned to high and low spatial frequencies. The different striate cells in ocular dominance columns interacted when they are simultaneously activated and reduced by binocu-lar or monocubinocu-lar stimulation resulting with increased BOLD response [37]. However, binocular rivalry due to disparity appears as a source of error. Fixation of eye and maintaining it throughout scan period reduces the dispar-ity which otherwise is commonly observed in area V3 by random-dot stereogram.
The figure represents fictitious activation due to pixel misalignment
Figure 4
The figure represents fictitious activation due to pixel mis-alignment. The bright spots around the bottom brain surface are misaligned that create illusion of active areas shown in yellow color.
An example of an fMRI image of the normal brain is shown
Figure 5
An example of an fMRI image of the normal brain is shown. The numbers indicate the relative intensity of cerebral cor-tex at various sites relative to CSF which assigned a value of 100 (written in red). The substantial variation in the intensity of cortex is primarily due to the 'partial volume'
fMRI activation in primary motor and pre-motor
regions
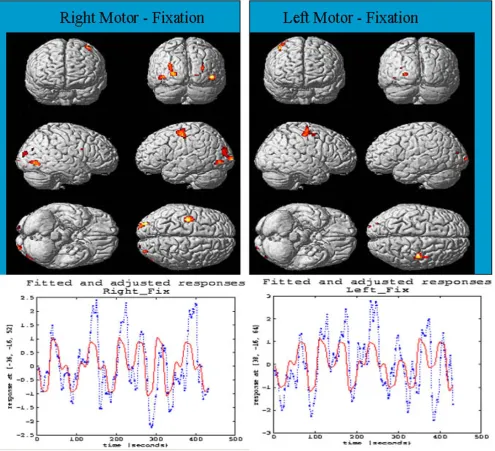
Paralyzed patient retains the motor control. fMRI shows the activation in primary motor and premotor regions. An example is illustrated here for event-related finger tapping fMRI image acquisition and analysis. Right-handed sub-jects paralysed with eye blinking and restricted mouth movement with intact cognition were imaged by fMRI sin-gle-shot gradient recalled echo-planar imaging pulse sequence. Patients were simulated for the action of tap-ping fingers 'stimulus paradigm' as shown in Figure 9.
Multiple regressions were applied to do statistical data analysis. Individual variables included 'box-car activation paradigm' and constants for activation signals. A ramp-regressor was used to remove linear-drift in the signal. Standard deviated Z-score map was superimposed on high-resolution anatomical image to display brain activa-tion areas. Time course signal in each voxel was obtained to reveal hemodynamic response to the stimulus para-digm. The regions of activation were mainly in contralat-eral to the primary motor area (M1) and premotor regions (PM) in right motor cortex with little activation in
The figure illustrates the effects of motion correction algorithm SPM 96
Figure 6
BioMedical Engineering OnLine 2004, 3 http://www.biomedical-engineering-online.com/content/3/1/13
supplementary motor area (SMA). However, ipsilateral activation in premotor (PM) area of left motor cortex was also observed. The time series of functional MRI signals from the voxel in labeled areas (see Figure 9). The time series corresponded with activation paradigm suggesting time-course on-off binary fMRI signal by simulated motor task due to neuronal or cognition activity. It suggested the
association of motor cortex, somatosensory cortex and visual cortex with cerebellum through pontine nuclei dur-ing its motor activity and rCBF increases.
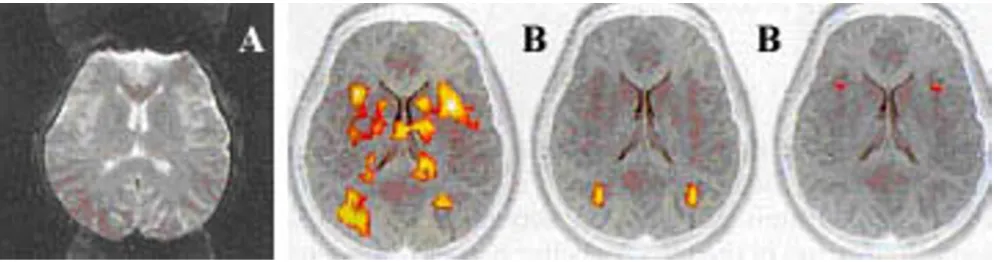
3D motion paradigm subtractive approach
It generates activation fMRI maps significant for evalua-tion of symmetry of activaevalua-tion in the frontal lobes. The
Time course of activation for the four stimulus epochs (B binocular, M monocular RL right eye stimulated first, followed by left eye stimulation, LR left eye stimulation first, followed by right eye stimulation)(left panel)
Figure 7
cerebrum cortex is not motion physiology sensitive (see Figure 11) but cerebellum cortex is motion physiology sensitive so pixel intensity changes represent its true acti-vation maps as shown in Figure 12. However, paradigm independent structures with high susceptibility effects, partial volume effect become apparent on simultaneously
FSE and EPI images as shown in Figure 13. Common examples are air sinuses, air spaces, and ferromagnetic substrates. It is the reason coronal images are not acquired for fMRI imaging but axial images show specific task-related activation areas.
Selected brain regions showing the activation areas observed by fMRI during finger movement
Figure 8
BioMedical Engineering OnLine 2004, 3 http://www.biomedical-engineering-online.com/content/3/1/13
Image processing principles
We mainly describe two segmentation and registration methods for fMRI image processing and their applications.
Segmentation
The segmentation task in fMRI is performed by recogni-tion and distinguishing brain areas that respond to a given task or stimulus with high specificity and sensitivity. Two
methods 'Bayesian approach' and 'General Linear Model' are common for computation of statistical parameter maps (SPM). The detection of brain activation due to an input stimulus is segmented by statistically comparing images acquired during stimulation (ON state) and those acquired when brain is at rest (OFF state). The results of comparison are expressed by test statistics for each brain voxel in terms of 'likelihood' or 'significant activation' of voxel by the stimulus. Whole brain voxels' likelihood
Time course of activation for the four stimulus epochs (B binocular, M monocular RL right eye stimulated first, followed by left eye stimulation, LR left eye stimulation first, followed by right eye stimulation)(left panel)
Figure 9
generates SPM map. SPM is an image in which image intensity values represent statistics obtained under null hypothesis of no activation and conform to a certain probability distribution.
'Thresholding' technique using SPM at a significant value can detect brain activation and spatial correlation using 'Gaussian random fields' (GRF) for multivariate Gaussian
distribution. This GRF performs the spatial filtering of functional images to minimize pseudo-active brain regions. Alternatively, binary 'Markov random fields' (MRF) models for activation patterns suggested the inten-sity distribution of SPMs and Bayesian modeling of fMRI time-series inferred the hidden psychological states in fMRI experiments using 'likelihoods' of activation proba-bilities from these SPMs as shown in Figure 14.
Selected brain regions showing the activation areas observed by fMRI during finger movement
Figure 10
BioMedical Engineering OnLine 2004, 3 http://www.biomedical-engineering-online.com/content/3/1/13
Bayesian approach
A functional brain image is a spatio-temporal signal from brain serial scans taken over time. The posterior probabil-ity (Gaussian conditional covariance ηθ/y, where (p(θ/y) is
proportional to the obtained data depending on times of prior probability of θ as: p(θ/y) αp(y/θ) p(θ). The Guass-Markov estimator may be presented as:
ηθ/y = (XT Cε-1X)-1(XTCε- 1y) (6)
First, preprocessing of images is done and then detection of brain activation analysis is performed [38]. For it, the set of brain voxels is identified from image domain, and the brain scans are corrected for baseline intensity varia-tion and person's head movaria-tion. In next step, derivavaria-tion of SPMs and their statistical analysis by GLM, detects regions of significant activation.
F contrasts
Event-related conditions for motor responses are inter-preted as hemodynamic response function (HRF) to gen-erate SPM 't' maps as shown in Figure 8. Using design matrix Xo for 'right motor response' regressors look for
variance of residuals. The 'F' test computes the sum of squares of "right hand regressors" as following:
with ν1 = tr[(Ro - R)Σi] and ν2 = tr(R Σi); df1 = tr [Ro - R) Σi (Ro - R) Σi /tr(Ro - R) Σi]2 and df2 = tr [R Σi R Σi /tr(R Σi]2
Where Ro is projector onto residual space of xo, and Px is orthogonal projector onto X. The 'F' contrasts are one-dimensional, in which case 'F' statistics is simply the square of the corresponding 't' statistics. In SPM interface, 'F' contrasts are displayed as images and 't' statistics is dis-played as bars [37,38].
General linear model
Consider an fMRI experiment involving multiple-input stimuli. Let y(t) and xo(t) denote the values of the fMRI time-series reponse and the input stimulus 'o' at time t, respectively. Let Xo = (Xo(t); t ∈θ)T and the design matrix
of experiment by [X1X2....Xn xn+1....xn+m] where X1, X2....Xn represent n stimulus covariates and Xn+m represent 'm' dummy covariates such as age, gender etc. If y = (y(t): t ∈
The figure shows activation in the right intrapareital sulcus of cerebrum cortex lobes (as arrow)
Figure 11
The figure shows activation in the right intrapareital sulcus of cerebrum cortex lobes (as arrow). The raw image fMRI image did not show ghost or susceptibility effect to cause fictitious activation. After segmentation and processing, corresponding time series of activated pixels showed intensity changes. These intensity changes correlated with boxcar type paradigm. The frontal lobes showed fictitous activation while right intraparietal area showed valid activation map.
F Y P Y Y I P Y
Y P Y
T
xo T x
T xo
df df1 2
1
1 7
1 2 .
[ ( ) ( ) ]/
[ ( ) / ( )
= − − −
−
θ)T represents the fMRI time-series, the GLM can be
written as y = Xβ + η, β = (β1, β2, ...βn+m)T denotes the
regres-sion coefficients relating the input covariates to the fMRI response, the matrix X = [H1X1 H2X2 ....HnXn Xn+1...Xn+m] represent the design matrix having covariates modified with the modulation matrices Ho = {hk
ij}n.m and the
com-ponents of noise factor η will correlate and distribute nor-mally. The multiplication of 'input' stimulus with 'modulation matrix' both auto-correlate the dispersion in fMRI response. The 'F' statistics estimates the significance of stimulus to generate time-series 'y' and least square esti-mate of regression coefficients 'β'. Using time-series at voxel site and stimulus condition Xo, the Fo (statistical score) = {Fo(p): p ∈θ} represents 'F' statistical maps for stimulus 'o' and denoted by SPM [Fo]. SPM obtained using one statistics can be converted to another statistics using their grand mean scaling, regressors by parametric modu-lation, high-resolution basic functions and serial
covari-ance matrix to get cumulative distributions in each voxel. The applications of these smooth and filtered SPM intensity profiles indicate spatial extents of the activated blobs [38].
Markov Random Field (MRF) model
This approach presumes that brain activation patterns form MRF to incorporate contextual information. Let us assume that set ao = {ao(p):p ∈θ} denote a segmentation of an SPM or a configuration of brain activation, where ao(p) denotes the state of the brain voxel at site p and ao(p) = 0 if the voxel is inactive and ao(p) = 1 if the voxel is activated by the stimulus 'o'. Here ao represents MRF or activation pattern [38]. As the brain voxel is either acti-vated or inactive, the MRF is assumed as binary logistic model. For this contextual information, preprocessed images find height threshold for smooth statistical map to detect and distinguish activated areas by using 'Euler
The figure shows activation in the left cerebellum cortex lobes (as arrow)
Figure 12
BioMedical Engineering OnLine 2004, 3 http://www.biomedical-engineering-online.com/content/3/1/13
Characteristics', Benferroni Correction and contextual clustering algorithm [37,38]. The Euler characteristics E [EC] is:
E[EC] = R(4 loge 2)(2π)-3/2 Z
te-1/2Zt2 (8)
Where Z-score thresholds between 0–5, R is number of resels. The later is based on the fact that SPM voxel is adjusted with neighborhood information, if differs from expected non-activation value more than a specified deci-sion value. The 'contextual clustering algorithm' estimates cluster parameter, calculates probability distribution and estimates modulation function to classify the voxel as the 'activation' class, otherwise 'nonactivation' class. How-ever, three algorithms viz. 'voxel-wise thresholding', 'clus-ter-size thresholding' and 'contextual-clustering' have been described earlier [38]. Contextual clustering detects activations in small areas with high probability and voxel-wise specificity. 'Benferroni Correction' is based on prob-ability rules and used for calculating family-wise error (FEW) rates Pfwe for fMRI as Pfwe = 1 - (1 - α)n where α is
single-voxel probability threshold.
Computation of a statistical parametric map
For the purpose of this segmentation, SPM in the voxel i is represented as:
SPM{Fx}={Fk(p): p ∈ΩB} (9)
Where F statistical map of Fk(p) for stimulus k represents F statistical score and indicates significance of predicting time-series of voxel site p. For image data, first spatial
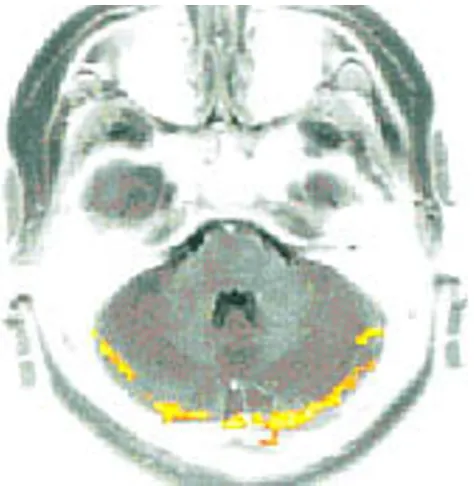
low-The figure shows strong susceptibility effects in axial slice
Figure 13
The figure shows strong susceptibility effects in axial slice. Note the effect of partial presence of air sinus caused signifi-cant distortion in EPI image (arrow in left panel). In coronal slice, air sinus occupied larger image volume (arrow in right panel).
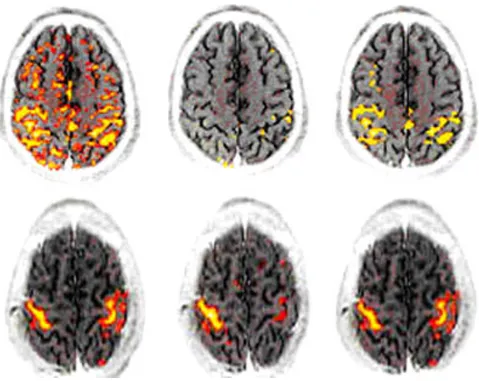
Activation obtained on two axial brain slices of a representa-tive volunteer in the memory retrieval task by (a) threshold-ing the SPM{z} at a significant P value = 0.01, (b) usthreshold-ing the SPM approach on the SPM{z} with a minimum blob size of three voxels and a significance threshold z = 3.5, and (c) using the MRF approach on the SPM{z}
Figure 14
clustering algorithm' (CC) was described in steps [37,38] as:
1) Label the voxels with zi <T as active and other voxels as non-active. Voxels outside the image volume are consid-ered as non-active.
2) Compute for all voxels I the number of active neighbor voxels ui.
3) Relabel the voxels for which
Zi + β/T (ui - N/2) < T (10)
Equation 10 represents voxels as active and other voxels as non-active. The number of neighbor voxels equals to 26-connectivity N = 26. The parameter determines the weigh-ing of the contextual information and is usually positive.
4) If the current labeling is same as the labeling in the pre-vious cycle before that, then stop iterations, otherwise return to step 2.
Probability of observing false activation voxels in a whole volume compares the sensitivity of methods by algorithm applied to different data parameter values. The decision parameter value is chosen that gives false activation in approximately 5 % images and 5 % measured false activa-tion voxels.
Sensitivity, segmentation accuracy and robustness
Generally averaged 500 SPMs achieved by different seg-mentation methods give mean image probability at voxel-level. The less number of false classified voxels as 'active' in the neighborhood of activation represents segmenta-tion accuracy. Noise evaluasegmenta-tion by segmentasegmenta-tion of differ-ent data determines the robustness against spatial autocorrelations. Low robustness is high probability of false activation detection more than the expected probability.
shears. Other approach of linear-in-frequency phase shift in frequency domain applied to 1D fast Fourier transforms (FFTs) generated the image rotation with pol-ynomial interpolation methods [39-41].
However, 3D real time image registration (rotation) algo-rithm chose the axes ordering that resulted in the least intermediate image distortion (minimum net rotation) at proper flip angle about x, y or z-axes i.e. generalized and windowed sinc interpolation. It applied real-time functional MRI acquisition and activation analysis mod-ules within AFNI package. Functional MRI requires the rigid body transformations: small rotations, translations, zooms, rotating tensors and shears in 1–2 degrees or 1–2 voxel dimensions [39,41]. So, repeated linearization of weighted least squares penalty functions with respect to motion parameters accomplishes the registration of a base image to a target image. This method minimized the regional influences and intrinsic variability in function-ally active voxels in the brain. However, fMRI registration suffers from motion-related artifacts: interpolation errors, spin excitation in slice, spatial distortion by Gy and Nyquist ghosts. Intensity based intermodal registration AIR use variance of intensity ratios (VIR) cost function. Real-time image reconstruction was reported using Vision 3.5 software in communication with AFNI or TCP/IP sockets for intra- or intercomputer communications. These registration and rotation algorithms are available as AFNI registration and Visualization program [39,42].
Post-processing methods for fMRI images
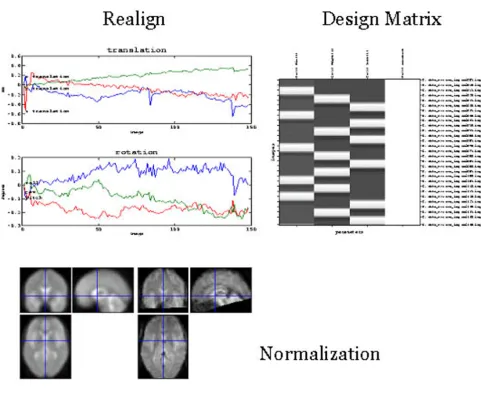
Several post-processing programs 'BrainVoyager', 'AFNI', 'LOFA', 'AIR' are available as a highly optimized and user-friendly software systems for the analysis and visualiza-tion of funcvisualiza-tional magnetic resonance imaging data [43-46]. These combine surface-based and volume-based tools to study the structure and function of the brain to explore the secrets of the active brain by fast and highly optimized 2D and 3D image analysis and visualization routines, as shown in Figure 15. These are built-in-support for major standard and advanced data formats.
BioMedical Engineering OnLine 2004, 3 http://www.biomedical-engineering-online.com/content/3/1/13
Volume-based statistical analysis
Methods include conjunction and Random Effects Analy-sis (RFX) for single and group analyAnaly-sis via Summary Sta-tistics as following:
1. Fit the model for each subject using different GLMs for each subject or by using a multiple subject GLM.
2. Define the effect of interest for each subject with the contrast factor. Each produces a contrast image containing the contrast of the parameter estimates at each voxel.
3. Feed the contrast images into a GLM that implements a one-sample t test.
The RFX analysis is good technique for making inference from representative subjects [47]. In fMRI, block analysis, event-related easy selection of regions-of-interest, display of time courses, integration of volume and surface
render-ing are powerful tools for creation of high-quality figures and movies.
Advanced methods for automatic brain image-processing
The post-processing offers a comprehensive set of analysis and visualization tools that start its operation on raw data (2D structural and functional matrices) and produces visualization of the obtained results. Now a day, all advanced software features are available via a 'intuitive Windows interface'. Several approaches were performed for surface reconstruction, cortex inflation and flattening; cortex-based statistical data analysis (cbGLM) and inter-subject alignment based on gyral / sulcal pattern; cortexbased Independent Component Analysis (cbICA); creation and visualization of EEG / MEG multiple dipole models (fMRI "seeding"); multi-processor support, for ultimate performance; open architecture via COM inter-face, including scripting and automation [48-51].
BrainVoyager is a highly optimized and user-friendly software system for the analysis and visualization of functional and anatom-ical magnetic resonance imaging data
Figure 15
subject to be aligned with the stereotaxic axes. For this step, the locations of the anterior commissure (AC) and the posterior commissure (PC) as well as two rotation parameters for midsagittal alignment have to be specified interactively. In the second step, the extreme points of the cerebrum are specified. These points together with the AC and PC coordinates are then used to scale the 3D data sets into the dimensions of the standard brain of the Talairach and Tournaux atlas [47]. Isolating the brain gray matter and white matter tissues using region-growing methods, filter operations and the application of 3D templates per-forms segmentation. Segmentation explores a 3D volume with superimposed pseudocolor-coded statistical maps in a four-window representation showing a sagittal, coronal, transversal and oblique section. Based on a (segmented) 3D data set, a 3D reconstruction of the subjects' head and brain can be calculated and displayed from any specified viewpoint using volume or surface rendering. Parametric and non-parametric statistical maps may be computed and superimposed both on the original functional scans as well as onto T1-weighted 2D or 3D anatomical refer-ence scans. Nonparametric-permutatation approaches are alternate options at low degree of freedom (small sample size to determine intersubject variability) for noisy statis-tic images when random fields are conservative i.e. smooth variances [47].
Volume rendering
It is performed with a fast 'Ray-Casting algorithm'. Light-ning calculations are based on 'Phong-shading'. Surface rendering of reconstructed surfaces was performed using OpenGL [48].
The surface reconstruction
The surface reconstruction starts with a sphere (recursively tessellated icosahedron) or a rectangle, which slowly wraps around a (segmented) volume data set. Blood oxygenation level-dependent (BOLD)-based fMRI was performed in the visual cortex, and the foci of fMRI activation utilized as seeding points for 3D fiber recon-struction algorithms, thus provided the map of the axonal circuitry underlying visual information processing [49]. A reconstructed cortical surface may be inflated; cut interac-tively and slowly unfolded minimizing area distortions.
reviewed in following section.
High-field MR scanner system is an advantage in fMRI
For high-field fMRI imaging, paramagnetic susceptibility of spin may be related with gyromagnetic ratio (γ) and represented by the Brillouin equation as:
where k is the Boltzmann constant and T absolute temperature.
Susceptibility effect in fMRI increases exponentially as the hyperbolic tangent associated with an increase in the main field, Bo, of the system. T2* detectable activation (∆I) is significantly increased as shown in Figure 16. Simultaneously, artifacts inducing perturbations also increase. High-field MRI imager system generates T2* contrast for analysis of complex behavioral tasks as shown in Figure 17. Single subject Ideographic analysis was reported at 3 T systems to locate face-exemplar by regional cortical flat-mapping [50]. For clinical purposes, 1.5 T sys-tems work well. For advanced neuroimaging investiga-tion, higher field MR systems are essential.
fMRI Time series analysis
In fMRI, 'time series analysis' by SPM99 is recently used for autocorrection and smoothening. For it, generalized linear model can be expressed as a function of discrete time series, y(t) as:
Y(t) = xc(t)βc + ε(t) (12)
where xc(t) and ε(t) are function of time, βc are time-invar-iant parameters. Linear time invariance distinguishes neural activity (event) and post-stimulation (epoch) onsets. In general, the resolution of delta function, dt = Tr/ T sec and the number of columns = Nc = NiNjNkNb repre-sent invariance in design matrix. High pass filtering of 'time series' frequency components y(t) get Fourier trans-formed to remove noise and convolution. Temporal autocorrection in fMRI series is done by 'temporal smoothing' and 'intrinsic autocorrelation' and estimated
Paramagnetic susceptibility h B
h B kT o
o
= γ γ
2 tanh[ 2 11
| |
BioMedical Engineering OnLine 2004, 3 http://www.biomedical-engineering-online.com/content/3/1/13
by 'Auto-Regression' or '1/ f low-pass smoothing' methods to remove bias [51].
SPM99 offers 'finite impulse response' (FIR) sets for increased neural activity increases BOLD response 'amplitude' over few seconds based on BOLD from differ-ent brain regions such as V1, S1, A1 and higher cortical
regions with different vasculature 'Temporal Basis Functions'. FIR sets consist of Nk contiguous box-car func-tions of peristimulus time, each of duration TH/Nk. TH is maximum duration of high-pass filter. The Fourier set consists of sine Ns and cosine functions of harmonic peri-ods TH, TH/2...TH/Ns. Linear combination of FIR, Fourier
sets captures any shape of response in timescale TH/Nk or Ns/TH respectively [52]. 'Event-related Response' and 'Basis sets' were chosen based on stimulus variability and canonical 'Hemodynamic Response Function' and 'F' con-trasts determine contribution of different basis sets. Single event- Multi-event type design minimizes the 'contrast error'. Deterministic, static and dynamic stochastic designs use minimum 'stimulus onset synchrony' (SOAm)
and probability of event (for single event design) or tran-sition matrix (for multi-event design) to induce variance over a range of frequencies.
Linear Transform model interprets fMRI signals, origin of the fMRI signals and compares fMRI with neuronal sig-nals. Left and right lateralization for motor cortex stimu-lation generated visual flash motor response indicative of relationship between different measures of neuronal activity such as single-and multi-unit spiking activity, LFP etc. and reflected neuronal functions. Recently, fMRI sig-nal measured the sigsig-nal induced by the inputs to a cortical area [53].
A typical time series of an activated pixel in primary cortex is shown to represent the performance of horizontal 3 T system optimized for fMRI
Figure 16
A typical time series of an activated pixel in primary cortex is shown to represent the performance of horizontal 3 T system optimized for fMRI. S/N indicated variation of EPI images, while _I, activation induced increase in signal intensity. This time series represents signals from a single voxel volume of 3 mm × 3 mm × 5 mm. The red curves represent raw data and boxcar type model functions shown in blue color.
Figure represents functional maps shown for comprehension tasks: for reading task (eft panel) and hearing task (right panel)
Figure 17
Independent component-cross correlation-sequential epoch (ICS) Analysis: Image Processing
The fMRI acquisition time is usually less per paradigm. For multiple task-oriented studies, analysis of complex higher brain functions is based on the 'principle of func-tional independence' and funcfunc-tional distinct areas (chronoarchitecture). Independent component-cross cor-relation-sequential epoch (ICS) segregates distinct areas in cerebral and temporal chronoarchitectonic maps. The different exposures of the brain to natural conditions for different 'durations' segregate the different brain areas for their temporal differences. One subset of natural condi-tions, reflect free-viewing activity of visual, parietal, tem-poral areas. However, frontal, pre-frontal cortices functional subdivisions or multivariate paradigms were recently illustrated as shown in Figure 18. A sequential epoch paradigm is composed to embed the function which correlates to the target multiple behavioral hypoth-esis (Σifi(t)). The simplest function is a 'boxcar function' as employed in many fMRI studies. For it, fMRI time series are subjected to blind separation into independent com-ponents by independent component analysis. Subse-quently, cross correlation analysis is performed utilizing each embedded function, f(t), as model function to achieve multiple fMRI images as behavioral correlates given by the selected function as an activation map. For
the hemodynamic reference function (HRF) following a single sensory stimulation, the time course function rep-resents as model function and ICS becomes a reliable method for event-related fMRI. ICS is useful for event related high-field fMRI where T2* contrast enhances the magnitude of activation than that performed on conven-tional 1.5 T clinical systems [54].
Brain functional areas
Recent trend in fMRI research was to understand the rela-tionship of physiological mechanisms and selective activation of different brain locations using fMRI tech-niques. However, the knowledge of the independent brain functions and control by different parts is still in infancy. fMRI has long way to answer the physiological stimuli and mechanism of different fMRI BOLD signals. The success of it solely depends on power of fMRI image processing. Recent investigations highlight the fMRI visi-ble different brain areas, new understanding of fMRI sen-sitive physiological stimuli and use of high field scanners. Visual stimuli and event related neural activity by fMRI and image processing methods are reviewed in recent years [18]. Visual areas are recently identified as the boundaries of visual areas V1, V2, V3, V3A, V4, MT/V5, and TEO/V4A in visual cortex and their distribution within the occipital lobe. Motor related areas are known
An example of multivariate analysis in primary motor cortex is represented for revealing the presence of dual representations of constructed multivariate paradigms (MI 4a and MI 4p) in human
Figure 18
BioMedical Engineering OnLine 2004, 3 http://www.biomedical-engineering-online.com/content/3/1/13
as M1. These corresponding areas are: Broadmann's area (BA 4), SMA (BA 6) and premotor area (BA 6). These fMRI visible areas as shown in Figure 18, are important to inter-pret fMRI stimulation and its location [18,55].
Recently, new understanding of quantitative visual field eccentricity function measurements on visual field maps by fMRI were made in macaque visual cortex visual areas. fMRI estimated the average receptive field sizes of neurons in each of several striate and extrastriate visual areas of the human cerebral cortex. Retinotopic mapping procedures determined the boundaries of the visual areas and visual-ized on flattened occipital cortex, primary visual cortex V1, V2, V3/VP and V3A and V4. In all these areas, receptive fields increased in size with increasing stimulus eccentricity similar to macaque monkeys [56]. fMRI maps and the visual area maps represent the distribution of cortical signals and computational homologies between human and monkey. Neural activity and the creation of a new memory trace were observed using functional mag-netic resonance imaging (fMRI). Event-related fMRI dem-onstrated the activity in prefrontal and medial temporal lobe areas associated with successful memory storage. Contrast activity was associated with encoding success and encoding effort using a cue in the form of a letter (R or F). These recent studies suggested the prefrontal activa-tion strongly associated with intenactiva-tional verbal encoding and left medial temporal activation for successful memory on the subsequent test. Cortical regions sensitive to motion processing receive their inputs only via the pri-mary visual cortex (striate cortex).
Recently, fMRI evidenced higher-order motion-processing in primates and humans with damaged primary visual cortex (e.g., "blindsight" for motion in the blind visual hemifield) for the existence of a direct thalamic functional pathway exists to extrastriate visual cortical motion processing areas that bypasses primary visual cortex [56]. Highfield fMRI retinotopic method was reported to map the neural substrate of retinal slip compensation during visual jitter in flattened cortical format. A novel illusion (visual jitter) suggested the compensation mechanism based on retinal motion. fMRI suggested the pathway from V1 to MT+ involved in the compensation stage in stabilizing the visual world [57]. fMRI demonstrated the sensitivity changes controlled within the visual pathway for responses in human visual area V1 to a constant-amplitude, contrastreversing probe presented on a range of mean backgrounds. fMRI signals from probes initiated in the L and M or S cones. Psychophysical tests showed changes in V1 fMRI cortical BOLD signals by 'mean-field adaptation model' within cone photoreceptor classes [58]. A new mechanism of hypercapnia and hypocapnia was described as alveolar oxygen and CO2 gases flux and their effect on BOLD response to visual stimulation. At
high magnetic field 7 T, the BOLD signal magnitude and dynamics of hemodynamic response represented the effect of CBF under conditions: hypocapnia, normocap-nia, and hypercapnia [59].
Binocular interactions present checkerboard stimuli occurring when subjects view dichoptically. A flickering radial checkerboard stimulation of eyes in binocular or monocular conditions, generate specific responses in stri-ate and extrastristri-ate visual cortex on T2*-weighted images of visual cortex acquired with gradient-echo, echoplanar imaging. The striate area, calcarine fissure BOLD response differed for these stimulation conditions [60]. Recently, a neuron location by color-selective mapping method has attracted to compare the relationships of ocular domi-nance and orientation with responses to high-contrast luminance stimulus and patchy distribution of color selectivity to locate different functional subdivisions of striate cortex in macaque. These color patches with the cytochrome-oxidase (CO) blobs speculated the ocular dominance (OD) column. For it, "Ice cube" model of color-selective regions predicted the organization of ori-entation and ocular dominance functional hypercolumns in V1 [61]. Dipole locations in cortical brain (regional vis-ualization) is developed as a new art by fMRI activations. Neural generators of the visual evoked potential (VEP) generate isoluminant checkerboard stimuli. Using Mul-tichannel scalp recordings, retinotopic mapping and dipole modeling techniques estimated the dipole loca-tions of the cortical regions giving rise to C1, P1, and N1 components of VEP [62]. These locations could be matched to both MRI-visible anatomical brain regions and fMRI activations. Several locations are broadly identi-fied as C1 component (striate cortex; area 17), early phase of the P1 component (dorsal extrastriate cortex of the middle occipital gyrus), late phase of the P1 component (ventral extrastriate cortex of the fusiform gyrus), posterior N 150, anterior N 155 (parietal lobe) in relation to visual-perceptual processes. In other development for complex cognitive tasks, neuronal encoding and fMRI processing strategies segregate retention and retrieval phases of visual short-term memory for objects, places and conjunctions in humans. These tasks were associated with spatio-temporal activation of parietal and prefrontal areas during the retention phase and posterior-anterior and right-left dissociation for spatial versus non-spatial memory [63].
tations. Repetition-priming method was proposed for visual stimuli recurring at unpredictable intervals, either with the same appearance or with changes in size, view-point or exemplar [65].
Event related potentials and fMRI activation patterns
Combining event-related potentials (ERP) and fMRI acti-vation provide temporal and spatial resolution, func-tional connectivity of neural processes of same neural networks within the bilateral occipital gyrus, lingual gyrus; precuneus and middle frontal gyrus; and the left inferior and superior parietal lobe; middle and superior temporal gyrus; cingulate gyrus, superior frontal gyrus and precentral gyrus. It evidenced the correlation within the common activity and time-range in a complex visual lan-guage task [66]. These tasks comprise specific stimulus-response associations and activate a variety of non-spe-cific cortical regions [67]. Dystonia, a movement disorder involves involuntary coordination of agonist and antago-nist muscles, which cause abnormal posture or twisting. Event related fMRI technique revealed impairment of muscle contraction and relaxation. Comparison of acti-vated volume in cortical motor areas in dystonia patients with volunteers showed different muscle relaxation and contraction activation volumes as shown in Figure 20. In these tasks, mainly SM1 and SMA activated areas were reduced contra- laterally in dystonia patients as evidenced by time course of fMRI signal in SMA activation area [68].
Sensory and motor systems
Sensory and motor systems interact in complex ways. Vol-untary movements with visual attention yield distinct fMRI hemodynamic signals and brain activations i.e. making repetitive finger movements, attending to the color of a visual stimulus or simultaneous finger move-ment and visual attention. In these processes, the primary motor cortex, supplementary motor area, cerebellum, sparse cerebral cortical and substantial bilateral cerebellar locations get active. Activation-related interactions in the left superior parietal lobule, the right fusiform gyrus, and left insula, recently were indicated their role in visual attention and movement [69].
Different psychological tests have been developed to eval-uate frontal tasks of macaque monkeys and humans. Wis-consin Card Sorting Test (WCST) characterized the frontal lobe lesions in macaque monkeys and humans based on behavioral flexibility in the form of cognitive set shifting. Equivalent visual stimuli and task sequence showed transient activation related to cognitive set shifting in focal regions of prefrontal cortex in both monkeys and humans. These functional homologs were located in cytoarchitectonically equivalent regions in the posterior part of ventrolateral prefrontal cortex. This comparative imaging provided insights into the evolution of cognition in primates [70].
Test-retest precision of functional magnetic resonance imaging (fMRI) by student't' mapping (STM) is recently
An illustration of anatomical connections between motor areas are shown
Figure 19
BioMedical Engineering OnLine 2004, 3 http://www.biomedical-engineering-online.com/content/3/1/13
Figure represents the application of event-related fMRI to dystonia
Figure 20
architecture of ocular dominance within the primary vis-ual cortex [35,72]. For intensity-based non-rigid registra-tion of medical images was developed for atlas based segmentation and intensity-based geometric correction of functional magnetic resonance imaging (fMRI) images by 'Adaptive bases algorithm' to register the smallest struc-tures in the image [73].
Summary and future directions
The goal of this review was to introduce the neurophysio-logical factors and image processing principles of fMRI to suggest potential future applications in neuroscience and physiology. These future directions include neurosurgical planning and improved assessment of risk for individual patients, improved assessment and strategies for the treat-ment of chronic pain, improved seizure localization, and improved understanding of the physiology of neurologi-cal disorders. We look ahead to newer algorithms, enhanced fMRI sensitivity and spatial resolution by use of high field systems, ASL and phase array coils or newer contrast agents [74]. Presently, other emerging applica-tions of EEG/MEG, PET and neuropsychological testing along with fMRI are coming up as the benefits of this fMRI technology incorporated into current neuroscience and future patient care. In recent years, lot of future excitement is evident in the following areas of brain information by segmentation and registration methods applied to fMRI. These include mainly automated nonlinear labeling; and automated surface reconstructions. Automated surface reconstruction appears to be possible by: i. cortical sur-face-based analysis by segmentation and surface recon-struction [75]; ii. cortical surface-based analysis by inflation, flattening, and a surface-based coordinate sys-tem [76]. Automated anatomical brain labeling may be performed by: i. whole brain segmentation: automated labeling of neuro-anatomical structures in the human brain [77]; ii. multipatient registration of brain fMRI using intensity and geometric features [78]; iii. automatic detection and labeling of the human cortical fields in magnetic resonance data sets [79].
References
1. Tegeler C, Strother SC, Anderson JR, Kin SG: Reproducibility of BOLD based functional MRI obtained at 4 T. Hum Brain Mapp
1999, 7:267-283.
22(21):9541-8.
7. Preibisch C, Haase A: Functional MR imaging of the human brain using FLASH: influence of various imaging parameters.
J Magn Reson 1999, 140(1):162-71.
8. Ogawa S, Menon RS, Tank DW, Kim SG, Merkle H, Ellermann JM, Ugurbil K: Functional Brain Mapping by blood oxygenation level-dependent contrast magnetic resonance imaging: A comparison of signal characteristics with a biophysical model. Biophys J 1993, 64:803-812.
9. Nakai T, Matsuo K, Kato C, Okada T, Moriya T, Isoda H, Takehara Y, Sakahara H: BOLD contrast on a 3T magnet: detectibility of the motor areas. J Comput Assit Tomogr 2001, 25:436-445. 10. Bandettini PA, Cox RW: Event related fMRI contrast when
using constant interstimulus interval: Theory and experiment. Magn Reson Med 2000, 30:161-173.
11. Turner R, Jezzard P, Wen H, Kwong KK, Le Bihan D, Zeffiro T, Bala-ban RS: Functional mapping of the human visual cortex at 4 and 1.5 T using deoxygenation contrast EPI. Mag Reson Med
1993, 29:277-279.
12. Kwong KK, Chesler DA, Weisskoff RM, Donahue KM, Davis TL, Ostergaard L, Campbell TA, Rosen BR: MR perfusion studies with T1-weighted echo planar imaging. Mag Reson Med 1995, 34:878-887.
13. Russ MO, Cleff U, Lanfermann H, Schalnus R, Enzensberger W, Klein-schmidt A: Functional magnetic resonance imaging in acute unilateral optic neuritis. J Neuroimaging 2002, 12(4):339-50. 14. Miki A, Liu GT, Englander SA, Raz J, van Erp TG, Modestino EJ, Liu CJ,
Haselgrove JC: Reproducibility of visual activation during checkerboard stimulation in functional magnetic resonance imaging at 4 Tesla. Jpn J Ophthalmol 2001, 45(2):151-5.
15. Shibata K, Osawa M, Iwata M: Visual evoked potentials in cere-bral white matter hyperintensity on MRI. Acta Neurol Scand
2000, 102(4):230-5.
16. Fransson P, Kruger G, Merboldt KD, Frahm J: A comparative FLASH and EPI study of repetitive and sustained visual activation. NMR Biomed 1997, 10(4–5):204-7.
17. Kim SG, Rostrup E, Larsson HB, Ogawa S, Paulson OB: Determina-tion of relative CMRO2 from CBF and BOLD changes: Sig-nificant increase of oxygen consumption rate during visual stimulation. Magn Reson Med 1999, 41:1152-1161.
18. Nakai T, Matsuo K, Kato C, Okada T, Moriya T, Isoda H, Takehara Y, Sakahara H: BOLD contrast on a 3T magnet: detectability of the motor areas. J Comput Assist Tomogra 2001, 25:436-445. 19. Toma K, Nakai T: Functional studies in human motor control
studies and clinical applications. Mag Reson Med Sci 2002, 1(2):109-120.
20. Kim SG: Quantification of relative cerebral blood flow change by flowsensitive alternating inversion recovery (FAIR) tech-nique: Application to functional mapping. Magn Reson Med
1995, 34:293-301.
21. Nakada T, Fujii Y, Kwee IL: Brain strategies for reading in the second language are determined by the first language. Neuro-sci Res 2001, 40:351-35.
22. Logothetis NK, Pauls J, Augath M, Trinath T, Oeltermann A: A neu-rophysiological investigation of the basis of fMRI signal.
Nature 2001, 412:150-157.
BioMedical Engineering OnLine 2004, 3 http://www.biomedical-engineering-online.com/content/3/1/13
24. Haslinger B, Erhard P, Kampfe N, Boecker H, Rummeny E, Schwaiger M, Conrad B, Ceballos-Baumann AO: Event related functional magnetic resonance imaging in Perkinson's disease before and after levodopa. Brain 2001, 124:558-570.
25. Kim DS, Duong TQ, Kim SG: High-resolution mapping of iso-orientation columns by fMRI. Nature Neurosci 2000, 3:164-169. 26. Ogawa S, Menon RS, Kim SG, Ugurbil K: On the characteristics of
functional MRI of the brain. Ann Rev Biophy and Biomol Struct 1998, 27:447-74.
27. Jueptner M, Weiller C: Does measurement of regional cerebral blood flow reflect synaptic activity: implication for PET and fMRI. Neuroimaging 1995, 2:148-156.
28. Villringer A: Physiological changes during brain activation. In
"Functional MRI" Edited by: Moonen CTW, Bandenitti PA. Springer-verlag, Berlin; 1999:3-13.
29. Buxton RB, Frank LR: A model for the coupling between cere-bral blood flow and oxygen metabolism during neuronal stimulation. J Cereb Blood Flow Metab 1997, 17:64-72.
30. Mandeville JB, Marota JJ, Ayata C, Zaharchuk G, Moskowitz MA, Rosen BR, Weisskoff RM: Evidence of a cerebral post-arteriole windlissel with delayed compliance. J Cereb Blood Flow Metab
1999, 19:679-689.
31. Zaharchuk G, Ledden PJ, Kwong KK, Reese TG, Rosen BR, Wald LL: Multislice perfusion and perfusion territory imaging in humans with separate label with image coils. Magn Reson Med
1999, 44:92-100.
32. Disbrow EA, Slutsky DA, Roberts TP, Krubitzer LA: Functional MRI at 1.5 Tesla: A comparison of the blood oxygenation level-dependent signal and electrophysiology. Proc Natl Acad Sci USA 2000, 97:9718-9723.
33. Cheng K, Waggoner RA, Tanaka K: Human ocular dominance columns as revealed by high field functional magnetic reso-nance imaging. Neuron 2001, 32:359-374.
34. Cox RW: AFNI: software for analysis and visualization of functional magnetic resonance neuroimages. Comput Biomed Res 1996, 29(3):162-73.
35. Goodyear BG, Menon RS: Brief visual stimulation allows map-ping of ocular dominance in visual cortex using fMRI. Human Brain Mapp 2001, 14(4):210-217.
36. Kim DS, Duong TQ, Kim SG: High resolution mapping of iso-ori-entation columns by fMRI. Nature Neurosci 2000, 3:164-169. 37. Kiebel S, Holmes A, Poline JB, Kherif F, penny W: The general
Lin-ear Model; Contrasts and classical inference. In: Human Brain Function. Chapters 37 and 38 Edited by: Frackowiak RSJ, Friston KJ, Frith CD, Dolan RJ, Price CJ, Jeki S, Ashburner J, Penny W. Elsevier Academic Press, London; 2004:749-779.
38. Rajapakse JC, Priyaratna J: Bayesian approach to segmentation of statistical parametric maps. IEEE Trans on Biomed Eng 2001, 48(10):1186-1194.
39. Cox RW, Jesmanowicz A: Real-time 3D image registration for functional MRI. Magn Reson Med 1999, 42:1014-1018.
40. Sarkissian E, Bowman KW: Application of a nonuniform spectral resampling transform in Fourier-transform spectrometry.
Appl Opt 2003, 42(6):1122-31.
41. Ciulla C, Deek FP: Performance assessment of an algorithm for the alignment of fMRI time series. Brain Topogr 2002, 14(4):313-32.
42. Nichols T, Holmes A: Non parametric permutation tests for functional neuroimaging. In: Human Brain Function Chapters 46
Edited by: Frackowiak RSJ, Friston KJ, Frith CD, Dolan RJ, Price CJ, Jeki S, Ashburner J, Penny W. Elsevier Academic Press, London; 2004:887-908.
43. Gokcay D, Mohr CM, Crosson B, Leonard CM, Bobholz JA: LOFA: software for individualized localization of functional MRI activity. Neuroimage 1999, 10(6):749-55.
44. Gold S, Christian B, Arndt S, Zeien G, Cizadlo T, Johnson DL, Flaum M, Andreasen NC: MRI statistical software packages: a com-parative analysis. Hum Brain Mapp 1998, 6(2):73-84.
45. Vemuri BC, Ye J, Chen Y, Leonard CM: Image registration via level-set motion: applications to atlas-based segmentation.
Med Image Anal 2003, 7(1):1-20.
46. Friston KJ, Glaser DE, Henson RNA, Kiebel S, Phillips C, Ashburner : Classical and Bayesian inference in neuroimaging : applications. Neuroimage 2002, 16:484-512.
47. Moutoussis K, Zeki S: The Chronoarchitecture of the Human Brain: Functional Anatomy Based on Natural Brain
Dynam-ics and the Principle of Functional Independence. In: Human Brain Function. Chapter 13 Edited by: Frackowiak RSJ, Friston KJ, Frith CD, Dolan RJ, Price CJ, Jeki S, Ashburner J, Penny W. Elsevier Aca-demic Press, London; 2004:201-229.
48. Hong L, Kaufman AE: Fast Projection-Based Ray-Casting Algo-rithm for Rendering Curvilinear Volumes. IEEE Trans Visual and Comp Graph 1999, 5(4):322-332.
49. Kim DS, Kim M, Ronen I, Formisano E, Kim KH, Ugurbil K, Mori S, Goebel R: In vivo mapping of functional domains and axonal connectivity in cat visual cortex using magnetic resonance imaging. Magn Reson Imaging 2003, 21(10):1131-40.
50. Schmitt F, Grosu D, Mohr C, Purdy D, Salem K, Scott KT, Stoeckel B: 3 Tesla MRI: successful results with higher field strengths.
Radiologe 2004, 44(1):31-47.
51. Henson RN, Rugg MD, Friston KJ: The choice of basis functions in the eventrelated fMRI. Neuroimage 2001, 15:83-97.
52. Rugg MD, Henson RN: Episodic memory retrival: an event-related functional neuroimaging perspective. In the Cognitive Neuroscience of Memory Encoding and Retrieval Edited by: Parker AE, Wilding EL and Bussey T. Psychology Press, Hove; 2002:150-189. 53. Meyer FG: Wavelet-based estimation of a semiparametric
generalized linear model of fMRI time-series. IEEE Trans Med Imaging 2003, 22(3):315-22.
54. Kiviniemi V, Kantola JH, Jauhiainen J, Tervonen O: Comparison of methods for detecting nondeterministic BOLD fluctuation in fMRI. Magn Reson Imaging 2004, 22(2):197-203.
55. Brewer AA, Press WA, Logothetis NK, Wandell BA: Visual areas in macaque cortex measured using functional magnetic reso-nance imaging. J Neurosci 2002, 22(23):10416-26.
56. Schoenfeld MA, Heinze HJ, Woldorff MG: Unmasking motion-processing activity in human brain area V5/MT+ mediated by pathways that bypass primary visual cortex. Neuroimage 2002, 17(2):769-79.
57. Sasaki Y, Murakami I, Cavanagh P, Tootell RH: Human brain activ-ity during illusory visual jitter as revealed by functional mag-netic resonance imaging. Neuron 2002, 35(6):1147-56. 58. Wade AR, Wandell BA: Chromatic light adaptation measured
using functional magnetic resonance imaging. Neurosci 2002, 22(18):8148-57.
59. Cohen ER, Ugurbil K, Kim SG: Effect of basal conditions on the magnitude and dynamics of the blood oxygenation level-dependent fMRI response. J Cereb Blood Flow Metab 2002, 22(9):1042-53.
60. Buchert M, Greenlee MW, Rutschmann RM, Kraemer FM, Luo F, Hennig J: Functional magnetic resonance imaging evidence for binocular interactions in human visual cortex. Exp Brain Res
2002, 145(3):334-9.
61. Landisman CE, Ts'o DY: Color processing in macaque striate cortex: relationships to ocular dominance, cytochrome oxi-dase, and orientation. J Neurophysiol 2002, 87(6):3126-37. 62. Di Russo F, Martinez A, Sereno MI, Pitzalis S, Hillyard SA: Cortical
sources of the early components of the visual evoked potential. Hum Brain Mapp 2002, 15(2):95-111.
63. Munk MH, Linden DE, Muckli L, Lanfermann H, Zanella FE, Singer W, Goebel R: Distributed cortical systems in visual short-term memory revealed byevent-related functional magnetic reso-nance imaging. Cereb Cortex 2002, 12(8):866-76.
64. Kleinschmidt A, Thilo KV, Buchel C: Neural correlates of visual-motion perception as object- or self-visual-motion. Neuroimage 2002, 16(4):873-82.
65. Vuilleumier P, Henson RN, Driver J, Dolan RJ: Multiple levels of visual object constancy revealed by event-related fMRI of repetition priming. Nature Neurosci 2002, 5(5):491-9.
66. Jackson GM, Swainson R, Mullin A, Cunnington R, Jackson SR: ERP correlates of a receptive language-switching task. Q J Exp Psy-chol A 2004, 57(2):223-40.
67. Maclin EL, Gratton G, Fabiani M: Visual spatial localization con-flict: an fMRI study. Neuroreport 2001, 12(16):3633-6.
68. Oga T, Honda M, Toma K, Murase N, Okada T, Hanakawa T, Sawamoto N, Nagamine T, Konishi J, Fukuyama H, Kaji R, Shibasaki H: Abnormal cortical mechanisms of voluntary muscle relx-ation in patients with writer's cramp: An fMRI study. Brain
2002, 125:895-903.
Publish with BioMed Central and every scientist can read your work free of charge "BioMed Central will be the most significant development for disseminating the results of biomedical researc h in our lifetime."
Sir Paul Nurse, Cancer Research UK
Your research papers will be:
available free of charge to the entire biomedical community
peer reviewed and published immediately upon acceptance
cited in PubMed and archived on PubMed Central
yours — you keep the copyright
Submit your manuscript here:
http://www.biomedcentral.com/info/publishing_adv.asp
BioMedcentral Segmentation and Surface Reconstruction. Neuroimage 1999,
9:195-207.
76. Fischl B, Sereno MI, Dale AM: Cortical Surface-based analysis II: Inflation, Flattening, and a Surface-Based Coordinate System. Neuroimge 1999, 9:179-194.
77. Fischl B, Salat DH, Busa E, Albert M, Dieterich M, Haselgrove C, van der Kouwe A, Killiany R, Kennedy D, Klaveness S, Montillo A, Makris N, Rosen B, Dale AM: Whole brain segmentation: Automated labeling of neuroanatomical structures in the human brain.
Neurone 2002, 33:341-355.
78. Cachier P, Mangin JF, Pennec X, Riviere D, Papadopoulos-Orfanos D, Regis J, Ayachi N: Multipatient registration of brain MRI using intensity and geometric features. Proceedings of MICCAI 2001, LNCS 2208:734-742.