NeoAnalysis: a Python‑based toolbox
for quick electrophysiological data processing
and analysis
Bo Zhang
1,2, Ji Dai
1,2,3*and Tao Zhang
1,2Abstract
Background: In a typical electrophysiological experiment, especially one that includes studying animal behavior, the data collected normally contain spikes, local field potentials, behavioral responses and other associated data. In order to obtain informa-tive results, the data must be analyzed simultaneously with the experimental settings. However, most open-source toolboxes currently available for data analysis were devel-oped to handle only a portion of the data and did not take into account the sorting of experimental conditions. Additionally, these toolboxes require that the input data be in a specific format, which can be inconvenient to users. Therefore, the development of a highly integrated toolbox that can process multiple types of data regardless of input data format and perform basic analysis for general electrophysiological experiments is incredibly useful.
Results: Here, we report the development of a Python based open-source toolbox, referred to as NeoAnalysis, to be used for quick electrophysiological data process-ing and analysis. The toolbox can import data from different data acquisition systems regardless of their formats and automatically combine different types of data into a single file with a standardized format. In cases where additional spike sorting is needed, NeoAnalysis provides a module to perform efficient offline sorting with a user-friendly interface. Then, NeoAnalysis can perform regular analog signal processing, spike train, and local field potentials analysis, behavioral response (e.g. saccade) detection and extraction, with several options available for data plotting and statistics. Particularly, it can automatically generate sorted results without requiring users to manually sort data beforehand. In addition, NeoAnalysis can organize all of the relevant data into an informative table on a trial-by-trial basis for data visualization. Finally, NeoAnalysis sup-ports analysis at the population level.
Conclusions: With the multitude of general-purpose functions provided by NeoAnal-ysis, users can easily obtain publication-quality figures without writing complex codes. NeoAnalysis is a powerful and valuable toolbox for users doing electrophysiological experiments.
Keywords: NeoAnalysis, Python, Electrophysiology, Analysis, Toolbox, Spike, Offline sorting, Saccade detection
Open Access
© The Author(s) 2017. This article is distributed under the terms of the Creative Commons Attribution 4.0 International License (http://creativecommons.org/licenses/by/4.0/), which permits unrestricted use, distribution, and reproduction in any medium, provided you give appropriate credit to the original author(s) and the source, provide a link to the Creative Commons license, and indicate if changes were made. The Creative Commons Public Domain Dedication waiver (http://creativecommons.org/publicdo-main/zero/1.0/) applies to the data made available in this article, unless otherwise stated.
SOFTWARE
*Correspondence: [email protected] 3 Shenzhen Key Lab of Neuropsychiatric Modulation
Background
Rapid advancements in electrophysiological techniques in the past few decades have enabled researchers to gather vast amounts of data from numerous neurons [1]. Mean-while, various software tools have also been developed for data storage, exploration, and analysis [2, 3]. Electrophysiological experiments studying animal behaviors (e.g. rodents and primates) typically include a variety of data, such as the neuronal and behavioral data collected by the data acquisition system as well as any associated data indicating the animal status, the stimulus parameters, and other constraints [4]. Informative results require the processing and simultaneous analysis of all of this information; this requires analysis tools that are capable of handling neural data and performing the analysis of the data according to the experimental settings. Typically different data acquisition sys-tems use their proprietary formats for data storage, which impedes data sharing and also makes the development of analysis tools challenging.
Currently, several commercial programs for electrophysiological data processing and analysis (e.g. Offline Sorter [5], Neuroexplorer [6]) are available. However, they are costly and often cannot satisfy the demands of the rapid developments being made in the field of electrophysiology. Subsequently, open-source software packages are constantly emerging. Some of these toolboxes, such as the Spike Train Analysis Toolkit [7], the FIND [8] and the Chronux [9], are very popular. However, these toolboxes are developed based on MATLAB, which is not a free program, and may not be affordable for labora-tories with a limited budget. Therefore, it would be better to develop a toolbox to pro-cess electrophysiological data based on open-source software. In this study, we propose using a programming language that has been widely used in scientific computing and is compatible with all major operating systems including Windows, Linux, and Mac OS: Python, a freely available program with plenty of existing open-source packages. Addi-tionally, using certain packages like pandas [10], Python is capable of integrating differ-ent types of data, including numbers, strings, and lists into one data table regardless of the length of each element. This flexibility and compatibility make Python very suitable for handling the complex electrophysiological data, which contain multiple types of data.
functions. Even in the proposed data frame, it is difficult to visualize data and the user interaction requires further improvement. In particular, this toolbox does not take into account the detection of saccades, which are important behavioral indicators for some experiments [15, 16]. In this study, we developed a toolbox called NeoAnalysis, which overcomes the shortages of other packages and facilitates efficient analysis.
Implementation
Design principles
NeoAnalysis aims to provide an out-of-the-box tool for users to process and analyze dif-ferent types of data obtained during a typical electrophysiological experiment. To this end and overcome the aforementioned shortages of existing toolboxes, we develop Neo-Analysis following the principles described below:
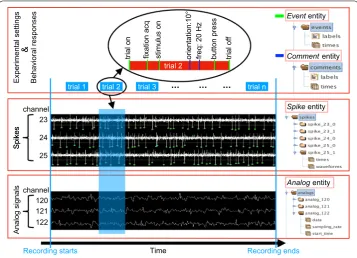
The first concern is the data format problem. Currently, different data acquisition sys-tems save the recorded data in their proprietary file formats. We want NeoAnalysis to support most formats for the major commercial systems including Blackrock (Black-rock Microsystems LLC, Utah, USA), Plexon (Plexon Inc., Dallas, TX, USA), and TDT (Tucker-David Technologies; Alachua, FL, USA). Therefore, it is necessary to convert the input data to a standardized format, which will ease the subsequent work in scripting analysis programs. As we know, a typical electrophysiological experiment normally col-lects spikes, analog signals (e.g. LFP), experimental settings, and behavioral responses (Fig. 1). The solution is to divide these data into four basic entities regardless of their original formats: Spike, Analog, Event, and Comment.
• A Spike entity contains the time points at which the action potentials occur, as well as their waveforms and unit classification.
• An Analog entity contains the continuous data that was recorded at a given sampling frequency, such as LFP.
• An Event entity contains the time points and the labels defining the occurrence of specific events, such as the onset of a stimulus or the occurrence of a button press.
• A Comment entity contains the time points and the labels that define the experimen-tal settings, such as the orientation of the stimulus in each trial.
With the help of Neo [11], which is an open source package aiming to standardize electrophysiological data, the input data can be easily imported to generate the Spike,
Analog and Event entities. However, the obtained Event entity (Neo_Event) actually includes both events and comments according to our definition. Given comments are required for condition sorting during data analysis, mixing these two entities will make this procedure difficult. So we extend the Neo package in our program to further divide the Neo_Events to the real Event entity and Comment entity according to our definition. Then, we save these entities in a standardized format. Examples of how these entities are organized in the output file are shown on the right side of Fig. 1. This procedure substan-tially eliminates the limitation due to data format and enhances the compatibility of this toolbox.
spikes, perform offline spike sorting, filter analog signal, analyze single session data and population data (Fig. 2).
TransFile
The TansFile module assists users to convert the raw data of any supported format to an HDF5 file using the preceding principle. The HDF5 format is used because it is a highly efficient format for data I/O, especially for data of a large volume and a complex struc-ture. In addition, it is a unified format that can be used by different operating systems and programming languages [17].
SpikeDetection
The SpikeDetection module is used to detect spikes from the raw signals. Given most data acquisition systems support online spike detection, this module will not be used for most users. In the case when non-standard recording systems are used and addi-tional spike detection procedure is required, we designed this module for users to detect spikes with a graphic user interface (GUI). In addition to manually setting the threshold and selecting waveform [18], this module supports automated spike detection based on a widely used unsupervised algorithm proposed by Quiroga et al. in 2004 [19].
Recording starts Time Recording ends
Analog signals
channel 120 121 122
Analogentity
Spikes
23
24
25 channel
Spikes
Spikeentity trial 1 trial 2 trial 3 … … … trial n
Experimental settings Behavioral responses
trial on fixation acq stimulus on orientation:10° freq: 20 Hz button press trial off
Evententity
Commententity trial 2
&
Fig. 1 The principle for data standardization in a typical electrophysiological experiment. The experiment
normally runs in a trial-by-trial manner, so the data collected must include the experimental settings defining
the conditions in each trial and the behavioral and neuronal responses. These data can be divided into Event,
Comment, Spike and Analog entities. The Event entity represents the occurrence of specific events, such as
a stimulus is turned on or a button is pressed (green bar in the top panel). The Comment entity contains
information that defines the experimental settings, such as the orientation of the stimulus in each trial (blue
bar in the top panel). The Spike entity records the action potentials (middle panel), and the Analog entity
SpikeSorting
The SpikeSorting module is for resorting spikes with a GUI. In the current design, it sup-ports both automated and manual sorting. The algorithm for automated sorting is an unsupervised method based on wavelet analysis and superparamagnetic clustering [19, 20]. In cases when users are not satisfied with the result of automated sorting, we pro-vide additional manual options: the window discriminator and the principal component analysis (PCA) discriminator. Users can either use the line widget to select waveforms or the polygon widget to select data points for re-sorting. We also provide a 3D view of the first three principal components. This 3D space can be rotated, zoomed in, and zoomed out to reveal the distribution density of the data set in this space with appropri-ate transparency.
Parameters/responses/recorded data
Tr
ial number
Raw data
Analog entity Spike entity Event entity Comment entity
Split data into individual trials
Align data to a specific event
Sort data according to given conditions
Spike LFP Behavior
(Plots & Statistics) SpikeSorting
AnalogFilter
SpikeDetection
Window discriminato
r
PC
A
Threshol
d
Wa
veform
Band pass / Band stop
Analyze & Display
Population Analysis
Save temporary results
Import & Convert
Saccade detection TransFile
Graphics
PopuAnalysis
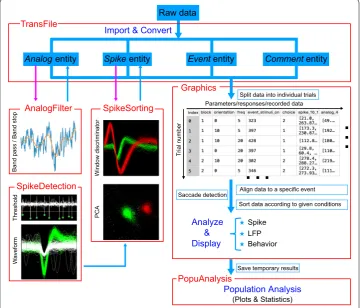
Fig. 2 The six major modules of NeoAnalysis and their functions. Each panel represents one module, and
arrows indicate the general workflow. The TransFile module is used to import data from any of the supported
formats and extract the data to Analog, Spike, Event and Comment entities, and then convert to a
AnalogFilter
The AnalogFilter is used to filter the Analog data using common filters including band-pass, band-stop, low-band-pass, and high-pass filters. For each of these filters, users can select the filter method from the available list including Chebyshev I, Chebyshev II, Cauer/ Elliptic, and Bessel/Thomson. In addition, users can define their own filters. The current design provides a GUI window for users to perform filtering. Alternatively, users can also use command scripts.
Graphics
The graphics is a module used for data visualization and analysis. In our design, this module first groups data into a table on a trial-by-trial basis according to experimental conditions, and then allows users to perform analyses such as plotting PSTH. In the data table, a row represents a trial, and a column represents a specific type of data, such as stimulus onset time, offset time, reaction time, spike, and LFP. There is also an available option to customize the table to include only selected trials using specific settings (speci-fied by the parameter ‘limit’). This is very useful when you only want to analyze a portion of the data. For the data in the table, the graphics module can do more than just plot the whole group of data; it can also sort the data according to the given conditions (specified by the parameter ‘sort_by’). The sorting function here supports up to two levels of condi-tioning. For example, one experiment studies the difference in orientation tuning using grating stimuli of different spatial frequencies. Suppose there are two spatial frequencies and eight orientations, then the sorting function can classify the results into two major categories, each category containing eight conditions. For spike train analysis, the graph-ics module provides functions to draw raster, PSTH, and the accumulated spike counts; for analog data (e.g. LFP), the graphics module can draw the average signals and perform spectrum analysis or a time–frequency analysis; for behavioral responses (e.g. choices, reaction times), the graphics module provides several general-purpose functions to ana-lyze scalar values. Additionally, the graphics module provides functions to calibrate eye position, to detect saccades, and to extract saccade information. For all of these ses, the results can be stored in a workspace for further analysis (e.g. population analy-sis). The graphics module does not provide any GUI for the aforementioned functions. Instead, users need to type their commands through the Python command window in order to run a specific function. All of the functions provided here have several open-ing settopen-ings, and users can easily change these parameters to obtain the required results. Therefore, the commands are more flexible in terms of analyzing complex electrophysi-ological data.
PopuAnalysis
In addition, this module provides several commonly used statistical functions including descriptive statistics, t test, and ANOVA.
Features and capabilities
Following the design principles, NeoAnalysis has the following features:
• NeoAnalysis supports most data formats from the major commercial data acquisi-tion systems through combining the Neo package [a powerful open-source module for data input/output (I/O)] [11].
• NeoAnalysis provides user-friendly GUIs and data viewing through integrating the open-source module PyQtGraph [21]. The PyQtGraph is a Python based graphics and GUI library, which uses less memory and performs much more efficiently than simply using the embedded graphic library ‘matplotlib’ [22]. Furthermore, NeoAnal-ysis puts a lot of emphasis on user interaction design. In particular, it provides several easy-to-use widgets for offline spike sorting.
• NeoAnalysis groups all of the experimental information, including the recorded sig-nals, behavioral responses, and the results of preprocessing into a table on a trial-by-trial basis. This informative table can be easily displayed and can be further sorted according to given conditions (e.g. experimental conditions). Furthermore, Neo-Analysis provides many other functions to manipulate the table and run the further analysis.
• NeoAnalysis provides a complete workflow for electrophysiological data analysis, which covers data standardizing, data preprocessing, single unit analysis, data stor-age, and population data analysis. Throughout the entire data analysis process, users do not have to switch between different programs and toolboxes. More important, NeoAnalysis takes into account the experimental conditions and supports analyzing with automatic condition sorting. Therefore, users can obtain sorted results by sim-ply specifying parameters in the commands without writing additional scripts.
• NeoAnalysis is capable of processing eye movement information, including calibrat-ing eye position and detectcalibrat-ing saccades. Durcalibrat-ing experiments, when recordcalibrat-ing eye movement trajectories, it is essential to detect the occurrence of saccades and to extract the relevant information. Previous open-source toolboxes generally do not provide such functions.
• Due to the incompatibilities between Python 2.7 and Python 3.5, NeoAnalysis pro-vides two slightly different versions for these two releases.
Results
Procedures of analysis using NeoAnalysis
After successfully installing NeoAnalysis1, users can use the toolbox following the proce-dures depicted in Fig. 2. A step-by-step tutorial can be found in the user manual.2 In brief,
1 The NeoAnalysis v.1.0.0 can be freely downloaded from https://github.com/neoanalysis/NeoAnalysis.
users first import the raw data of any supported format and convert to HDF5 format. Then users can perform spike detection (see Additional file 1), spike sorting and/or signal filter-ing on the converted data. Next, if the experiment includes data regardfilter-ing eye movement, users can perform saccade detection and extraction. Otherwise, users can begin to analyze spike trains, LFPs, and other behavioral data using the corresponding plotting functions. The results of each analysis session can be saved for future use. If users want to analyze the data for a population of neurons, NeoAnalysis can retrieve the saved workspace and per-form analysis and statistics across the data gathered for an entire population.
Spike sorting
Offline spike sorting can be done using the SpikeSorting module. The following codes are used in order to start the module with a 3D view:
button to start over. An additional movie shows this procedure in more detail (see Addi-tional file 2).
Single unit analysis
The graphics module of NeoAnalysis provides users several useful functions to perform the basic analysis. A remarkable feature of these functions is that they are all equipped with a powerful ‘sort_by’ option, which allows users to obtain results according to the
Sliding window Segment
widget
Polygon widget Automated sorting
Manual sorting Spike channel
Load/Save data PCA components to display
a
b
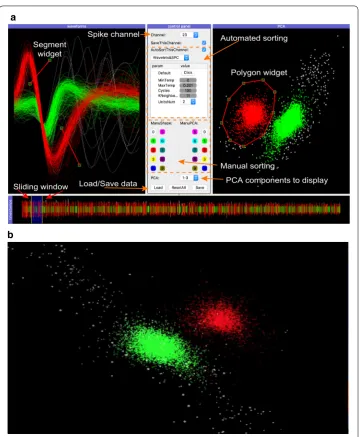
Fig. 3 The graphic user interfaces for offline spike sorting. a The main interface, in which the center shows
the control panel for major operations; the bottom panel shows all spikes in the selected channel with a sliding window to select a portion of spikes; the left panel shows the waveforms of the selected spikes, and the right panel shows the principal components of all spikes in the selected channel. Users can check the AutoSortThisChannel box to start automated sorting. In addition, users can use the segment widget (two red lines with square ends) to select waveforms or use the polygon widget (red polygon with square nodes) to
select data points for re-sorting. b A 3D view to display the first three principal components of all spikes in
experimental conditions (see “Design principles”). The graphics module first provides users a data table that includes all of the experimental information and the recorded sig-nals on a trial-by-trial basis. Then, through the use of the ‘sort_by’ option in combination with other settings, users can obtain the required results without having to write com-plex codes. The following command lines illustrate how the graphics module computes PSTH, plots raster and calculates spike counts.
In the Python console window, run the following codes:
In line 1, the graphics module from NeoAnalysis is imported for single unit analysis. Line 3 defines the path and the filename of the data. Line 4 initiates the graphics class by setting the parameters filename, trial_start_mark and comment_expr. The trial_start_ mark is the marker representing the start of a trial, which is used to separate the raw data into different trials. The comment_expr tells the program how the experimental conditions and parameters are stored in the data. In this example data, the experimen-tal condition (here is ‘patch_direction’) and the setting of each trial (here is a value in degree) are stored together as a comment entity with a semicolon in between (i.e. ‘patch_ direction:degree’). By setting the comment_expr as ‘key:value’, the program decodes the key as ‘patch_direction’, and the value for a particular trial is the degree of that trial. This option provides users the flexibility to store their experimental parameters. After this step, all data are reorganized into an informative data table on a trial-by-trial basis, which can be displayed using the code in line 5. A portion of the table is shown in the graphics panel of Fig. 2.
Considering that experimental conditions are stored as ‘string’ in the data, converting them to ‘numeric’ will make the sorting faster during conditioning, as the data are sorted by their logical orders. This is done using the code in line 6.
Raster with accumulated PSTH can be plotted using the function in line 7. Most parameters, including bin_size, overlap, Mean, Sigma, filter_nan, and fig_column have default values, which means that users do not necessarily have to input these param-eters if they do not have particular requirements. Users do need to define the paramparam-eters
spike channel and the unit order, in case there are multiple units recorded. The sort_by
parameter defines which experimental conditions are used to sort the data. The align_ to parameter defines which event marker is used to align the data. In this example, the event marker ‘event_64721’ represents the onset time of the visual stimuli. The pre_time
and post_time parameters represent the time range (relative to the align_to parameter) selected for the analysis. The bin_size and overlap parameters represent the bin width for computing the PSTH and the overlap between two adjacent bins. The Mean and Sigma
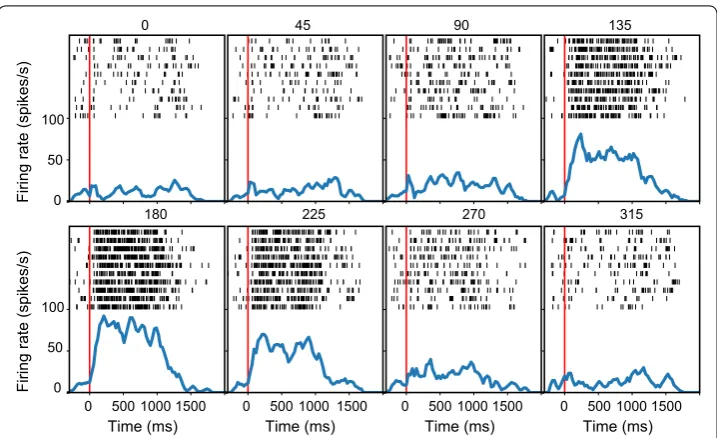
define the Gaussian kernel for data smoothing. The output of line 7 is shown in Fig. 4, which shows the smoothed PSTH at the bottom and the raster at the top of each panel. Notably, this function does not just plot a figure, it also allows for plotting the results according to the required experimental conditions.
The command in the line 8 plots the spike counts during the period defined by the parameter timebin. Other parameters use the same convention as in line 7. The output of this command is shown in Fig. 5, which shows the direction tuning of this example neuron.
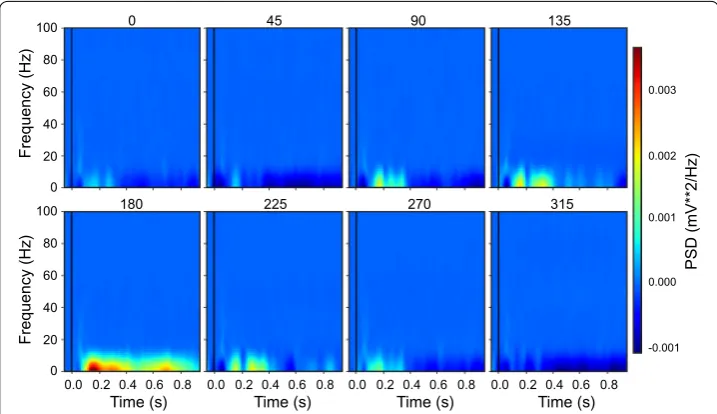
Spectrum analysis
A common analysis for LFP is to plot the spectrogram. The graphics module provides several functions to perform the spectrum analysis using the periodogram method [23]. For example, the function below plots the time–frequency spectrum of LFP for the low frequency domain (< 100 Hz):
Time (ms)
Firing rate (spikes/s
)
Time (ms) Time (ms) Time (ms)
Firing rate (spikes/s)
0 45 90 135
180 225 270 315
0 500 1000 1500 0 500 1000 1500 0 500 1000 1500 0 500 1000 1500
0 50 100 0 50 100
Fig. 4 The raster plots for the sample data generated by the graphics module. Each panel represents the
response to one condition defined by the setting sort_by (here is the drifting direction of the random dot
This function sorts the data in channel ‘analog_26’ using the patch_direction param-eter, and the time window defined by pre_time and post_time. Setting the color_bar to be ‘True’ turns on the scale bar. By default, the function uses a ‘hann’ window to calculate the density across the time–frequency domain. Users can refer to the manual for more details about the available options. The result is shown in Fig. 6.
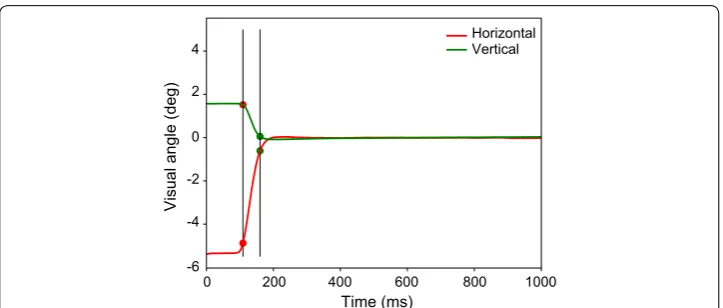
Saccade detection
NeoAnalysis provides a function called find_saccade to detect saccades. The algorithm for saccade detection in this function is based on setting thresholds for eye movement speed, duration, and distance [24]. These parameters have already been set to optimal values, according to our experience; however, users can reset these parameters if the default settings do not satisfy their needs. The results of saccade detection contain infor-mation regarding when and where a saccade starts and ends, as well as the amplitude
0 45 90 135 180 225 270 315 10
20 30 40 50 60 70
Spike counts
patch_direction (degree)
Fig. 5 The line plot of the spike counts for the sample data. Each point represents the spike count within a
given period for one condition defined by the user (same as Fig. 4)
0 45 90 135
180 225 270 315
0.0 0.2 0.4 0.6 0.8 0.0 0.2 0.4 0.6 0.8 0.0 0.2 0.4 0.6 0.8 0.0 0.2 0.4 0.6 0.8 0
20 40 60 80 100 0 20 40 60 80 100
-0.001 0.000 0.001 0.002 0.003
Time (s) Time (s) Time (s) Time (s)
Frequency (Hz)
Frequency (Hz)
PSD (mV**2/Hz)
Fig. 6 The time–frequency analysis for the sample data using the graphics module. The function analyzes
the power density over the low-frequency domain (< 100 Hz) during a given period. Each panel represents
of the saccade. This information is also added to the aforementioned data table that contains all of the experimental settings and recorded signals. In addition, NeoAnalysis provides another function called choose_saccade, which can be used to select saccades during a given period of time and/or within a certain range of amplitude. An example of saccade detection is illustrated in Fig. 7, in which the black vertical lines indicate the start and end times, and the red and green spots indicate the start and end positions of the detected saccade, respectively.
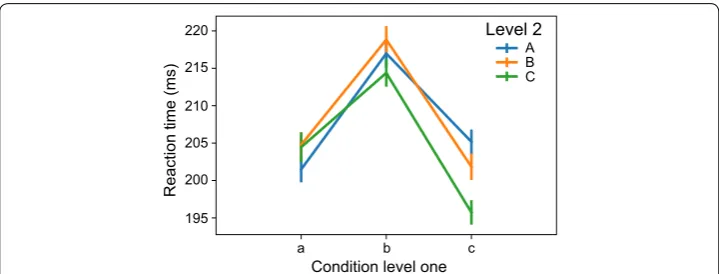
Data analysis at population level
The results obtained from the analysis discussed above can be stored in a workspace for each recording session. NeoAnalysis then provides a module, named PopuAnalysis, to analyze the population data across all sessions. In the following example, we illustrate how to use this module to analyze behavioral and electrophysiological data at the popu-lation level using a simulated workspace named ‘sample_workspace.h5’.
Using the codes above, first the workspace in the data folder is loaded (line 1-3), and then the mean reaction time is computed for the different experimental conditions with line plot displays (line 4). The parameter store_key in line 4 defines which data will be analyzed in the workspace, and the parameter conditions defines the conditions for data sorting. In this example, there are two levels of conditions, with each level containing three factors (‘a’, ‘b’, ‘c’ and ‘A’, ‘B’, ‘C’ for level 1 and level 2, respectively). The result of this analysis is shown in Fig. 8.
Visual angle (deg)
Time (ms)
Horizontal Vertical
0 200 400 600 800 1000
-4 -2 0 2 4
-6
Fig. 7 An example of the saccade detection using the graphics module. The red and green lines represent
For spike train analysis at the population level, the function plot_spike is used:
The command line above compares the neuronal activities among four experimental conditions: (‘a’, ‘A’), (‘a’, ‘B’), (‘b’, ‘A’) and (‘b’, ‘B’). The parameter store_key defines the data to be analyzed. If the parameter normalize is set to be True, the neuronal activities from different neurons will be normalized before calculating the mean responses. The
fig_mark denotes where to put the vertical reference lines to indicate specific events (e.g. stimulus onset). The error_style sets the error bar style in the figure and ci sets the confi-dence interval. The result of this command is shown in Fig. 9.
Discussion
Comparison with other toolboxes
We have illustrated the implementation of the NeoAnalysis toolbox, which we have shown to be quite powerful and efficient as compared to other open-source packages.
a b c
195 200 205 210 215 220
Reaction
time (ms)
Condition level one
A B C Level 2
Fig. 8 The behavioral data analysis at the population level for the sample workspace. This example analyzes
the reaction time for three level 1 conditions (a, b, c) under three level 2 conditions (A, B, C). Error bar indi-cates SEM
(a, A) (a, B) (b, A) (b, B)
Time (ms)
Mean of normalized firing rate
-200 0 200 400 600 800 1000 1200 1400
0.8 0.7 0.6 0.5 0.4 0.3 0.2 0.1 0.0
Fig. 9 The mean firing rate of a population of neurons. This example shows the mean of the normalized
The NeoAnalysis covers the whole workflow for electrophysiological data analysis, while the Klusters [12] and the Spyke Viewer [13] can only perform a portion of the analy-sis. More important, NeoAnalysis can easily generate sorted results based on the given conditions (up to two levels) without writing additional scripts, while other toolboxes require users to manually sort data beforehand. Therefore, these ready for use functions provided by NeoAnalysis reduce the requirement for users’ scripting abilities and sub-stantially improve the analysis efficiency.
There is another open-source toolbox called OpenElectrophy [4], which has a similar scope as NeoAnalysis but does not provide specific analysis and statistic functions. Ope-nElectrophy uses MySQL, an open-source database, for data storage. Interacting with the data in the database is a challenge for users who are not familiar with structured query language (SQL). Furthermore, the data in the database is stored as tables and the relation between different tables is complex. Additionally, despite OpenElectrophy also supporting offline spike sorting, it differs from NeoAnalysis in several aspects: First, the data visualization in the SpikeSorting module of NeoAnalysis is developed based on the PyQtGraph [21], whereas the OpenElectrophy uses matplotlib [22]. Matplotlib is very slow and requires a vast amount of memory when plotting large amounts of data, thus is unsuitable for the visualization of large amounts of data. Second, the SpikeSorting mod-ule is more user-friendly. For example, it provides several easy-to-use widgets for the data selection process. In addition, the SpikeSorting module provides a 3D view to dis-play the first three principal components. Data in this 3D space are plotted with appro-priate transparency to reveal the data distribution density and users can interact with the 3D space using their mouse. In contrast, the 3D view provided by OpenElectrophy is unable to plot data in a transparent way and is not user-friendly.
Future directions
In addition to the current functions, the NeoAnalysis toolbox can be expanded in the following (but not limited to) directions to meet the more specific demands of different users. First, in addition to the current spike sorting methods, we will try to provide more options for users if they are not satisfied with the current methods. Second, more plot-ting functions for both electrophysiological and behavioral data analyses, as well as more statistical options will be added. Plotting functions are packed as sub-functions of the graphics module, and, if users would like to, they are encouraged to include their own functions. Third, considering that there is no GUI for the graphics and the PopuAnalysis modules, we will develop a GUI for users who are not comfortable using scripts (such as simple commands). Fourth, for users who may encounter data import problems, we will offer to help users develop interfaces to import data of any format. In summary, we wel-come users to interact with us to improve or modify the toolbox.
Conclusions
Abbreviations
PSTH: peristimulus time histogram; LFP: local field potential; I/O: input/output; GUI: graphic user interface; PCA: principal components analysis.
Authors’ contributions
BZ and JD designed the software and wrote code; BZ and JD wrote the manuscript; TZ supervised the project. All authors read and approved the final manuscript.
Author details
1 State Key Laboratory of Brain and Cognitive Sciences, Institute of Psychology, Chinese Academy of Sciences, Bei-jing 100101, China. 2 Department of Psychology, University of Chinese Academy of Sciences, Beijing 100049, China. 3 Shenzhen Key Lab of Neuropsychiatric Modulation and Collaborative Innovation Center for Brain Science, CAS Center for Excellence in Brain Science and Intelligence Technology, the Brain Cognition and Brain Disease Institute (BCBDI), Shenzhen Institutes of Advanced Technology, Chinese Academy of Science, Shenzhen 518055, China.
Acknowledgements
We thank Prof. Eytan Domany for kindly providing the C code for the Superparamagnetic Clustering. We thank Shenbing Kuang, Shengguang Li for helpful discussions, and we also thank Yan Yang for providing the test data.
Competing interests
The authors declare that they have no competing interests. Availability of data and materials
The datasets and demo codes generated and/or analyzed during the current study are available in the GitHub reposi-tory, https://github.com/neoanalysis/NeoAnalysis_sample_data.
The NeoAnalysis program and its manual are freely available at: https://github.com/neoanalysis/NeoAnalysis.
Consent for publication Not applicable.
Ethics approval and consent to participate Not applicable.
Funding
This work was supported by the National Natural Science Foundation of China (31271175 to TZ, 31600870 to JD), the Scientific Foundation of Institute of Psychology, Chinese Academy of Sciences (Y5CX112005 to JD), and the Youth Inno-vation Promotion Association CAS (2017120 to JD).
Publisher’s Note
Springer Nature remains neutral with regard to jurisdictional claims in published maps and institutional affiliations.
Received: 18 July 2017 Accepted: 3 November 2017
References
1. Stevenson IH, Kording KP. How advances in neural recording affect data analysis. Nat Neurosci. 2011;14(2):139–42. 2. Muller E, Bednar JA, Diesmann M, Gewaltig MO, Hines M, Davison AP. Python in neuroscience. Front Neuroinform.
2015;9:11.
3. Ince RA, Mazzoni A, Petersen RS, Panzeri S. Open source tools for the information theoretic analysis of neural data. Front Neurosci. 2010. https://doi.org/10.3389/neuro.01.011.2010.
4. Garcia S, Fourcaud-Trocme N. OpenElectrophy: an electrophysiological data- and analysis-sharing framework. Front Neuroinform. 2009;3:14.
5. Offline Sorter| Plexon. http://www.plexon.com/products/offline-sorter. Accessed 9 Nov 2017.
6. NeuroExplorer—data analysis software for neurophysiology. http://www.neuroexplorer.com/. Accessed 9 Nov 2017. 7. Goldberg DH, Victor JD, Gardner EP, Gardner D. Spike train analysis toolkit: enabling wider application of
informa-tion-theoretic techniques to neurophysiology. Neuroinformatics. 2009;7(3):165–78. Additional files
Additional file 1. Demo of spike detection. This movie illustrates how to use the SpikeDetection module to detect spikes from the sample data.
• We accept pre-submission inquiries
• Our selector tool helps you to find the most relevant journal • We provide round the clock customer support
• Convenient online submission • Thorough peer review
• Inclusion in PubMed and all major indexing services • Maximum visibility for your research
Submit your manuscript at www.biomedcentral.com/submit
Submit your next manuscript to BioMed Central
and we will help you at every step:
8. Meier R, Egert U, Aertsen A, Nawrot MP. FIND—a unified framework for neural data analysis. Neural Netw. 2008;21(8):1085–93.
9. Bokil H, Andrews P, Kulkarni JE, Mehta S, Mitra PP. Chronux: a platform for analyzing neural signals. J Neurosci Meth-ods. 2010;192(1):146–51.
10. McKinney W. pandas: a foundational Python library for data analysis and statistics. In: Python for High Performance and Scientific Computing, Tsukuba, Japan, 1–3 June 2011. p. 1–9.
11. Garcia S, Guarino D, Jaillet F, Jennings T, Propper R, Rautenberg PL, Rodgers CC, Sobolev A, Wachtler T, Yger P, Davi-son AP. Neo: an object model for handling electrophysiology data in multiple formats. Front Neuroinform. 2014;8:10. 12. Hazan L, Zugaro M, Buzsaki G. Klusters, NeuroScope, NDManager: a free software suite for neurophysiological data
processing and visualization. J Neurosci Methods. 2006;155(2):207–16.
13. Propper R, Obermayer K. Spyke viewer: a flexible and extensible platform for electrophysiological data analysis. Front Neuroinform. 2013;7:26.
14. Yegenoglu A, Denker M, Phan LD, Holstein D, Chorley P, Ito J, Jennings T, Meyes R, Quaglio P, Rostami V, et al. Elephant—open-source tool for the analysis of electrophysiological data sets. In: Bernstein Conference; Heidelberg, Germany; 2015. p. 134–5.
15. Dai J, Brooks DI, Sheinberg DL. Optogenetic and electrical microstimulation systematically bias visuospatial choice in primates. Curr Biol. 2014;24(1):63–9.
16. Noton D, Stark L. Scanpaths in eye movements during pattern perception. Science. 1971;171(3968):308–11. 17. Folk M, Cheng A, Yates K. HDF5: a file format and I/O library for high performance computing applications. In:
Pro-ceedings of Supercomputing; 1999. p. 5–33.
18. Lewicki MS. A review of methods for spike sorting: the detection and classification of neural action potentials. Network. 1998;9(4):R53–78.
19. Quiroga RQ, Nadasdy Z, Ben-Shaul Y. Unsupervised spike detection and sorting with wavelets and superparamag-netic clustering. Neural Comput. 2004;16(8):1661–87.
20. Blatt M, Wiseman S, Domany E. Superparamagnetic clustering of data. Phys Rev Lett. 1996;76(18):3251–4. 21. PyQtGraph—scientific graphics and GUI Library for Python. http://www.pyqtgraph.org/. Accessed 9 Nov 2017. 22. Hunter J. Matplotlib: a 2D graphics environment. Comput Sci Eng. 2007;9(3):90–5.
23. scipy.signal.periodogram—SciPy v0.13.0 reference guide.
https://docs.scipy.org/doc/scipy-0.13.0/reference/gener-ated/scipy.signal.periodogram.html. Accessed 9 Nov 2017.