Biological Procedures Online • Vol. 5 No. 1 • May 1, 2003 • www.biologicalprocedures.com
© 2003. Biological Procedures Online. Published in Biological Procedures Online under license from the author(s). Copying, printing, redistribution and storage permitted.
Measuring Solution Viscosity and its Effect on Enzyme Activity
Salvador Uribe
2and José G. Sampedro
1*1Área Académica de Nutrición, Instituto de Ciencias de la Salud ICSA, Universidad Autónoma del Estado de Hidalgo (UAEH).
Abasolo 600, C.P 42000. Pachuca, Hidalgo. Mexico.
2Departamento de Bioquímica, Instituto de Fisiología Celular, Universidad Nacional Autónoma de México (UNAM). A.P. 70-242,
04510 Mexico City, Mexico.
*To whom correspondence should be addressed: José G. Sampedro, Área Académica de Nutrición, Instituto de Ciencias de la Salud ICSA, Universidad Autónoma del Estado de Hidalgo (UAEH). Abasolo 600, C.P 42000. Pachuca, Hidalgo. México. Tel: (5277) 1717 2000 ext. 5102; Fax: (5277) 1717 2000 ext. 5111; Email: [email protected]
Submitted: January 17, 2003; Revised: March 26, 2003; Accepted: March 29, 2003; Published: May 1, 2003
Indexing terms: Viscosity, Trehalose.
Abbreviations: EGTA, Ethylene glycol-bis(beta-aminoethyl ether)-N,N,N’,N’,-tetraacetic acid; PIPES, Piperazine-N,N ’-bis(2-ethanesulfonic acid); Tris, Tris(hydroxymethyl)aminomethane; SDS-PAGE, Sodium-dodecyl-sulphate-Polyacrylamide Gel Electrophoresis; YPD, Yeast-Peptone-Dextrose.
ABSTRACT
In proteins, some processes require conformational changes involving structural domain diffusion. Among these processes are protein folding, unfolding and enzyme catalysis. During catalysis some enzymes undergo large conformational changes as they progress through the catalytic cycle. According to Kramers theory, solvent viscosity results in friction against proteins in solution, and this should result in decreased motion, inhibiting catalysis in motile enzymes. Solution viscosity was increased by adding increasing concentrations of glycerol, sucrose and trehalose, resulting in a decrease in the reaction rate of the H+-ATPase from the plasma membrane of Kluyveromyces lactis. A direct correlation was found between viscosity (η) and the inhibition of the maximum rate of catalysis (Vmax). The protocol used to measure viscosity by
means of a falling ball type viscometer is described, together with the determination of enzyme kinetics and the application of Kramers’ equation to evaluate the effect of viscosity on the rate of ATP hydrolysis by the H+-ATPase.
INTRODUCTION
In proteins, processes involving conformational change are slowed by medium viscosity (1). The effect of viscosity on the
rate of protein-dependent chemical reactions was originally described by Kramers (2). Kramers’ treatment was applied to protein folding and to other protein processes involving structural movements, such as folding or catalysis (3, 4). Following synthesis, proteins acquire a number of different conformations before reaching the “native” form. Likewise, denaturing involves passage through different unfolded states (5). In enzymes, during catalysis or ligand binding conformational changes occur, at least in the active site (6). Furthermore, many enzymes may exhibit widely different structural conformations, distinguishable by protease sensitivity, antibody recognition, circular dichroism or fluorescence (7). Thus, according to Kramers’ theory, enzymes alternating between widely different conformations during catalysis should be inhibited by viscosity (1). One such case is carbon-monoxy-myoglobin embedded in a trehalose glass matrix, where trehalose inhibits the release of carbon monoxide (8).
The E1E2-ATPases undergo large conformational changes
during catalysis as they alternate between states E1 and E2 (9).
Indeed, states E1 and E2 exhibit different sensitivity to proteases
and antibodies (10). Thus, the isolated E1E2, H+-ATPase (EC
glycerol increased solvent viscosity while inhibiting the H+
-ATPase, mainly through a decrease in Vmax (11). In addition,
increasing the temperature resulted in diminished effects viscosity on the Vmax (11). Here, the method used to measure
viscosity, the determination of enzyme kinetics and the application of Kramers’ theory to evaluate the effect of viscosity on enzyme activity are described in detail.
MATERIALS AND METHODS
Reagents
Trehalose, ATP-disodium salt, pyruvate kinase-type II from rabbit muscle, lactate dehydrogenase-type XI from rabbit muscle, sodium azide, NADH, and phosphoenolpyruvate mono-(cyclohexylammonium) salt were from Sigma Chemical Co. (St. Louis, MO). All other reagents were of the best quality available commercially.
Purification of the H
+-ATPase
The yeast K. lactis strain WM27 was grown in YPD medium at 30ºC for 20 h and then the cells were harvested at midlog phase by centrifugation. Yeast walls were digested using zymolyase-20T (20 units/g wet weight) for 1 to 2 h at 30ºC until spheroplasts were detected. The plasma membrane was obtained from sonicated spheroplasts and was isolated by differential centrifugation. The H+-ATPase was purified from
the plasma membrane as described by Bowman et al. (12) and modified by Guerra et al. (13). The ATPase was suspended in a small volume of 1 mM EGTA-Tris, pH 7.0, and kept at -70ºC until used. On SDS-PAGE, the 100,000 Mr band corresponding
to the plasma membrane H+-ATPase was about 50% of the
total protein. At 20ºC, the H+-ATPase specific activity was
6.91 ± 0.3 µmol ATP(mg protein·min)-1. Protein concentration
was determined as in Lowry et al. (14).
Viscosity measurements (See Protocol 1)
A falling ball type viscometer (Gilmont Instruments, Il, USA), mounted in a constant-temperature chamber was employed. Carbohydrate solutions were prepared in 10 mM PIPES, pH 7.0. The viscometer was filled with each solution, degassed by vacuum application and allowed to equilibrate at each temperature for 10 min. Once the assay temperature was reached, the time of ball descent was measured and the viscosity was calculated as in (11) using equation [eq 1]:
η = K·(δb-δl)·t [1]
where η is the viscosity in cP, K is the viscometer constant (we used a value of 0.3), δb is the density of the ball (2.53), δl is the
density of the liquid (g/ml) and t is the time of ball descent. The density of the solutions were measured by weighing 1 ml of the given solution at the test temperature. Experimental data
were reproducible and standard deviations were smaller than 1%.
H
+-ATPase activity measurements (See Protocol
2)
ATP saturation kinetics were evaluated using an enzyme-coupled assay (15). The reaction mixture was 10 mM Pipes, pH 7.0, 80 mM KCl, 5 mM sodium azide, 5 mM phosphoenolpyruvate, 200 µM NADH, 12.5 IU pyruvate kinase, 10.45 IU lactate dehydrogenase and 5 mM MgCl2. ATP
(0.25 – 5.0 mM) and/or the viscosogenic agent at the final concentration indicated. To start the reaction the ATPase was added (4.3 µg prot in 4 µl). Absorbance decrease was recorded at 340 nm in an Aminco DW2000 spectrophotometer in split mode, equipped with a thermostated cell. Initial velocities for ATP hydrolysis were calculated from the slope value by using and NADH extinction coefficient of 6,200 M-1 cm-1. The ATP
hydrolysis activity was expressed as micromoles of ATP hydrolyzed per milligram protein per minute. Neither viscosity nor temperature inhibited the enzyme-coupled assay to an extent where the H+-ATPase activity ceased to be the limiting
step.
Analysis of enzyme kinetics
Initial velocities of ATP hydrolysis were plotted against the concentration of ATP. The iterative program Microcal Origin 6.0® (Microcal Software Inc. MA) was used to analyse the data
by non-linear regression. The Hill equation [eq 2] which describes a cooperative behaviour for enzyme kinetics was used in the fitting of the initial velocity data:
v = Vmax ·S n / ( S0.5 n + S n) [2]
where v is the initial velocity, Vmax is the maximum velocity, S
is the concentration of the varied substrate, S0.5 is the substrate
concentration where v = 0.5Vmax and n is the Hill coefficient
which in some cases describes the probable number of active sites.
The Arrhenius relation, normally used in biochemistry, does not contain a term that accounts for the restricting effect of molecular motions by the medium on the rate of a given reaction. In this regard, Kramers’ theory has been used to describe the effect of viscosity on the behavior of protein reactions where conformational changes are involved (1): in a diffusion dependent, enzyme-catalyzed reaction [eq 3], where the substrate binds to the enzyme to yield the product
Ks kcat
S + E ↔ ES E + P [3]
the rate of product formation (kcat) is inhibited by the friction of
turn, friction is a function of viscosity η. Thus, the reaction rate constant depends linearly on η as showed in equation [eq 4] as described by Jacob and Schmid (1)
k= η-1 exp (- ∆U/RT) [4]
where k is the rate constant for the reaction (kcat or Vmax for
enzyme catalyzed reactions), η is the macroscopic viscosity of the solvent, R is the gas constant (8.314 J (K mol)-1), T is the
absolute temperatureand ∆U is the free energy barrier imposed by solvent friction. At a fixed temperature, any increase in viscosity would be expected to result in an increase in ∆U. When plotting Vmax versus η-1 a straight line is obtained which
has a slope of 1, indicating that at the given temperature, there is a complete dependence of the rate of reaction on solution viscosity. In cases where friction does not exist, the reaction rate depends solely on the true activation energy and on temperature; thus η is replaced by the time constant (τ) or, as
τ=k0-1, by k0-1 (1). To assess whether the catalytic activity of
the H+-ATPase is inhibited by viscosity as predicted by
Kramers’ relation (1), the Vmax data, defined as Vmax0/Vmax were
plotted against the solvent relative viscosity, defined as η/η0.
Where Vmax0 and η0 are respectively the Vmax and the viscosity
in the absence of trehalose and Vmax and η are the observed
values at each trehalose concentration.
RESULTS AND DISCUSSION
Trehalose, sucrose and glycerol inhibit the
K.
lactis
plasma membrane H
+-ATPase
The study of protein dynamics and function upon variation on external factors is an important task (1). Medium viscosity and hydration exert diverse effects on protein structure and function; the thin hydration layer surrounding the protein is most important for these effects (16). In addition, diverse solutes contribute to these effects, depending on their chemical and viscosogenic properties (16). In some cells, the viscosogenic molecules trehalose, sucrose and glycerol accumulate in the cytoplasm in response to different conditions, such as heat or desiccation (11). This accumulation probably modifies reaction rates in vivo (11). In order to evaluate the role of viscosity on enzyme activity, it was decided to measure the activity of the H+-ATPase at 20°C in
the absence and in the presence of viscosogenic agent. In the absence of additions, the kinetic parameters for the H+-ATPase
were Vmax= 6.91 µmols·mg prot-1·min-1, S0.5= 1.08 mM and n=
1.7 (Table 3). Then, in the presence of increasing concentrations of trehalose, sucrose or glycerol, inhibition of the H+-ATPase activity was observed. Inhibition was reflected
as both a decrease in Vmax and an increase in S0.5 (Table 3),
while n was not modified. The Vmax values decreased at all the
viscosogenic agent concentrations tested while S0.5 values were
not significantly affected at the lower concentrations (Table 3). These results indicated that the viscosogenic agent-mediated inhibition was not that of a classical enzyme inhibitor which
needs to bind to a specific site of the enzyme and thus, the kinetic parameters of this inhibition were not linear, but instead these agents acted by modifying the whole environment around the protein in a concentration dependent fashion (16), In this sense, it has been reported that the oxygen affinity of hemoglobin decreases linearly with the chemical potential of water as a result of the osmotic effect of the solutes: sucrose, stachyose and PEG (150 and 400) without affecting the Hill coefficient (17). In this study, it was suggested that dehydration of the active site structure diminished affinity for the ligands. In hemoglobin, the binding of 60 water molecules is required in order for the protein to reach the fully oxygenated state (17). In a study on fumarase it was proposed that the dissociation of the product from the active site requires the replacement by water molecules and that in the presence of glycerol and sucrose, water becomes less available in the medium, resulting in the rebinding of the product to the active site (18).
Correlation between viscosity and H
+-ATPase
inhibition
If a reaction obeys Kramers’ theory, a linear relationship should be observed when plotting the rate constant of the reaction against solution viscosity [eq 4]. In order to evaluate the role of viscosity on the rate of ATP hydrolysis by the H+
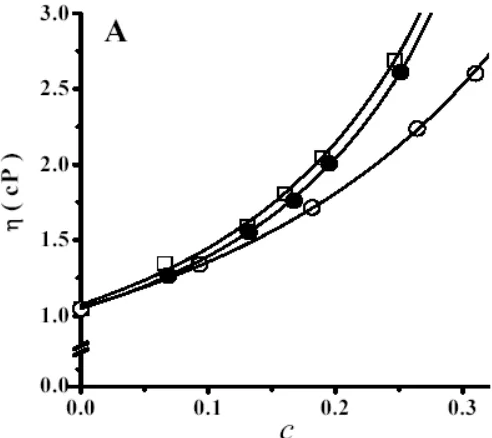
-ATPase, the viscosity of solutions containing increasing concentrations of trehalose, sucrose or glycerol was measured (Fig. 1A). Viscosity increased exponentially with the concentration of each viscosogenic agent (Fig. 1A).
Fig. 1A: Effect of solute concentration on medium viscosity. The viscosity (η) at a given concentration of carbohydrate (expressed as mass fraction, c) was measured in a falling ball viscometer at 20°C as described in methods.
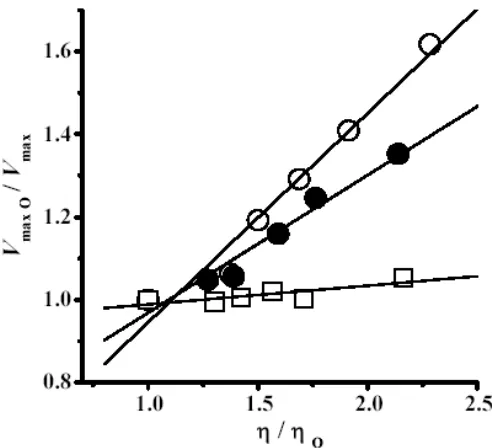
Then, the change in the relative Vmax values (Vmax0/Vmax)
(η/η0), as described by Jacob and Schmid (1) (Fig. 1B). In Fig.
1B, it may be observed that a linear correlation could be established between the change in viscosity and the change in enzyme Vmax. In addition, while both sucrose and trehalose
behaved similarly, the inhibition of the enzyme was higher in the case of glycerol (Fig. 1B).
Fig. 1B: Solution viscosity (η) inhibits the plasma membrane H+-ATPase.
The Vmax at a given concentration of solute was calculated by measuring the
rate of ATP hydrolysis versus ATP concentration and fitting to the Hill equation [eq 2]. The relative Vmax (Vmax0/Vmax) was plotted against the relative
viscosity (η/η0). Both, η0 and Vmax0 are the solution viscosity and the maximum
velocity respectively in the absence of the viscosogenic agent: Glycerol {; Trehalose z; Sucrose .
This result is in agreement with those obtained with carbonic anhydrase, where it was observed that glycerol caused the largest kcat decrease in comparison with sucrose (19). In this
regard, it has been reported that these solutes (glycerol, sucrose and trehalose) induce preferential hydration of the protein (20). However, the mechanism by which hydration occurs seems to be different. For glycerol, preferential hydration is induced by a solvophobic effect, i.e. glycerol-protein surface interactions are unfavorable and thus glycerol tends to migrate away from proteins. In contrast, sucrose and trehalose are preferentially excluded through a decrease in the accessible surface of the carbohydrate induced by both a steric impediment and an increase in solution surface-tension (20).
Effect of temperature on viscosity and on the
viscosity-promoted inhibition of the H
+-ATPase
Increasing the temperature from 20 to 45°C led to a decrease in solution viscosity η both in the absence and in the presence of 0.5 M trehalose (Fig. 2). At 0.5 M trehalose, η was much higher than in the absence of trehalose. Then as temperature increased, these values decreased from η=1.7 cP at 20°C to η=
0.95 cP at 45°C. In the absence of trehalose, the same effect of temperature was observed, as viscosity decreased from η=1.0 at 20°C to η=0.6 cP at 45°C.
Fig. 2: Effect of temperature on viscosity. Viscosity solution was measured as described in Fig. 1 in the absence of trehalose ({) and in the presence of 0.5 M trehalose (z) at the indicated temperatures.
In order to determine whether temperature modulated the effects of viscosity on the activity of the H+-ATPase, a number
of solutions containing increasing concentrations of trehalose were studied at 20, 35 and 40°C. At each trehalose concentration and temperature, both the relative Vmax
(Vmax0/Vmax) and the relative viscosity values (η/η0) were
determined and plotted (Fig. 3).
Fig. 3: Temperature-mediated modulation of the effects of viscosity on the H+-ATPase. The V
concentrations and temperatures as described in methods. The relative Vmax
(Vmax0/Vmax) was plotted against the relative viscosity (η/η0). η0 is the viscosity
of the solution in the absence of trehalose and Vmax0 is the Vmax in the absence
of trehalose. Temperatures (°C): { 20, z 35 and 40. The solid lines are linear regressions of the data.
The correlation between (Vmax0/Vmax) and (η/η0) was linear at
all temperatures. However, at 20°C the effects of η on Vmax
were higher than at 35°C and this in turn exhibited higher effect than at 40°C. These results have been explained proposing that the energy required by the enzyme to overcome the viscosity-mediated inhibition may be provided by the increase in temperature (14, 16).
Solution viscosity was modified using increasing concentrations of the viscosogenic agents, trehalose, sucrose or glycerol. The rate of ATP hydrolysis catalysed by the H+
-ATPase was inhibited by viscosity as evidenced by the lower
Vmax values. It is suggested that whenever enzyme kinetics are
performed under conditions where viscosity and/or temperature vary, these parameters should be taken into account in order to interpret data properly.
ACKNOWLEDGMENTS
This work was partially funded by a grant from DGAPA-UNAM IN227202-3.
REFERENCES
1. Jacob M, Schmid FX. Protein folding as a diffusional process. Biochemistry 1999; 38:13773-13779.
2. Kramers HA. Brownian motion in a field of force and the diffusion model of chemical reactions. Physica 1940; 7:284-304.
3. Jacob M, Geeves M, Holterman G, Schmid FX. Diffusional crossing in a two-state protein folding reaction. Nature Struc Biol 1999; 6:923-926.
4. Demchenko AP, Ruskyn OI, Saburova EA. Kinetics of the lactate dehydrogenase reaction in high-viscosity media.
Biochim Biophys Acta 1989; 998: 196-203.
5. Zhang X, Beuron F, Freemont PS. Machinery of protein folding and unfolding. Curr Opin Struct Biol 2002; 12:231-238.
6. Frauenfelder H, Parak F, Young RD. Conformational substates in proteins. Annu Rev Biophys Biophys Chem
1988; 17:451-479.
7. van Mierlo CP, Steensma E. Protein folding and stability investigated by fluorescence, circular dichroism (CD), and nuclear magnetic resonance (NMR) spectroscopy: the flavodoxin story. J Biotechnol 2000; 79:281-298.
8. Cordone L, Galajda P, Vitrano E, Gassmann A, Ostermann A, Parak F. A reduction of protein specific motions in co-ligated myoglobin embedded in a trehalose glass. Eur Biophys J 1998; 27:173-176.
9. Toyoshima C, Takasako M, Nomura H, Ogawa H. Crystal structure of the calcium pump of sarcoplasmic reticulum at 2.6 Å resolution. Nature 2000; 405:647-655.
10. Nakamoto RK, Slayman CW. Molecular properties of the fungal plasma-membrane H+-ATPase. J Bioenerg Biomembr 1989; 21:621-632.
11. Sampedro JG, Muñoz-Clares RA, Uribe S. Trehalose-mediated inhibition of the plasma membrane H+-ATPase
from Kluyveromyces lactis: dependence on viscosity and temperature. J Bacteriol 2002; 184:4384-4391.
12. Bowman BJ, Slayman CW. The effects of vanadate on the plasma membrane ATPase of Neurospora crassa. J Biol Chem 1979; 254:2928-2934.
13. Guerra G, Uribe S, Pardo JP. Reactivity of the H+-ATPase
from Kluyveromyces lactis to sulfhydryl reagents. Arch Biochem Biophys 1995; 321:101-107.
14. Lowry OH, Rosenbrough NJ, Farr AL, Randall RJ. Protein measurement with the folin phenol reagent. J Biol Chem
1951; 193:265-275.
15. Anderson KW, Murphy AJ. Alterations in the structure of the ribose moiety of ATP reduce its effectiveness as a substrate for the sarcoplasmic reticulum ATPase. J Biol Chem 1983; 258:14276-14278.
16. Rampp M, Buttersack C, Ludemann HD. c,T-dependence of the viscosity and the self-diffusion coefficients in some aqueous carbohydrate solutions. Carbohydr Res 2000; 328:561-572.
17. Colombo MF, Rau DC, Parsegian A. Protein solvation in allosteric regulation:a water effect on hemoglobin. Science
1992; 256:655-659.
18. Sweet W, Blanchard JS. Fumarase:viscosity dependence of the kinetics parameters. Arch Biochem Biophys 1990; 277:196-202.
19. Pocker Y, Janjic N. Enzyme kinetics in solvent of increased viscosity. Dynamic aspects of carbonic anhydrase catalysis. Biochemistry 1990; 26:2597-2606. 20. Timasheff SN. The control of protein stability and
PROTOCOLS
Protocol 1: Measurement of Solution Viscosity
1. Prepare a 1 M stock solution of the viscosogenic agent to be tested, in buffer. 2. Prepare a solution of the buffer in the absence of the viscosogenic agent. 3. Mix both solutions to obtain the desired solute concentration.
4. Ensure there are no non-dissolved particles in the solution as these interfere with ball descent.
5. Fill up the viscometer, with approximately 5 ml. Ensure no bubbles are formed. If bubbles form, remove them using a glass fiber wire.
6. Keep the rest of the mixture in a sealed tube, as this will be used to determine density. 7. Subject the viscometer to vacuum pressure in order to de-gas the solution.
8. Add the ball and allow it to reach the bottom of the tube. Cap the viscometer using the adapter and secure it with the nut. 9. Insert the viscometer in the rubber stopper and use the latter to cap a Kitasato flask previously filled with water. The sealed
flask will constitute the constant temperature chamber (Fig. 4).
10. Circulate water from a circulating bath into the Kitasato flask and allow for temperature equilibration for approximately 10 min.
11. Ball descent is started by turning the Kitasato flask 180°. The viscometer must be vertical during descent of the ball.
12. A stopwatch is used to measure the time elapsed between the crossing of the ball through the first and through the second line (10 cm) of the viscometer.
13. Descent time may be measured again simply by rotating the flask 180°.
14. Calculate density by weighing 1 ml of the solution taken at the same temperature of viscosity determination. 15. Once density and time of descent are known, substitute these values into equation [eq 1] in methods.
Characteristics of the falling ball type viscometer
The viscometer is manufactured by Gilmont Instruments (a division of Barnant Company, Barrington, IL, USA). The tube (10 inches long and 1 inch in diameter) is made of high precision bore glass tubing with stabilizing beads. There are three different tube sizes, each one covering a different range of viscosity. Calibration constants are provided by the manufacturer.
Table 1: Viscometer sizes and Calibration Constants
Size No. Viscosity range in cP Viscometer constant K
1 0.2 - 10 0.3
2 2 - 10 3.3
3 20 -1000 35.0
The viscometer used in this study was size number 1. This viscometer was supplied with a glass ball (δb = 2.53) and a stainless
steel ball (δb = 8.02). The viscosity ranges covered by each ball type are 0.2 to 2 cP for the glass ball and 1 to 10 cP for the stainless
steel ball.
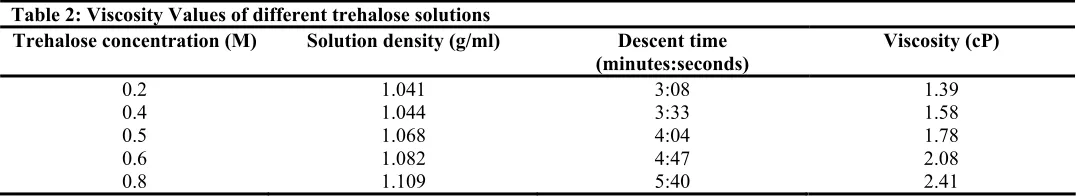
After being performed the measurements (solution density and descent time) for a given solution at the test temperature, these are used to calculate viscosity as described in equation [eq 1]. A typical calculation at 20°C for trehalose solutions was as follows:
Table 2: Viscosity Values of different trehalose solutions
Trehalose concentration (M) Solution density (g/ml) Descent time
(minutes:seconds)
Viscosity (cP)
0.2 0.4 0.5 0.6 0.8
1.041 1.044 1.068 1.082 1.109
3:08 3:33 4:04 4:47 5:40
1.39 1.58 1.78 2.08 2.41
Protocol 2: Coupled enzyme assay to determine the saturation kinetics for the plasma membrane H
+-ATPase
1. Prepare all components of the reaction mixture as stock solutions: 0.5 M phosphoenol-pyruvate, 1 M MgCl2, 1 M Na-azide
(prepare 1 ml in an Eppendorf tube), 2 M KCl, 100 mM ATP, 40 mM NADH, 10 mM PIPES pH 7.0. In this buffer also prepare stock solutions of 1 M trehalose, 1 M sucrose and 4 M glycerol. The enzymes, lactate dehydrogenase (10.5 IU) and pyruvate kinase (12.5 IU) are used as supplied.
2. Mix all reaction mixture components in the spectrophotometer cell to the final concentrations indicated. Remember not to add the H+-ATPase. Note that at the higher carbohydrate concentrations the solution becomes highly viscous and thus the stirring
rate must be properly adjusted in order to attain solution homogeneity. Note that an excess in the rate of stirring may damage proteins.
3. Incubate the solution at the test temperature for at least 10 min. 4. Initiate the reaction by adding the H+-ATPase.
5. Follow the decrease in absorbance at 340 nm for about 10 min. 6. Determine the slope of the line obtained (∆O.D. per min). 7. Determine the rate of ATP hydrolysis as follows:
8. v=∆O.D.(V)(∈ b mg protein)-1 (1,000,000) where ∆O.D. is the absorbance decrease per min, (see step 6), V is expressed in
liters, ∈ is the NADH extinction coefficient of 6200 per cm per M, b is the path length of the cell (1 cm) and v is the rate of ATP hydrolysis expressed as micromol of ATP per mg protein per min.
9. A set of 8-10 data points are adequate to carry out the fitting procedure to the Hill equation [eq 2] by non-linear regression (14) using an iterative software, where the best kinetic parameters values (Vmax, Km or n) that fit the data are obtained. In this work,
the H+-ATPase displayed a sigmoid dependence upon substrate concentration (S) and thus the power (Hill coefficient, n)
affecting the parameters in eq 2 was higher than 1, thus indicating a cooperative kinetics for the H+-ATPase. However, for
other enzymes under study kinetics could be hyperbolic and thus the Michaelis-Menten equation should be considered. 10. As in all other enzyme-coupled assays, ensure that the maximal rate of the assay is higher than the maximal rate of the enzyme
Protocol 3: Correlation between viscosity and enzyme inhibition
1. Make a plot of the calculated Vmax against the reciprocal of the viscosity.
2. Using linear regression analysis, calculate the slope of the straight line that best fits the data points.
3. An effect of viscosity on the Vmax is assumed if the correlation coefficient of the linear regression is at least 0.98.
4. The value of the slope is directly proportional to the dependence: that is, a higher slope indicates a higher effect of viscosity on
Vmax.
5. Note that the dependence of the Vmax on viscosity is also dependent on the nature of the viscosogenic agent under test and on
the temperature, i.e. glycerol is a more potent inhibitor than sucrose or trehalose. In regard to temperature, both viscosity and the effects of viscosity on enzyme activity decrease as temperature rises.
Table 3: Kinetic parameters for the plasma membrane H+-ATPase in the presence of glycerol, trehalose or sucrose
Polyol Concentration (M) Mass Fraction (c) Viscosity (cP)
Vmax
µmols ATP mg-1
min -1
S0.5 mM Trehalose 0.0 0.2 0.4 0.5 0.6 0.8 0.00 0.07 0.13 0.16 0.19 0.25 1.03 1.39 1.58 1.78 2.08 2.41 6.91 5.80 5.59 5.22 4.49 3.73 1.08 1.21 1.29 1.38 1.87 2.29 Sucrose 0.0 0.2 0.4 0.5 0.6 0.8 0.00 0.07 0.13 0.17 0.20 0.25 1.03 1.24 1.53 1.74 2.02 2.56 6.91 6.26 5.62 5.25 4.83 4.17 1.08 1.10 1.16 1.37 1.57 1.95 Glycerol 0.0 1.0 2.0 3.0 3.5 4.0 0.00 0.09 0.18 0.27 0.31 0.35 1.03 1.31 1.71 2.26 2.58 3.05 6.91 6.24 4.65 4.05 2.88 1.94 1.08 1.16 1.18 1.27 1.78 2.23
Solutions viscosities were calculated as described in equation [eq 1] by using the measured time of ball descent and solution density at 20ºC. Initial rates of ATP hydrolysis were measured at 20ºC as described in methods in the presence of the indicated concentrations of, trehalose, sucrose or glycerol. Mass fraction (c) was obtained by calculating the grams of solute in the total grams of the mixture in 1 ml. The kinetic parameters (Vmax, S0.5 and n) were obtained by non-linear regression, fitting the data to the