_____________________________________________________________________________________________________ *Corresponding author: Email: [email protected]
Overview of Elements within National Food-Based
Dietary Guidelines
Erve, I. van ‘t
#, Tulen, C. B. M.
#, Jansen, J., Laar, A. D. E. van, Minnema, R.,
Schenk, P. R., Wolvers, D.
1*, Rossum, C. T. M. van
2and Verhagen, H.
2,3,†1
Netherlands Nutrition Centre, Eisenhowerlaan 108, 2517 KL Den Haag, The Netherlands.
2
National Institute for Public Health and the Environment (RIVM), Antonie van Leeuwenhoeklaan 9, 3721 MA Bilthoven, The Netherlands.
3University of Ulster, Northern Ireland Centre for Food and Health (NICHE), Cromore Road,
Coleraine, BT52 1SA, Northern Ireland.
Authors’ contributions
This work was carried out in collaboration between all authors. Authors WD, RCTMV and VH initiated and supervised the project. Authors EIVT, TCBM, JJ, LADEV, MR and SPR performed the first, extensive, FBDG search in March-April 2015. They all designed the study, performed the literature searches and the statistical analysis, wrote the protocol and the first draft of the manuscript during the student’s project within the Academic Master Cluster of Wageningen University, The Netherlands (project number YMC-60809). Author WD updated the search in the beginning of 2016. Authors EIVT and TCBM managed the additional analysis and revised the final manuscript. All authors read and approved the final manuscript.
Article Information
DOI:10.9734/EJNFS/2016/32645
Received 7th March 2017 Accepted 20th June 2017 Published 29th June 2017
ABSTRACT
Background: Food-Based Dietary Guidelines (FBDG) serve as an approach to provide dietary and lifestyle information with the ultimate goal to contribute to public health. Recommendations for the development and implementation of FBDG are given by the EFSA and the WHO/FAO. An overview of the currently present FBDG and used elements in FBDG is lacking.
Aim: The aims of this study were (1) to provide an overview of all official FBDG that are currently present for the general healthy population, and (2) to get insight in the elements and visual approaches used in these guidelines.
Methodology: A comprehensive internet search was performed to analyse the presence of official FBDG in a total of 226 countries worldwide. Both information content and visual representation of FBDG were reviewed using descriptive statistics.
Results: FBDG were found for 93 out of 226 countries, of which 79 FBDG included a visual representation. Representations of six or seven food groups in FBDG were most common. In 61% of FBDG, cereals were the most prominent food group representing the highest relative amount of food to be eaten. Hierarchical models, such as pyramids, were used about as frequently as
hierarchical models, such as plates. The lifestyle factor “exercise” was mentioned in 85% of FBDG. Non-caloric beverages and exercise were present in the visual representation in 48% and 46% of FBDG, respectively.
Conclusion: 41% of the analysed countries had a national FBDG. Most FBDG included a visual representation, consisted of six or seven food groups and made use of graphic design aspects like colour. FBDG considerably differed regarding the food groups that were represented and graphic design aspects, like hierarchy and shape.
Keywords: (Official) National Food-Based Dietary Guidelines (FBDG); global overview; healthy diet.
ABBREVIATIONS
BMI : Body Mass Index
EFSA : European Food Safety Authority EUFIC : European Food Information Council FAO : Food and Agriculture Organization of the
United Nations
FBDG : Food-Based Dietary Guidelines RCT : Randomized Controlled Trial WHO : World Health Organization
1. INTRODUCTION
Dietary risk factors and physical inactivity are responsible for a large proportion of the major global diseases [1]. Since a proper lifestyle is of critical importance for health, Food-Based Dietary Guidelines (FBDG) play a potential role in improving public health. FBDG serve as an approach to create awareness and provide the public with lifestyle information and practical dietary advice using an understandable vocabulary. This is generally combined with a visual representation to increase the consumers’ awareness and understanding [2]. Although the effect of FBDG on eating behaviour has barely been studied, several studies have confirmed the health promoting potential of FBDG by showing that adherence to them reduces the risk for a variety of chronic diseases [3]–[7].
To guide the development of FBDG, the World Health Organization (WHO) and the Food and Agriculture Organization of the United Nations (FAO) collaborated to generate a report about the development of FBDG [8]. The European Food Safety Authority (EFSA) provided similar advice on how to develop FBDG [2]. The WHO and FAO state that FBDG should focus on public health problems and related nutrients instead of focusing on the discrepancy between recommended intake and actual intake in a population [8]. Recent FBDG have increasingly focused on the relation between food groups and health as well as eating patterns and health, rather than on the single relation between nutrients and health [9,10]. Moreover, it is
recommended to consider cultural and economic factors when developing FBDG, as these factors could influence the intake of foods. Finally, the consequence of the advice should be taken into account [8]. An advice to increase the consumption of one food may for example result in a decreased consumption of another food, thereby negatively influencing overall nutrient intake. Overall, general recommendations for the implementation of FBDG and inclusion of a visual representation are provided by EFSA and WHO/FAO [2,8].
2. METHODS
2.1 Search for FBDG
In March and April 2015, an internet search was performed to screen the presence of official FBDG in countries worldwide. In the beginning of 2016, we updated this search with the recently published FBDG and their visual models (United States of America, United Kingdom, Sweden, Ireland and the Netherlands). We only considered FBDG that were published and/or endorsed by a government. The search for FBDG was initiated with the list of FAO member countries (194 countries) [13]. The search was supplemented with 32 non-FAO member nations that were found during the internet search to have FBDG. As a result, a total of 226 countries from the continents Africa, Asia, Europe, North America, Oceania and South America were analysed (a complete list of analysed countries is shown in Appendix A). Applied search terms were: Food(-)Based Dietary Guidelines ‘name country’. This literature research was initially performed in the English language and when needed, in the official language of the country. Governmental websites of national ministries of health and WHO websites were primary information sources. FBDG were included when either a visual model and/or consumer brochure was found. FBDG only directed at the general (healthy adult) population were taken into account.
2.2 Analysis of Elements in FBDG
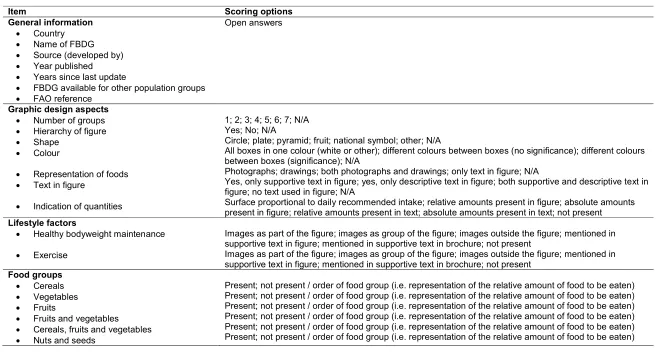
To score the various elements present in FBDG, we created a scoring-list. Various elements of FBDG were inventoried in five categories, namely general information, graphic design aspects, lifestyle factors, food groups and food items. Food groups were based on the food list of the FAO [17]. After orientation on the possible options per category of the FBDG and the authors’ knowledge of the field, scoring options were defined per element (Appendix B, Table I).
In each category, except for general information, predefined answer options were used to allow consistent scoring of the FBDG-features between the six authors involved.
2.3 Data Analysis
Frequencies of graphic design aspects, presence of lifestyle factors and food groups in the visual representation and/or consumer brochure of the FBDG were analysed using descriptive statistics. Frequencies of FBDG were both determined worldwide and per continent. All analyses were performed using SPSS version 20.
3. RESULTS
3.1 Inventory of Worldwide Official FBDG
Among the 226 countries included in the internet search (Appendix A), the presence of official FBDG was identified in a total of 103 individual countries of which 11 countries were found to share one set of FBDG (Table 1). This resulted in 93 FBDG to be analysed. The percentage of countries with official FBDG per continent was highest in North America (77%) and Europe (67%), whereas the percentage of countries with an official FBDG was lowest in Africa (12%). No official FBDG were detected for 123 out of 226 countries.
All 93 identified FBDG were taken into account in the data analysis (Table 1) and all results are shown in Appendix B and C, and supplementary Appendix D. When the overall make-up of the FBDG was considered, 11 were found to consist of written messages only (FBDG from Brazil, Chile, El Salvador, Georgia, Ghana, Indonesia, Italy, Macedonia, Mauritius, Nepal and New-Zealand), whereas 79 FBDG were found to consist of a visual representation. Three FBDG (Greenland, Malawi and Sweden) were found to consist of mainly text and only minor visual representations.
Table 1. Number of official FBDG identified per continent
Continent Africa Asia Europe North
America
Oceania South America
Total
Number of countries included in screening
58 43 51 13 15 46 226
Number of official FBDG identified
7 18* 34 10 4 20 93
Percentage of countries with an official FBDG (%)
12 65 67 77 27 43 54
3.2 Food Groups
The food groups that were analysed in various FBDG are listed in Appendix B, Table I. Differences in the presence of food groups, food items and nutrients were identified between FBDG (Appendix B, Tables II and III). The following paragraphs summarize the most remarkable observations.
3.2.1 Most prominent food groups
The food groups (Appendix B) of 93 FBDG were analysed regarding their representation of the relative amount of food to be eaten. In 57 FBDG (61%) cereals were the most prominent food group representing the highest relative amount of food to be eaten followed by non-caloric beverages in eight FBDG (9%) and fruits and vegetables in six FBDG (7%).
3.2.2 Protein-rich foods
The following groups were identified when analysing the protein rich food: fish, meat, eggs, dairy products, fish and meat, fish, meat and eggs, fish, meat and dairy products, fish, meat, eggs and dairy products (Table 2). In most FBDG, dairy products represented a separate group. Furthermore, a separate food group combining fish, meat and eggs was seen in 40 FBDG (43%) and 21 FBDG (23%) contained a food group that combined fish, meat, eggs and dairy products. As some FBDG used more than one of these protein-rich food groups (e.g. a separate food group for fish and a separate food group for meat), cumulative percentages in Table 2 are above 100%.
3.2.3 Sugars and/or sweeteners
Some FBDG mentioned sugars and/or sweeteners as separate food groups, while other grouped them together with fats as discretionary foods. In the visual models sugars and/or sweeteners were sometimes placed outside the
model, and sometimes placed within. In this FBDG analysis, sugars and/or sweeteners were mentioned in 82 FBDG (88%). Sugars and/or sweeteners were presented as a separate group in 47 FBDG (51%), whereas sugars and/or sweeteners were mentioned in 27 FBDG (29%) in the consumer brochure (Table 3).
Table 2. Presence of fish, meat, eggs and dairy products within FBDG (n=93)
Food groups Percentage
of FBDG (%)
Dairy products Fish, meat and eggs Fish, meat, eggs and dairy products Fish and meat
55 43
23 10 Fish, meat and dairy products Meat
Fish
4 6 4
Eggs 1
3.2.4 Oils and fats
Oils and fats were mentioned in all 93 FBDG, except for the FBDG of Singapore (supplementary Appendix D). Oils and fats were mostly presented as a group in the visual representation, namely in 64 FBDG (69%). Furthermore, 22 FBDG (24%) mentioned oils and fats in the consumer brochure e.g. ‘choose low-fat products’ (e.g. low-low-fat options of dairy products) or choose products rich in ‘good’ fats (omega-3- and omega-6-fatty acids) like fish as a source of omega-3-fatty acids (Table 3).
3.2.5 Salt
Salt was mentioned in 83 out of 93 FBDG (89%). Salt was shown in the visual representation as food group in 16 FBDG (17%). In six FBDG (6%), salt was presented in the visual representation in another form (e.g. as supportive text or as image outside the figure). Salt was mentioned in the consumer brochure in 61 FBDG (66%, Table 3).
Table 3. Presence of sugars and/or sweeteners, oils and fats and salt within FBDG (n=93)
Sugars and/or sweeteners (%)
Oils and fats (%)
Salt (%)
Image as part of visual representation 2 1 0
Image as group of visual representation 51 69 17
Image outside of figure 3 2 3
In supportive text in figure 3 3 3
In supportive text in consumer brochure 29 24 66
3.3 Beverages in FBDG
The presence of beverages was analysed in 93 FBDG (Appendix B, Table III). Water, coffee and tea were grouped under non-caloric beverages. Light soft drinks were not taken into account in this study [17].
3.3.1 Non-caloric beverages
Ten FBDG (11%) did not mention non-caloric beverages, neither in the consumer brochure nor in the figure. Non-caloric beverages were exclusively mentioned in the consumer brochure in 37 FBDG (40%), whereas 45 FBDG (48%) depicted non-caloric beverages in the visual representation (Table 4).
3.3.2 Alcoholic beverages
Four FBDG (4%) depicted alcoholic beverages in the visual representation. Alcohol was mentioned in 44 FBDG (47%) in the consumer brochure (Table 4). Alcoholic beverages were not mentioned in 43 FBDG (46%), neither in the visual representation nor in the consumer brochure.
3.4 Lifestyle Factors
The presence of lifestyle factors “healthy bodyweight maintenance” and “exercise” were analysed in 93 FBDG (Appendix B, Table IV).
3.4.1 Healthy bodyweight maintenance
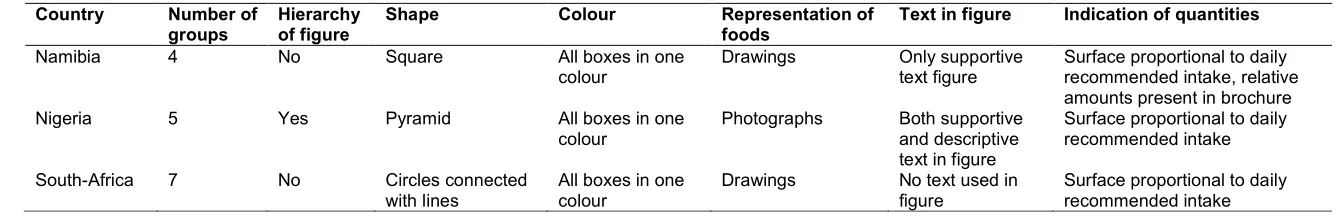
Recommendations on the lifestyle factor “healthy bodyweight maintenance” were mentioned in 51 out of 93 the FBDG (55%) of which 50 FBDG (54%) exclusively mentioned healthy bodyweight maintenance in the consumer brochure and one FBDG (1%) mentioned healthy bodyweight maintenance in the supportive text of the figure only (supplementary Appendix D: FBDG of Namibia). In 42 FBDG (45%), no sentence or visual representation of healthy bodyweight
maintenance and/or Body Mass Index (BMI) was present in the figure or consumer brochure. An overview of the amount of FBDG that mentioned healthy bodyweight maintenance is shown in Appendix B, Table IV.
3.4.2 Exercise
The lifestyle factor “exercise” was present in 85% of analysed FBDG. 43 FBDG (46%) showed exercise (as image or supportive text) in the figure, outside the figure or as group of the figure. Exercise was exclusively mentioned in the consumer brochure in 36 FBDG (39%), while 14 FBDG (15%) did not mention exercise at all (Appendix B, Table IV). The FBDG of Japan and South-Korea are examples of how advice on exercise can be present in the visual representation of FBDG (supplementary Appendix D).
3.5 Graphic Design Aspects in FBDG
Graphic design aspects were analysed in 79 FBDG which contained a visual representation.
3.5.1 Number of groups, hierarchy and shape
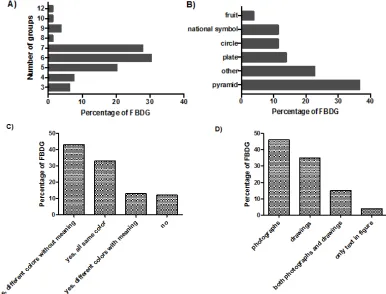
The 79 FBDG with a visual representation were ranked per number of food groups present in the visual representation. Representation of six or seven food groups were found to be most common in analysed FBDG, together covering more than half of the analysed FBDG (24 (30%) and 22 (28%) FBDG, respectively; Fig. 1A). Some form of hierarchy was observed in 46 FBDG (58%). So, hierarchical models (such as pyramids) were used about as frequently as non-hierarchical models (such as plates). A FBDG was considered hierarchical when the visual representation showed a clear ranking of groups, e.g. in the cases of Belgium and Paraguay (supplementary Appendix D). The shape of a pyramid was used in 29 FBDG (37%) (Fig. 1B). A national symbol, e.g. the Food Pagoda of China (supplementary Appendix D), was seen in nine FBDG (11%) (Fig. 1B).
Table 4. Presence of beverages within FBDG (n=93)
Non-caloric beverages (%)
Alcoholic beverages (%)
Image as part of visual representation 13 - Image as group of visual representation 16 -
Image outside of figure 19 4
In supportive text in figure 1 2
In supportive text in consumer brochure 40 47
3.5.2 Colours
Of all analysed 79 FBDG with a visual representation, a single colour was observed in 26 FBDG (33%). 44 FBDG used multiple colours (43%), although only 10 FBDG used colours with a message (13%) (e.g. a ‘traffic light’ system in the FBDG of Malaysia or Ireland: using green to identify groups to encourage, and red to identify groups to discourage (supplementary Appendix D)). The use of descriptive colours, e.g. blue for dairy or yellow for grains, was not considered as meaningful, indicative colour. Such descriptive colours informed the consumer about the content of the group, but do not attach value to it, e.g. whether to approach or avoid that particular group. Lastly, nine FBDG (11%) showed no colour. These FBDG consisted of boxes full of photographs and/or drawings of food products without the use of background colour (Fig. 1C).
3.5.3 Representation of foods
The visual representation of 79 FBDG was judged based on the presence of photographs
and/or drawings. Fig. 1D indicates that 28 FBDG (35%) showed only drawings, 36 FBDG (46%) showed only photographs and 12 FBDG (15%) showed both photographs and drawings. A total of three FBDG (4%) neither demonstrated photographs nor drawings while they were a visual FBDG by showing text in the figure, e.g. My Plate of the United States of America (supplementary Appendix D).
3.5.4 Text in figure
34 out of 79 FBDG (43%) only contained descriptive text. Descriptive text was defined as text in the figure describing the visual representation of the photographs and/or drawings (e.g. “fruits and vegetables” above the visual representation of fruits and vegetables). Ten FBDG (13%) only contained supportive texts. Supportive text was defined as text in the figure giving advice (e.g. eat moderate) or representing quantities (e.g. amount of servings a day), thereby providing additional information to the figure. Both descriptive and supportive text was presented in 23 FBDG (29%) (Appendix C).
3.5.5 Indication of quantities
An indication of the recommended quantities of the different food groups were depicted in FBDG in various manners: proportional surfaces, text in figure or text in consumer brochure. As most FBDG used more than one option to describe these quantities, cumulative percentages in Table 5 were above 100%. Indication of quantities in the consumer brochure was present in 58 out of 79 FBDG (74%), of which 33 FBDG (42%) mentioned absolute amounts, while 25 FBDG (32%) mentioned relative amounts. In 24 out of 79 FBDG (30%) the quantities were present in the figure itself, of which 19 FBDG (24%) mentioned absolute amounts and five FBDG (6%) mentioned relative amounts. Visualization of quantities in the figure as proportional surfaces was shown in 62 FBDG (78%) (Table 5).
Table 5. Indication of quantities in FBDG (figure or consumer brochure) (n=79)
Categories of indication of quantities
Percentage of total FBDG (%)
Proportional surfaces in figure 78 Absolute amounts in text 42 Relative amounts in text 32 Absolute amounts in figure 24 Relative amounts in figure 6
4. DISCUSSION
The objectives of this study were to provide a complete overview of all official national FBDG for the general healthy population currently present worldwide, and to get insight into the content and (visual) elements used in these FBDG. Of the 226 countries analysed, 93 had an official, national FBDG of which 79 contained a visual representation. Continents with the highest percentage of countries with an official FBDG were North America (77%) and Europe (67%). Africa was the continent with the lowest percentage of FBDG (12%).
It was found that representations of six or seven food groups in a FBDG were most common. Cereals were mentioned in 61% of the FBDG as the most prominent food group representing the highest relative amount of food to be eaten. Furthermore, oils and fats were mentioned in 99% of FBDG in the visual representation or consumer brochure. These findings could be explained by the fact that a balanced diet is
recommended and the main energy sources in foods are carbohydrates and fats [2]. Furthermore, the lifestyle factors “exercise” and “healthy bodyweight maintenance” were present in several FBDG. Although strictly not food related, their contribution to the energy balance, which is pivotal to health justifies their presence in FBDG [2]. The lifestyle factors “healthy bodyweight maintenance” and “exercise” were mentioned in respectively 55% and 85% of FBDG. Besides oils and fats (99%), most FBDG mentioned sugars and/or sweeteners (88%) and salt (89%) in their visual representation or consumer brochure. In addition, non-alcoholic beverages were mentioned in 89% and alcoholic beverages in 54% of FBDG. The mere presence of food groups in FBDG may not by itself be a message of encourage or discourage. However, descriptive texts and graphic design aspects (e.g. colours, shape) may indicate encouragement or discouragement of certain food groups. For example, in case of oils and fats, texts as “choose low-fat products” and “choose products rich in ‘good’ fats like fish as a source of omega-3-fatty acids” were used. In case of alcoholic beverages, the FBDG of India stated “abstain from drinking alcohol” whereas the FBDG of Greece showed a glass of wine near the foods that can be consumed daily with the message “wine in moderation” (supplementary Appendix D).
So, a plethora of different approaches concerning the visual representation of a FBDG was observed which could influence the interpretation of the FBDG message. Graphic design aspects ranged from meaningful colours, drawings and photographs, and no text to no colour, no drawing nor photographs and only text. There is however, limited knowledge on the potential impact of graphic design aspects on consumer liking, understanding and use of FBDG.
convey diet composition and diet-related concepts [16,20]. It remains to be investigated whether the shape of national symbols have additional value when applied in the visual representation of FBDG.
Furthermore, 89% of the FBDG with a visual representation used colour in representing their messages.Colour can generate attention, certain automatic biological reactions and emotional responses [21,22]. Warm colours are more exciting (e.g. red or yellow), whereas cool colours (e.g. blue or green) are more relaxing. A fair balance of colour intensity and coherency benefits consumer satisfaction. Responses to colour are quite consistent, though some individual and cultural differences exist. Descriptive colour use was regularly observed in our study, e.g. green for vegetables and fruits, blue for dairy. The aforementioned ‘traffic light’ representation makes use of colour-coding with the green end containing products that are recommended, and the red end containing products that are discouraged [23]. A risk of the use of colour-coding is the potential confusion between the cognitive interpretation and emotional response of colour, e.g. the colour red can be experienced both as exciting and as a warning sign [21].
Drawings were only used in 28 FBDG, 36 FBDG only displayed photographs and 12 FBDG showed both photographs and drawings. In addition, 34 out of 79 FBDG only contained descriptive text, ten FBDG only supportive text and 23 FBDG both. Previous studies with respect to the presence of photographs, drawing or text in a figure are performed to elucidate the clearest way of communication. It is known that consumers are able to recall information better when food products are few and drawn, rather than many and photographic [20]. Thus, simplifying presented information can contribute to increased memory retrieval. Photographs have faster and more automatic access to what they portray than to what they are named, while words have faster and more automatic access to what they are named than to what they portray [24]. On the other hand, the process of extracting information from pictures is slower and more attention demanding. Although, FBDG with realistic photographs require more effort to recall what they portray, they did recall more far-reaching, vivid meanings. A photographic FBDG is preferred by consumers as well [20]. In addition, the use of symbols is associated with more accurate identification of food groups
containing certain discretionary nutritional values [18]. Moreover, words and pictures differ in the speed and effort needed to retrieve information [24]. Adding descriptive labels to food groups in FBDG may increase the ease to identify and categorise photographic information [25]. Photographs and/or drawings lack the ability to stress topics of attention into detail. This implies that the visual information must at least be supported by explanatory materials if the full range of the FBDG is understood well [18]. By the representation of foods in photographs, drawings or text a continuous trade-off should be made between simplifying information for manageability and keeping a degree of detail for the imagination of and understanding by the consumer.
This is, to our knowledge, the first study showing an extensive overview of all official national FBDG present worldwide in which the elements and visual approaches in national FBDG were analysed. A limitation of this study is the involvement of six researchers in scoring the various elements of FBDG. Though predefined answer categories were used to minimize variation in scoring, individual differences in interpretation of FBDG and categorising the various elements cannot be excluded. Secondly, the scoring of elements of FBDG was performed according to a list that the authors constructed based on their own observations. We may therefore not have included all possible elements that one may find in FBDG. Thirdly, as FBDG text messages that were not in Dutch or English were translated, some mistakes may have been introduced. Lastly, the total number of 226 countries was based on the officially FAO recognized 194 countries [13], which were complemented by 32 countries that came up in the internet search also having national FBDG. This may account for possible discrepancies between the list of countries in this paper and other country-lists.
investigate the awareness, understanding and use of FBDG as reviewed by Brown et al. [27]. Most studies focussed on awareness and understanding of FBDG. Generally, a greater awareness of visual representation compared to the written FBDG guidelines seemed to exist and increased awareness may possibly occur over time during the years after introduction of FBDG. This, however, did not directly translate to increased understanding. Though some studies showed a general understanding of key concepts of FBDG, more abstract concepts such as portion sizes and quantities, appeared to be more difficult to understand. Few studies exist on intended use or actual use of FBDG by consumers [27]. Ideally, randomized controlled trials (RCTs) should test the use and effectiveness of FBDG. However, such studies are difficult to perform as it is challenging to obtain a control group which has not been exposed to FBDG. Further research needs to be carried out to assess the use and effectiveness of FBDG and how various elements employed within FBDG may affect their appeal, understanding and use.
5. CONCLUSION
In conclusion, an official, national FBDG was found in 41% of the analysed countries. Most FBDG included a visual representation. Common elements were the inclusion of six or seven food groups, the use of colour, and mentioning lifestyle factors. However, FBDG were considerably different in representation of food groups and graphic design aspects (like hierarchy and shape). How these features affect implementation and effectiveness of FBDG would be an area of further research.
ACKNOWLEDGEMENTS
The author Hans Verhagen is currently employed with the European Food Safety Authority (EFSA). However, the present article is published under the sole responsibility of Hans Verhagen and the positions and opinions presented in this article are those of the authors alone and are not intended to represent the views or scientific works of EFSA.
The authors thank Mrs. S. Meijboom (WUR) for her input and guidance on the content of the project. The authors thank Dr. C.A.G.M. Weijers (WUR) for his role as process coach in this project. The work was funded by the Netherlands Nutrition Centre.
COMPETING INTERESTS
Authors have declared that no competing interests exist.
REFERENCES
1. Lim SS, Vos T, Flaxman AD, Danaei G, Shibuya K, Adair-Rohani H, et al. A comparative risk assessment of burden of disease and injury attributable to 67 risk factors and risk factor clusters in 21 regions, 1990–2010: a systematic analysis for the Global Burden of Disease Study 2010. Lancet. 2013;380(9859):2224– 2260.
2. European Food Safety Authority. Scientific opinion on establishing food-based dietary guidelines. EFSA J. 2010;8(3):1460. 3. Schwingshackl L, Missbach B, König J,
Hoffmann G. Adherence to a Mediterranean diet and risk of diabetes: A systematic review and meta-analysis. Public Health Nutr. 2015;18(7):1292–1299. 4. Liese AD, Krebs-Smith SM, Subar AF, George SM, Harmon BE, Neuhouser ML, et al. The dietary patterns methods project: Synthesis of findings across cohorts and relevance to dietary guidance. J. Nutr. 2015;145(3):393–402.
5. Chiuve SE, Fung TT, Rimm EB, Hu FB, McCullough ML, Wang M, et al. Alternative dietary indices both strongly predict risk of chronic disease. J. Nutr. 2012;111. 6. Hosseini-Esfahani F, Jessri M, Mirmiran P,
Bastan S, Azizi F. Adherence to dietary recommendations and risk of metabolic syndrome: Tehran lipid and glucose study. Metabolism. 2010;59(12):1833–1842. 7. McCullough ML, Feskanich D, Stampfer
MJ, Giovannucci EL, Rimm EB, Hu FB, et al. Diet quality and major chronic disease risk in men and women: Moving toward improved dietary guidance. Am. J. Clin. Nutr. 2002;76(6):1261–1271.
8. Food and Argiculture Organization Joint and World Health Organization Consultation. Preparation and use of food-based dietary guidelines. World Health Organ; 1998.
9. Health Council of the Netherlands. Dutch dietary guidelines 2015. 2015.
Report of the Dietary Guidelines Advisory Committee on the Dietary Guidelines for Americans; 2010.
12. Vorster HH, Love P, Browne C. Development of food-based dietary guidelines for South Africa–the process. S Afr J Clin Nutr. 2011;14(3):S3–S6.
13. Food and Agriculture Organization of the United Nations. Countries. 2015. Accessed: April 22 2015.
Available:http://www.fao.org/countryprofile s/en/.
14. Chinese Nutrition Society. Compilation of Food-Based Dietary Guidelines; 2014. 15. The European Food Information Council.
Food-Based Dietary Guidelines in Europe; 2009.
16. Montagnese C, Santarpia L, Buonifacio M, Nardelli A, Caldara AR, Silvestri E, et al. European food-based dietary guidelines: A comparison and update. Nutrition. 2015;31(7–8):908–915.
17. Greenfield H, Southgate DA. Food composition data: Production, management, and use. Food & Agriculture Organization; 2003.
18. Nutrition Reviews. An evaluation of dietary guidance graphic alternatives: The evolution of the eating right pyramid. Nutr. Rev. 1992;50(9):275–282.
19. Hess R, Visschers VHM, Siegrist M. Effectiveness and efficiency of different shapes of food guides. J. Nutr. Educ. Behav. 2012;44(5):442–447.
20. Hunt P, Gateby S, Raynert M. The format
for the national food guide: Performance and preference studies. J. Hum. Nutr. Diet. 2007;20(3):210–226.
21. Bellizzi JA, Crowley AE, Hasty RW. The effects of color in store design. J. Retail. 1983;59:21-45.
22. Bellizzi JA, Hite RE. Environmental color, consumer feelings, and purchase likelihood. Psychol. & Mark. 1992;9(5): 347–363.
23. Yngve A, Margetts B. Building centres of excellence, and a new approach to food guides. Public Health Nutr. 2009;12(5): 589–590.
24. Ono H, Weber EU. Journal of experimental psychology: Human perception and performance. J. Exp. Psychol. Hum. Percept. Perform. 1981;7(5):937–947. 25. Mogilner C, Rudnick T, Iyengar SS. The
mere categorization effect: How the presence of categories increases choosers’ perceptions of assortment variety and outcome satisfaction. J. Consum. Res. 2008;35(2).
26. Story M, Kaphingst KM, Robinson-O’Brien R, Glanz K. Creating healthy food and eating environments: Policy and environmental approaches. Annu. Rev. Public Health. 2008;29:253–272.
APPENDIX A
Table 1. Countries analysed for the presence of official FBDG per continent (abbreviated names are mentioned plus official names when available)
Africa Europe South America Asia Oceania North America
Algeria2 (the People's Democratic
Republic of Algeria)
Albania1 (the Republic of
Albania)
Anguilla (UK) Afghanistan (the Islamic
Republic of Afghanistan)
Australia1
(Australia)
Belize1 (Belize)
Angola (the Republic of Angola) Andorra (the Principality
of Andorra)
Antigua and Barbuda1
(Antigua and Barbuda)
Azerbaijan (the Republic of Azerbaijan)
Fiji1 (the
Republic of Fiji)
Bermuda1
Benin1 (the Republic of Benin) Armenia (the Republic of
Armenia)
Argentina1 (the Argentine
Republic)
Bahrain2 (the Kingdom of
Bahrain)
Indonesia1
(the Republic of Indonesia)
Canada1
(Canada)
Botswana (the Republic of Botswana)
Austria1 (the Republic of
Austria)
Aruba Bangladesh1 (the People's
Republic of Bangladesh)
Kiribati (the Republic of Kiribati)
Clipperton Islands
Burkina Faso (Burkina Faso) Azerbaijan (the Republic
of Azerbaijan)
Barbados1 (Barbados) Bhutan (the Kingdom of
Bhutan)
Marshall Islands (the Republic of the Marshall Islands)
Costa Rica1
(the Republic of
Costa Rica)
Burundi (the Republic of Burundi) Belarus (the Republic of
Belarus)
Bolivia (the Plurinational State of Bolivia)
Brunei (Brunei Darussalam) Micronesia
(the Federated States of Micronesia)
El Salvador1
(the Republic of
El Salvador)
Cameroon (the Republic of Cameroon)
Belgium1 (the Kingdom
of Belgium)
Bonaire (Neth.) Cambodia (the Kingdom of
Cambodia)
Nauru (the Republic of Nauru)
Guatemala1
(the Republic of
Guatemala)
Cabo Verde (Republic of Cabo Verde)
Bosnia and
Herzegovina1 (Bosnia
and Herzegovina)
Brazil1 (the Federative
Republic of Brazil)
China1 (the People's
Republic of China)
New
Zealand1
(New Zealand)
Africa Europe South America Asia Oceania North America Central African Republic (Central
African Republic)
Bulgaria1 (the Republic
of Bulgaria)
British Virgin Islands (UK) East Timor (the Democratic
Republic of Timor-Leste)
Palau (the Republic of Palau)
Mexico1 (the United Mexican
States)
Chad (the Republic of Chad) Croatia1 (the Republic of
Croatia)
Cayman Islands (UK) India1 (the Republic of
India)
Papua New Guinea
(Independent
State of Papua New Guinea)
Nicaragua (the
Republic of Nicaragua)
Comoros (the Union of the Comoros)
Cyprus1 (the Republic of
Cyprus)
Chile1 (the Republic of
Chile)
Iran1 (the Islamic Republic
of Iran)
Samoa (the
Independent State of Samoa)
Panama1 (the Republic of Panama)
Democratic Republic of Congo (the Democratic Republic of the Congo)
Czech Republic (the Czech Republic)
Colombia1 (the Republic
of Colombia)
Iraq2 (the Republic of Iraq) Solomon
Islands (Solomon Islands)
Saint Pierre and Miquelon
Cote D'Ivoire (the Republic of Côte d'Ivoire)
Denmark1 (the Kingdom
of Denmark)
Cuba1 (the Republic of
Cuba)
Japan1 (Japan) Tonga (the
Kingdom of Tonga)
United States1
(the United States of America)
Djibouti (the Republic of Djibouti) Estonia1 (the Republic of
Estonia)
Curacao Jordanian2 (the Hashemite
Kingdom of Jordan)
Tuvalu (Tuvalu)
Egypt2 (the Arab Republic of
Egypt)
Finland1 (the Republic of
Finland)
Dominica1 (the
Commonwealth of Dominica)
Kazakhstan (the Republic of Kazakhstan)
Vanuatu (the
Republic of Vanuatu) Equatorial Guinea (the Republic of
Equatorial Guinea)
France1 (the French
Republic)
Dominican Republic1 (the
Dominican Republic)
Kyrgyzstan (the Kyrgyz Republic)
Eritrea (the State of Eritrea) Georgia1 (Georgia) Ecuador (the Republic of
Ecuador)
Kuwait2 (the State of
Kuwait) Ethiopia (the Federal Democratic
Republic of Ethiopia)
Germany1 (the Federal
Republic of Germany)
Falklands Islands (UK) Laos (the Lao People's
Democratic Republic)
Gabon (the Gabonese Republic) Greece1 (the Hellenic
Republic)
French Guiana (Fr.) Lebanon1 (the Lebanese
Republic) Gambia (the Republic of the
Gambia)
Africa Europe South America Asia Oceania North America
Ghana1 (the Republic of Ghana) Hungary1 (Hungary) Guadeloupe (Fr.) Malaysia1
Guinea (the Republic of Guinea) Iceland1 (the Republic of
Iceland)
Guyana1 (the Republic of
Guyana)
Maldives (the Republic of Maldives)
Guinea-Bissau (the Republic of Guinea-Bissau)
Ireland1 (Ireland) Haiti (the Republic of
Haiti)
Mongolia1 (Mongolia)
Kenya (the Republic of Kenya) Israel1 (the State of
Israel)
Jamaica1 Myanmar/Burma (the
Republic of the Union of Myanmar)
Lesotho (the Kingdom of Lesotho) Italy1 (the Republic of
Italy)
Martinique (Fr.) Nepal1 (the Federal
Democratic Republic of Nepal)
Liberia (the Republic of Liberia) Kosovo Montserrat (UK) North-Korea (the
Democratic People's Republic of Korea)
Libya (Libya) Latvia1 (the Republic of
Latvia)
Navassa Island (US) Oman1, 2 (the Sultanate of
Oman) Madagascar (the Republic of
Madagascar)
Liechtenstein Paraguay1 (the Republic
of Paraguay)
Pakistan (the Islamic Republic of Pakistan)
Malawi1 (the Republic of Malawi) Lithuania1 (the Republic
of Lithuania)
Peru (the Republic of Peru)
Philippines1 (the Republic
of the Philippines)
Mali (the Republic of Mali) Luxembourg (the Grand
Duchy of Luxembourg)
Puerto Rico (US) 1 Qatar2 (the State of Qatar)
Mauritania (the Islamic Republic of Mauritania)
Macedonia1 (The former
Yugoslav Republic of Macedonia)
Saba (Neth.) Russia (the Russian
Federation)
Mauritius1 (the Republic of
Mauritius)
Malta1 (the Republic of
Malta)
Saint barthélemy (Fr.) Saudi-Arabia1, 2 (the
Kingdom of Saudi Arabia)
Mayotte Moldova (the Republic of
Moldova)
Saint Kitts and Nevis1 Singapore1 (the Republic of
Singapore) Morocco (the Kingdom of Morocco) Monaco (the Principality
of Monaco)
Saint Lucia1 (Saint Lucia) South-Korea1 (the Republic
of Korea) Mozambique (the Republic of
Mozambique)
Montenegro (Montenegro)
Saint Martin (Fr.) Sri Lanka1 (the Democratic
Africa Europe South America Asia Oceania North America
Namibia1 (the Republic of Namibia) Norway1 (the Kingdom of
Norway)
Saint Vincent and the
Grenadines1 (Saint
Vincent and the Grenadines)
Syria (the Syrian Arab Republic)
Niger (the Republic of the Niger) The Netherlands1 (the
Kingdom of the Netherlands)
Sint Eustatius (Neth.) Tajikistan (the Republic of
Tajikistan)
Nigeria1 (the Federal Republic of
Nigeria)
Poland1 (the Republic of
Poland)
Sint Maarten Thailand1 (the Kingdom of
Thailand) Republic of the Congo (the
Republic of the Congo)
Portugal1 (the
Portuguese Republic)
South Georgia and South Sandwhich Islands (UK)
Turkmenistan (Turkmenistan)
Réunion (France) Romania1 (Romania) The Bahamas1 (the
Commonwealth of the Bahamas)
United Arab Emirates2 (the
United Arab Emirates)
Rwanda (the Republic of Rwanda) San Marino (the
Republic of San Marino)
Suriname (the Republic of Suriname)
Uzbekistan (the Republic of Uzbekistan)
Saint Helena, Ascension and Tristan da Cunha (UK)
Serbia (the Republic of Serbia)
Trinidad and Tobago (the Republic of Trinidad and Tobago)
Viet Nam1 (the Socialist
Republic of Viet Nam)
São Tomé and Príncipe (the Democratic Republic of Sao Tome and Principe)
Slovakia (the Slovak Republic)
Turks and Caicos Islands Yemen2 (the Republic of
Yemen)
Senegal (the Republic of Senegal) Slovenia (the Republic of
Slovenia)
United States Virgin Islands
Seychelles (the Republic of Seychelles)
Spain1 (the Kingdom of
Spain)
Uruguay1 (the Eastern
Republic of Uruguay) Sierra Leone (the Republic of
Sierra Leone)
Sweden1 (the Kingdom
of Sweden)
Venezuela1 (the Bolivarian
Republic of Venezuela) Somalia (the Federal Republic of
Somalia)
Switzerland1 (the Swiss
Confederation)
South Africa1 (the Republic of
South Africa)
Turkey1 (the Republic of
Turkey) South Sudan (the Republic of
South Sudan)
Africa Europe South America Asia Oceania North America
Sudan (the Republic of the Sudan) United Kingdom1 (the
United Kingdom of Great Britain and Northern Ireland)
Swaziland (the Kingdom of Swaziland)
Vatican City
Tanzania (the United Republic of Tanzania)
Togo (the Togolese Republic) Tunisia (the Republic of Tunisia) Uganda (the Republic of Uganda) Western Sahara
Zambia (the Republic of Zambia) Zimbabwe (the Republic of Zimbabwe)
1
Country with official FBDG 2
APPENDIX B
Table I. Scoring options per item used to evaluate official FBDG worldwide
Item Scoring options
General information
Country
Name of FBDG
Source (developed by)
Year published
Years since last update
FBDG available for other population groups
FAO reference
Open answers
Graphic design aspects
Number of groups
Hierarchy of figure
Shape
Colour
Representation of foods
Text in figure
Indication of quantities
1; 2; 3; 4; 5; 6; 7; N/A Yes; No; N/A
Circle; plate; pyramid; fruit; national symbol; other; N/A
All boxes in one colour (white or other); different colours between boxes (no significance); different colours between boxes (significance); N/A
Photographs; drawings; both photographs and drawings; only text in figure; N/A
Yes, only supportive text in figure; yes, only descriptive text in figure; both supportive and descriptive text in figure; no text used in figure; N/A
Surface proportional to daily recommended intake; relative amounts present in figure; absolute amounts present in figure; relative amounts present in text; absolute amounts present in text; not present Lifestyle factors
Healthy bodyweight maintenance
Exercise
Images as part of the figure; images as group of the figure; images outside the figure; mentioned in supportive text in figure; mentioned in supportive text in brochure; not present
Images as part of the figure; images as group of the figure; images outside the figure; mentioned in supportive text in figure; mentioned in supportive text in brochure; not present
Food groups
Cereals
Vegetables
Fruits
Fruits and vegetables
Cereals, fruits and vegetables
Nuts and seeds
Fish
Meat
Eggs
Dairy products
Fish and meat
Fish, meat and eggs
Fish, meat and dairy products
Fish, meat, eggs and dairy products
Oils and fats
Sugars and syrups
Oils, fats, sugars and syrups
Beverages
Miscellaneous
Present; not present / order of food group (i.e. representation of the relative amount of food to be eaten) Present; not present / order of food group (i.e. representation of the relative amount of food to be eaten) Present; not present / order of food group (i.e. representation of the relative amount of food to be eaten) Present; not present / order of food group (i.e. representation of the relative amount of food to be eaten) Present; not present / order of food group (i.e. representation of the relative amount of food to be eaten) Present; not present / order of food group (i.e. representation of the relative amount of food to be eaten) Present; not present / order of food group (i.e. representation of the relative amount of food to be eaten) Present; not present / order of food group (i.e. representation of the relative amount of food to be eaten) Present; not present / order of food group (i.e. representation of the relative amount of food to be eaten) Present; not present / order of food group (i.e. representation of the relative amount of food to be eaten) Present; not present / order of food group (i.e. representation of the relative amount of food to be eaten) Present; not present / order of food group (i.e. representation of the relative amount of food to be eaten) Present; not present / order of food group (i.e. representation of the relative amount of food to be eaten)
Food items
Alcoholic beverages
Non-caloric beverages
Oils and fats
Salt
Sugars and/or sweeteners
Images as part of the figure; images as group of the figure; images outside the figure; mentioned in supportive text in figure; mentioned in supportive text in brochure; not present
Images as part of the figure; images as group of the figure; images outside the figure; mentioned in supportive text in figure; mentioned in supportive text in brochure; not present
Images as part of the figure; images as group of the figure; images outside the figure; mentioned in supportive text in figure; mentioned in supportive text in brochure; not present
Images as part of the figure; images as group of the figure; images outside the figure; mentioned in supportive text in figure; mentioned in supportive text in brochure; not present
Table II. Presence (%) of food groups within FBDG (figure or brochure) (n=93)
Food groups Percentage of FBDG (%)
Cereals Vegetables Fruits
Fruits and vegetables Fish
Meat Eggs
Dairy Products Fish and meat Fish, meat and eggs
Fish, meat and dairy products Fish, meat, eggs and dairy products Oils and fats
87 51 47 38 4 6 1 55 10 43 4 23 47 Sugar and syrups
Oils, fats, sugars and syrups Beverages
Miscellaneous
24 29 22 3
Table III. Presence (%) of food items within FBDG (figure or brochure) (n=93)
Food items Percentage of FBDG (%)
Alcoholic beverages Non-caloric beverages Oils and fats
Salt
Sugars and/or sweeteners
54 89 99 89 88
Table IV. Presence (%) of lifestyle factors within FBDG (figure or brochure) (n=93)
Lifestyle factors Percentage of FBDG (%)
Healthy bodyweight maintenance 55
APPENDIX C
General information tables
All analysed 226 FBDG were assigned to a continent based on the location of the country they apply to. The continents defined are; Africa, Asia, Europe, North America, Oceania and South America. The general information of all analysed FBDG is shown in table I to VI. Each table shows one continent. The tables show the country, the name of the FBDG (in English and if possible in the country’s official language), who developed the FBDG (source), what year the FBDG was published, how many years it has been since the last update, if the FBDG is available for other population groups (which we do not discuss further) than the general healthy population (e.g. children, pregnant women) and whether the FBDG was catalogued by the FAO. In the case of how many years it has been since the last update, ‘N/A’ means that either the current version is the first version, or it was impossible to find how long it has been since the last update.
Table I. General information FBDG of Africa
Country Name of FBDG Source (developed by) Year
published
Years since last update
FBDG available for other population groups
FAO reference
Benin Food Guide of Benin (French: Guide
alimentaire du Bénin)
National council of Food and Nutrition 2014 N/A Children,
adolescents
No
Ghana The 3 Food Steps Ministry of Health 2009 N/A Children and
adolescents, pregnant women, elderly
No
Malawi The six food groups of Malawi Ministry of Health 2014 N/A No No
Mauritius Dietary guidelines for the prevention of
NCD’S in Mauritius
Ministry of Health and Quality of Life 1999+ N/A Infants No
Namibia Food and nutrition guidelines for
Namibia
Ministry of Health and Social Services 2000 N/A No Yes
Nigeria Food-based dietary guidelines for
Nigeria - a guide to healthy eating
Ministries of Health, Agriculture and Rural Development and Information; universities, the World Health Organization, Helen Keller
International, International Institute of Tropical Agriculture, and paediatric and nutrition societies
2001 N/A Infants, children,
adolescents, pregnant women, elderly
Country Name of FBDG Source (developed by) Year published
Years since last update
FBDG available for other population groups
FAO reference
South-Africa
Food-Based Dietary Guidelines for South Africa
National Department of Health, Directorate of Nutrition.
2012 9 Children Yes
Table II. General information FBDG of Asia
Country Name of FBDG Source (developed by) Year
published
Years since last update
FBDG available for other population groups
FAO reference
Arab countries Food Dome: dietary guidelines for
the Arab countries.
Arabic Centre for Nutrition 2012 N/A Infants, children,
adolescents, pregnant women, elderly
No
Bangladesh Dietary guidelines for Bangladesh The Bangladesh National Nutrition
Council, Ministry of Health and Family Welfare
2013 3 Pregnant women Yes
China Dietary guidelines for Chinese
residents ( 中国居民膳食指南)
Chinese nutrition society 2007 10 Infants, children,
adolescents, pregnant women, elderly
Yes
India Dietary guidelines for Indians -a
manual
National Institute of Nutrition 2014 4 Infants, children,
adolescents, pregnant women, elderly
Yes
Iran Food-based dietary guidelines for
Iran (Persian: ﯽﯾاذﻏ یﺎھدوﻣﻧھر نارﯾا)
The Office of Community Nutrition in the Ministry of Health and Medical Education, the Iranian Nutrition Society and the National Nutrition and Food Technology Research Institute
2006 10 No Yes
Japan Japan Food Guide Spinning Top the Japan Dietetic Association 2005 N/A No No
Lebanon The Lebanese Cedar Food Guide Faculty of Agricultural and Food
Sciences, American University of Beirut
2013 N/A No No
Country Name of FBDG Source (developed by) Year published
Years since last update
FBDG available for other population groups
FAO reference
Mongolia Dietary guidelines for Mongolians Ministry of Health 2010 5 No Yes
Nepal Food-based dietary guidelines for
Nepalese
Ministry of Health and Population 2012 8 No Yes
Oman The Omani guide to healthy eating
(Arabic: ﻲﺣﺻﻟا ءاذﻐﻠﻟ ﻲﻧﺎﻣﻌﻟا لﯾﻟدﻟا)
Department of Nutrition, Ministry of Health Oman
2009 N/A No Yes
Philippines 2012 nutritional guidelines for
Filipinos -Eating Plan for Healthy Living (Filipino: Mga Gabay sa Wastong Nutrisyon Para sa Pilipino)
Food and Nutrition Research Institute 2012 12 Infants, children,
adolescents, pregnant women, breastfeeding women, elderly
Yes
Saudi Arabia The Healthy Food Palm for Kingdom
of Saudi Arabia
General Directorate of Nutrition 2012 N/A No No
Singapore Build a Healthy Food Foundation Health Promotion Board 2014 11 No No
South Korea Dietary guidelines for Koreans
-Korea Food Bike (-Korean: 한국인을
위한식생활지침)
Korean Nutrition Society 2010 7 Infants, children,
adolescents, pregnant women, elderly
No
Sri Lanka Food-based dietary guidelines for Sri
Lankans
Nutrition Division of the Ministry of Health
2011 9 Children,
adolescents, elderly Yes
Thailand Food-based dietary guidelines for
Thai also called 'the nutrition flag'
Ministry of Health 1998 12 Infants, children Yes
Viet Nam 10 tips on proper nutrition for period
2013–2020 (Vietnamese: 10 Lời khuyên dinh dưỡng hợp lý đến năm 2020)
National Institute of Nutrition 2013 7 Children Yes
Table III. General information FBDG of Europe
Country Name of FBDG Source (developed by) Year
published
Years since last update
FBDG available for other population groups
Country Name of FBDG Source (developed by) Year published
Years since last update
FBDG available for other population groups
FAO reference
Albania Recommendations on healthy nutrition in
Albania (Albanian: Rekomandime për një ushqyerje të shëndetshme në Shqipëri)
Ministry of Health 2008 N/A No Yes
Austria The Austrian food pyramid – 7 steps to
health (German: Die österreichische Ernährungspyramide – 7 Stufen zur Gesundheit)
Ministry of Health 2010 N/A Children, pregnant
women
Yes
Belgium Practical guidelines for healthy eating
(Dutch: Gezonde voeding: de praktische gidsen; French: Les guides pratiques du Plan National Nutrition Santé)
Federal public service of public health 2005 N/A Children,
adolescents, elderly Yes
Bosnia and Herzegovi na
Guide on nutrition for the adult
population (Bosnian: Vodič o ishrani za odraslu populaciju)
Institute of public health 2004 N/A No Yes
Bulgaria Food based dietary guidelines for adults
in Bulgaria
Ministry of Health 2006 N/A No No
Croatia Dietary guidelines (Croatian:
Prehrambene smjernice)
Ministry of Health 2002 N/A Children, children
and adolescents
Yes
Cyprus National nutrition and exercise guidelines
(Greek: εθνικές οδηγίες διατροφής και άσκησης)
Ministry of Health 2007 N/A Children Yes
Denmark The official dietary guidelines (Danish:
De officielle kostråd)
Ministry of food, agriculture and fisheries
2013 N/A No Yes
Estonia Estonian food and nutrition
recommendations (Estonian: Eesti toitumis-ja toidusoovitused)
National Institute of Health Development
2006 N/A Children,
adolescents, pregnant women, elderly
Yes
Finland Finnish nutrition recommendations 2014
(Finnish: Terveyttä ruoasta. Suomalaiset ravitsemussuositukset 2014)
Nutritional Centre 2014 N/A No Yes
France Eat well, move, protect your health
(French: Bien manger, bouger, proteger votre sante)
Ministry of Social affairs, Health and Women’s Rights
Country Name of FBDG Source (developed by) Year published
Years since last update
FBDG available for other population groups
FAO reference
Georgia Healthy eating – the main key to health
(Georgian: jansaRi kveba – janmrTelobis mTavari gasaRebi)
National Centre for Disease Control and Public Health
2005 N/A No Yes
Germany Ten guidelines for wholesome eating and
beverageing from the German Nutrition Society (German: Vollwertig essen und trinken nach den 10 Regeln der DGE)
Nutritional Centre 2013 N/A No Yes
Greece Dietary guidelines for adults in Greece WHO Collaborating Centre for Food
and Nutrition Policies and Ministry of Health
1999 N/A No Yes
Greenland The 10 dietary guidelines (Danish: De 10 kostråd)
Nutrition council 2005 N/A Children and
adolescents, pregnant women, diabetics
No
Hungary Dietary guidelines for the adult
population in Hungary (Hungarian: Táplálkozási ajánlások a magyarországi)
Ministries of Health, Agriculture and Education
2004 17 No Yes
Iceland Dietary and nutrient guidelines
(Icelandic: Ráðleggingar um mataræði og næringarefni)
The Directorate of Health 2006 N/A No Yes
Ireland Your guide to Healthy Eating Using the
Food Pyramid
Ministry of Health 2015 3 No No
Israel The Israeli food pyramid (Hebrew:
תדימריפ ןוזמה ילארשיה)
Ministry of Health 2008 10 No Yes
Italy Guidelines for healthy Italian food habits,
2003 (Italian: Linee guida per una sana alimentazione italiana, Revisione 2003)
Italian National Research Institute on Food and Nutrition
2003 N/A No Yes
Latvia Dietary guidelines for adults (Latvian:
Veselīga uztura ieteikumi pieaugušajiem)
Ministry of Health 2008 N/A Children,
adolescents, elderly Yes
Country Name of FBDG Source (developed by) Year published
Years since last update
FBDG available for other population groups
FAO reference
Macedoni a
Dietary guidelines for the population in The former Yugoslav Republic of Macedonia (Macedonian: Водич за исхрана на населението во Република Македонија)
Institute of public health 2014 6 No Yes
Malta 8 steps towards a healthy lifestyle The Health Promotion and Disease
Prevention Dictorate, Ministry of Health
2011 N/A No Yes
Netherlan ds
Guidelines Wheel of Five (Dutch: Richtlijnen Schijf van Vijf
The Netherlands Nutrition Centre 2016 5 No Yes
Norway Dietary Guidelines (Norwegian:
Nøkkelråd for et sunt kosthold)
Directorate of Health 2012 N/A No No
Poland Principles of healthy eating (Polish:
Zasady zdrowego żywienia)
National Food and Nutrition Institute in collaboration with the Ministry of Health
2010 N/A Children,
adolescents
Yes
Portugal The new food wheel (Portugese: A nova
Roda Dos Alimentos)
Ministry of Health 2015 10 No No
Romania Guidelines for a healthy diet (Romanian:
Reguli pentru o alimentaţie sănătoasă)
Ministry of Health 2006 N/A No Yes
Spain Eat healthy and move: 12 healthy
decisions (Spanish: Come sano y muévete: 12 decisiones saludables)
Ministry of Health 2008 N/A Children and
adolescents
Yes
Sweden Find your way to eat greener, not too
much and to be active!
National Food Agency 2015 6 No Yes
Switzerlan d
The Swiss food pyramid (German: Lebensmittelpyramide)
Swiss Society for Nutrition 2011 N/A Children Yes
Turkey Dietary guidelines for Turkey (Turkish:
Türkiye'ye Özgü Beslenme Rehberi)
Ministry of Health 2006 1 No Yes
United Kingdom
Table IV. General information FBDG of North America
Country Name of FBDG Source (developed by) Year
published
Years since last update
FBDG available for other population groups
FAO reference
Belize Food-based dietary guidelines for Belize Ministry of Heath, Agriculture and
Education & Variety of institutions represented in the multi-sectorial group
2012 N/A No Yes
Bermuda EatWell Bermuda Ministry of Health and Environment &
Public Health Nutritionists
2012 N/A No No
Canada Canada's Food Guide Minister of Health Canada 2011 4 Children, pregnant
women, elderly
Yes
Costa Rica
Dietary guidelines for Costa Rica (Spanish: Guías alimentarias para Costa Rica)
Ministry of Health & An Intersectoral Commission on Dietary Guidelines
2010 13 No Yes
El Salvador
Dietary guidelines for Salvadorian families (Spanish: Guías alimentarias para las familias salvadoreñas)
Ministry of Health & National Dietary Guidelines Committee
2012 11 No Yes
Guatemal a
Dietary guidelines for Guatemala. Recommendations for healthy eating (Spanish: Guías alimentarias para Guatemala. Recomendaciones para una alimentación saludable)
The Ministry of Public Health and Social Assistance & National Dietary
Guidelines Committee
2012 16 Infants Yes
Honduras Dietary guidelines for Honduras. Tips for healthy eating (Spanish: Guías
alimentarias de Honduras. Consejos para una alimentación sana)
The National Dietary Guidelines Committee & National Food Security Programme of the Ministry of Health
2013 2 No Yes
Mexico The plate of good eating. (Spanish: El
plato del bien comer)
Ministry of public health, department of Medicine & Panel of Nutritional Experts
2005 6 No No
Panama Dietary guidelines for Panama (Spanish:
Guías alimentarias para Panamá)
Dietary Guidelines National Committee, The Institute of Nutrition of Central America and Panama & the Pan American Health Organization
2013 16 Infants Yes
United States of America
Myplate (Dietary guidelines for Americans) The U.S. Department of Agriculture and the U.S. Department of Health and Human & dietary guidelines advisory committee
Table V. General information FBDG of Oceania
Country Name of FBDG Source (developed by) Year
published
Years since last update
FBDG available for other population groups
FAO reference
Australia Australian guide to healthy eating National Health and Medical Research
Council
2013 10 No Yes
Fiji 3 Food Groups, Food and Health
guidelines for Fiji
National Food and Nutrition Centre 2013 2 No Yes
Indonesi a
The Indonesian Dietary Guidelines Ministry of Health 1995 N/A No No
New Zealand
NZ Food and Nutrition Guideline statements for healthy adults
Ministry of Health 2013 N/A Infants, children and
adolescents, pregnant women, elderly
Yes
Table VI. General information FBDG of South America
Country Name of FBDG Source (developed by) Year
published
Years since last update
FBDG available for other groups
FAO reference Antigua and
Barbuda
Food-based dietary guidelines for Antigue and Barbuda
Developed by the Ministries of Health, Education and Agriculture in
collaboration with FAO.
2013 N/A No Yes
Argentina The nutritional oval (Spanish: Óvalo
nutricional)
Asociación Argentina de Diestistas y Nutricionistas Dietistas - AADYND + Colegio de Nutricinistas de la Provincia de Córdoba. Publicated by: Ministerio de Agricultura, Ganedería y Pesca. Presidencia de la Nacíon.
Country Name of FBDG Source (developed by) Year published
Years since last update
FBDG available for other groups
FAO reference The
Bahamas
The new dietary guidelines for the Bahamas
Developed in a process led by the Ministry of Health in coordination with the Ministries of Education and Agriculture, the Department of Statistics, universities,
non-governmental organization, the FAO, the Institute of Nutrtition of Central America and Panama and the
Caribbean Food and Nutrition Institute.
2002 N/A No Yes
Barbados Food-based dietary guidelines for
Barbados
Developed by the National Nutrition centre (part of the Ministry fo Health) with support from the FAO. They have been endorsed by the Cabinet and the Ministry of Health of Barbados.
2009 N/A No Yes
Brazil Dietary Guidelines for the Brazilian
Population 2014 (Portuguese: Guia alimentar para a população brasileira 2014)
Ministry of Health and the Center for Epidemiological Research in Nutrition and Health of the University of Sao Paulo (NUPENS/USP), with the support of the Brazilian Pan American Helath Organization Office
2014 8 Infants Yes
Chile Dietary guidelines for the Chilean
population, Ministry of Health 2013 (Spanish: Guías alimentarias para la población chilena, Ministerio de Salud 2013)
The Institute of Nutrition and Food Technolgy (INTA) of the University of Chile and in collaboration with the FAO. The guidelines were endorsed by the Ministry of Health.
2013 8 Infants, children and
adolescents, elderly Yes
Colombia Dietary Guidelines for Colombians
(Spanish: Guías alimentarias para la población colombiana)
Instituto Colombiano del Bienestar Familiar, Ministerio de la Protección Social, República de Colombia