Forecasting Cryptocurrency Price Using Twitter Sentiment Variable
Utilizing Autoregressive Integrated Moving Average ModelA. Fuaddi Yustindra William B. Claster PhD
College of International Management, Ritsumeikan Asia Pacific University, Beppu, Oita, Japan
Abstract : The growing interest in cryptocurrency ーparticularly Bitcoinーin Japan has brought many people to put attention on its trading market and how the price will move in the future. There are numerous factors influencing the movement that we can use for forecasting but public sentiment is said to be one of the most useful. The aim of the study is to discuss the correlation between cryptocurrency (Bitcoin) price movement and public sentiment derived from Twitter. Subsequent to this, time-series analysis with Autoregressive Integrated Moving Average (ARIMA) is utilized to perform the forecasting as well as to identify whether there is any difference when we involve the sentiment variables to our forecasting process. In this study, including public sentiment aspects instead of only using historical data leads to better forecast. The Mean Absolute Scaled Error (MASE) measurement is conducted to evaluate the performance of forecasted models. The result shows significant error improvement from 32.57% to 5.81% when we use multivariable forecasting approach.
Keywords: Cryptocurrency price, Bitcoin, Twitter sentiment analysis, Japanese market, time series forecasting, ARIMA model.
Introduction
Big Data has been a buzzword across the internet for recent years. It comes in various forms such as text, sound, image, video. Nowadays, people get data from everywhere, for example, social media. Specifically when we talk about Twitter, they all contain the data (tweets, images, videos) which we can take out some information from. In terms of financial market, Twitter data has been utilized to predict the movement of financial instruments value as people perception might have some influence on it. As the time goes by, financial market also reforms. Not only conventional securities like stocks and bonds are being traded in the exchange floor, but cryptocurrencies are turning
into hot items. In spite of existing literatures, there has been not so much study on cryptocurrency price fluctuation and public opinion particularly in Japanese market. This research aims to address our questions that are inspired from emerging interest in cryptocurrency (Bitcoin) trading in Japanese market and the existing public doubt about the correlation between tweets and price movement.
1. Does Twitter sentiment impact the movement of Bitcoin price?
Research Methodology
First of all, we collect 2 types of data; historical daily price data of Bitcoin towards Japanese Yen (JPY) and Japanese tweets regarding Bitcoin. We first download the CSV file of price data. Then, we retrieved the tweets data from Twitter API and load it to Google Sheets. To get the sentiments, we do the analysis in Google Cloud Platform. After all the tweet sentiments are obtained, we get our final dataset ready. From the dataset, we can identify the relationship between the price and the sentiment. The second step would be to analyze and utilize the time series data to predict the movement of cryptocurrency price. We implement the Autoregressive Integrated Moving Average (ARIMA) model since it is well established and suitable to perform a time series forecasting. We will have 2 models to be compared; ARIMA with single input and ARIMAX with multiple inputs. Then we will evaluate the models and compare it with the actual observation.
Dataset
● Data Collection
The first data (historical price of cryptocurrency) is retrieved from CoinGecko website (http://www.coingecko.com). We retrieved daily data from December 2017 until January 2018 (62 observations) and keep it as training data. While for our out-of-sample data, we have first 6 days (10% of training data) of February 2018. There are 4 features in the raw data; Date, Price, Market Cap, and Volume for each cryptocurrency. The second data (tweets sentiment) is collected from Twitter Application Programming Interface (API). We utilize GetOldTweets package written in Python by Jefferson Henriqueーsourced from GitHubーto deal with that old tweets limitation. We put #ビットコイ ン as querysearch to obtain Japanese tweets related to Bitcoin. Also, we input 2017-12-01 on since and 2018-02-06 on until so we can get tweets in that certain period. Finally, after we finished all the data retrieving, there are 10 features in the raw data; username, date, retweets, favorites, text, geo, mentions, hashtags, id, and permalink.
● Data Preprocessing
analysis. Some things we do includes removing punctuations and URLs. Finally, in total we have 74,367 tweets related to Bitcoin (all cleaned) in period of 2 months from December 2017 to January 2018.
● Sentiment Data Extraction
To extract the sentiment from each tweet, we use Google Cloud Platform to make the work efficient. We integrate Google Cloud Natural Language and Google Sheets by using the feature Google Apps Script feature in Tools tab. Then we execute the script, and the sentiment score and sentiment magnitude of each tweet is generated. After all the sentiments are extracted, we take the average value of sentiment score and sentiment magnitude per day which later then to be added as features to our dataset. Finally, we join all our preprocessed data into one final dataset that contains Date, Price, Sentiment Score, and Sentiment Magnitude.
ARIMA Time Series Modelling
The ARIMA (Autoregressive Integrated Moving-Average) is one of the most popular forecasting techniques by using historical data (Box and Jenkins, 1970). An ARIMA model predicts a value in as a linear combination of its own past values, past errors, and current and past values of other time series data (SAS, 2006). Alternatively, ARIMAX model is another term for general ARIMA model that involves other variables as inputs in fitting the model; sometimes also referred as dynamic regression.
An ARIMA model is generally written by the notation ARIMA(p,d,q) where
p order of autoregressive part
d order of the differencing
q order of the moving average part
Autoregressive (AR) term refers to the lags of the stationarized series in the forecasting equation while moving average (MA) term is defined as the lags of the forecast errors, and a time series data that is stationarized through differencing is considered as integrated (I) version of a stationary series. We need to find the optimal parameters value (p,d,q) in order to have the best forecasting model. In this project we first find the value of d (order of the differencing), then we try to find the best model by attempting all the possibilities, then find the best set of parameter.
● Data Visualization
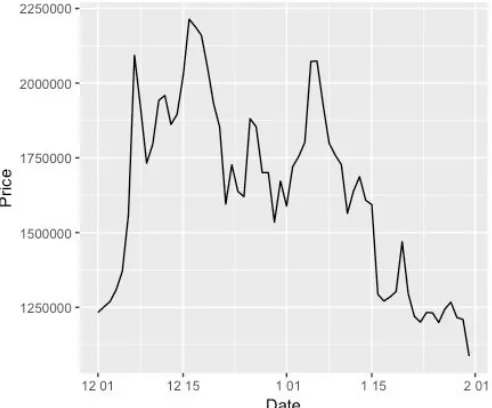
Figure 1 : Bitcoin price chart
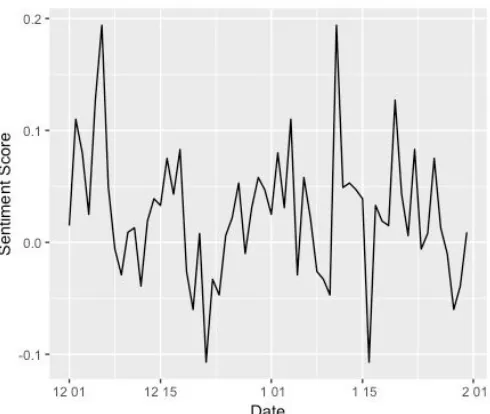
Figure 2 : Bitcoin sentiment score chart
From Figure 2, we can see that the there was barely an obvious trend in sentiment score variable. It indicates that people opinion on a certain day might have no relation with the day before of after it.
● Data Stationarization
Stationarizing the time series dataset through differencing (if needed) is an important step in the process of fitting into ARIMA model (Duke, 2011). Differencing could be simply defined as a method to remove the random trend in our dataset. Differencing means taking the difference between one data point and the previous one (Y′t =Yt−Yt−1 ), thus we will have a more stable and better data to process. In differencing, usually we perform first degree differencing up to second degree differencing. We can choose which degree to use by inspecting the charts comparing the raw data and differenced data to find which one is the most stationary.
Figure 3 : Bitcoin price chart (raw and differenced)
we need to further stationarize our data if the p-value is greater than 0.05. All three tests imply that our dataset is stationary and ready for the analysis. Then, we build the ARIMA model by just using single input (price) to forecast the future value of itself. Then we apply the function with exogenous variables (ARIMAX model). In this case, we use Sentiment Score and Sentiment Magnitude variables. Finally, we compare the two models with the actual observations and measure its Mean Average Percentage Error (MAPE).
Results and Discussion
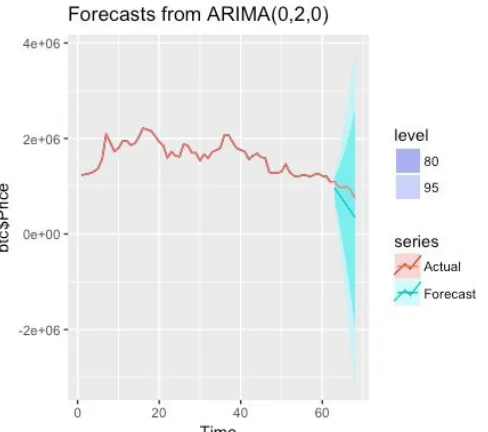
Figure 4 : ARIMA single input model forecast
Figure 4 shows (0,2,0) as our parameter for this ARIMA model in univariate input. It predicts price to be fallen on few next values. However, the forecast seems not to be really realistic because it is just a straight line that follows the decline rate between the last observation and its previous observation, also the 80% and 95% confidence interval seems too wide.
Table 1 : Actual-forecast comparison table (ARIMA)
Actual Forecast MAPE 2018/02/01 1104579 963923 12.73% 2018/02/02 992609 841252 15.25% 2018/02/03 972439 718581 26.11% 2018/02/04 990385 595910 39.83% 2018/02/05 916960 473239 48.39% 2018/02/06 747777 350568 53.12%
Average MAPE 32.57%
Figure 5 : ARIMAX multiple input model forecast
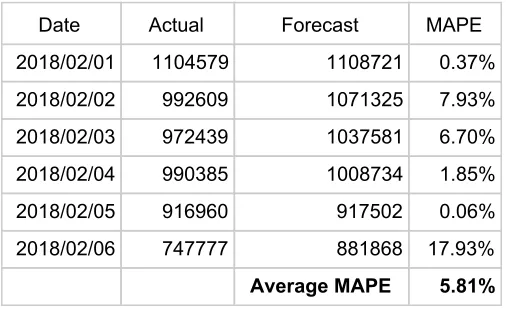
Table 2 : Actual-forecast comparison table (ARIMAX)
Date Actual Forecast MAPE 2018/02/01 1104579 1108721 0.37% 2018/02/02 992609 1071325 7.93% 2018/02/03 972439 1037581 6.70% 2018/02/04 990385 1008734 1.85% 2018/02/05 916960 917502 0.06% 2018/02/06 747777 881868 17.93%
Average MAPE 5.81%
Future Work and Conclusion
The scope of this thesis could provide the basic and general forecast of cryptocurrency value in the short term with decent accuracy. However, there is a lot of spaces for further improvement. Future related research should involve more data as inputs as it will enhance the credibility of the forecasted result. Finding a method to retrieve huge amount of data and manage it into a complete set in a faster way is preferrable to make the work more efficient. Additionally, an experiment to utilize various forecasting model and technique (e.g. ANN, SVM, ELM) would also be recommended. The use of more advanced computing tools and software will also be helpful to acquire better result and performance.
In the end of this research, we managed to answer the following questions;
Does Twitter sentiment impact the movement of cryptocurrency price? - Yes, we believe that there is strong correlation between the sentiment value and the price fluctuation. It is because the output of forecast is changed when we include the sentiment variables in modelling process.
Does forecasting with multivariate inputs (price and sentiment) work better than with only single input (price)? - Yes, because we can see the
improvement in performance when we perform the multiple input forecasting based on the measured error of the forecast (MASE). The error measured by MASE using ARIMA was 32.57%, whereas using ARIMAX the error were 5.81%.
References
Adhikari, Ratnadip & K. Agrawal, R. (2013). An Introductory Study on Time series Modeling and Forecasting. 10.13140/2.1.2771.8084.
Box, G.E.P., and Jenkins, G., (1970). Time Series Analysis, Forecasting and Control, Holden-Day, San Fransisco.
Duke. (2011). Stationarity and differencing of time series data. Retrieved from
https://people.duke.edu/~rnau/411diff.htm
Hyndman, RJ and Athanasopoulos, G. (2013), Forecasting: principles and practice. OTexts: Melbourne, Australia. Retrieved from
http;//otexts.org/fpp/
Martinez-Camara, E., Martin-Valdivia, M., Urena-Lopez, L., & Montejo-Raez, A. (2014). Sentiment analysis in Twitter. Natural Language Engineering, 20(1), 1-28. Retrieved from
doi:10.1017/S1351324912000332
Rao, Tushar & Srivastava, Saket. (2012). Analyzing Stock Market Movements Using Twitter Sentiment Analysis. 119-123. 10.1109/ASONAM.2012.30.
SAS. (2012). SAS/ETS(R) 12.3 User's Guide. Retrieved from