POOL BOILING CHF FOR PENTANE, HEXANE, METHANOL, FC-72,
FC-87, AND R113 ON A SMOOTH HORIZONTAL SURFACE
Cheng-Kang Guan, James F. Klausner
*, Renwei Mei
Department of Mechanical and Aerospace Engineering, University of Florida, Gainesville, Florida, 32611, USA
A
BSTRACTPool boiling critical heat flux (CHF) has been measured for pentane, hexane, methanol, FC-72, FC-87, and R113 on a 25.4 mm diameter smooth brass horizontal surface at five different reduced pressures ranging from 0.01to 0.24. The CHF data are compared with various established CHF models as well as the new mechanistic CHF lift-off model recently proposed by the authors. The dependence of CHF on pressure is examined, and it is found that the lift-off model gives a reasonably good prediction of changes in CHF with step changes in the reduced pressure. The R113 and FC-72 boiling curves suggest that a partially wetting transition boiling regime is encountered just prior to CHF.
Keywords: critical heat flux, pool boiling, lift-off model.
*Corresponding author Email:[email protected]
1.
INTRODUCTION
Critical heat flux (CHF) is the maximum heat flux that can be applied to a boiling system while operating in the nucleate boiling heat transfer regime. Once the applied heat flux exceeds CHF, a vapor film will blanket the heating surface and create substantial resistance to heat transfer. The surface temperature of the boiling system increases rapidly in a short duration of time when the CHF is exceeded. Unless the system is designed for operation in the film boiling regime, there is a risk of catastrophic system failure. Thus, the CHF is a heat transfer limit that is of substantial interest in boiling systems.
The most well-known hydrodynamic CHF model is that proposed by Zuber (1959) for a horizontal surface of infinite extent,
4 1 4 1 2 , 1 ) ( 131 . 0 " l v v v l fg v Zuber CHF g h q (1)
where is the density, is the surface tension, g is the gravitational acceleration, hfg is the latent heat of vaporization, and the subscripts l and v refer to the liquid and vapor, respectively. Haramura and Katto (1983) postulated that CHF occurs when the heat flux is sufficient to fully evaporate the liquid macro layer, and their well known model takes the form,
16 5 5 3 16 5 8 5 , , 1 16 11 1 1 5 . 5 " " v l v l w v w v Zuber CHF Katto CHF A A A A q q
(2)
where 2 . 0 0584 . 0 v l w v A A (3)
Recently Kandlikar (2001) introduced a vapor momentum flux model that takes the form,
0.5 , , cos cos 1 4 2 16 cos 1 5 .7
Zuber CHF Kandlikar CHF q q (4)
where β is the liquid/solid contact angle, and θ is the surface inclination angle. Kandlikar’s model is notable in that it attempts to account for the liquid wettability at the surface. More recently, Guan et al. (2011) introduced a new horizontal pool boiling CHF model that is based on a liquid macrolayer lift-off mechanism. The CHF mechanism is the same as that proposed by Galloway and Mudawar (1993) for vertical flow boiling, Sturgis and Mudawar (1999) for horizontal flow boiling, and Mudawar et al. (1997) for vertical pool boiling, all of which are successful in predicting CHF over a wide parameter space. The liquid macrolayer lift-off model introduced by Guan, et al. (2011) unifies the horizontal CHF mechanism with that for both flow boiling and vertical pool boiling.
2.
THE MECHANISM OF LIFT-OFF MODEL FOR
CHF
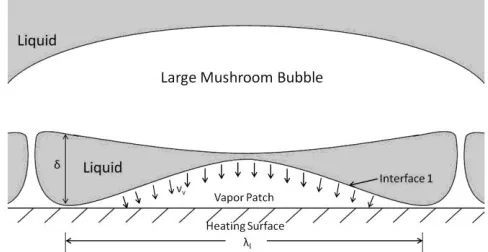
A detailed derivation of the horizontal pool boiling lift-off model is given by Guan et al. (2011), and a brief description of the model is summarized here. Fig. 1 depicts a two-dimensional liquid/vapor structure operating near the critical heat flux. As suggested by Haramura and Katto (1983), the liquid macrolayer resides on the heating surface and large mushroom bubbles, fed by vapor jets, hover over the liquid macrolayer. Experimental observations show that the large mushroom bubbles depart from the liquid macrolayer in a periodic manner. Small disturbances near the three-phase contact line (liquid/vapor/solid) can result in the formation of localized vapor patches. Fig. 2 depicts a two-dimensional disturbance to the liquid macrolayer by a vapor patch that makes contact with the heating surface. The vapor patch resides beneath the liquid macrolayer, and nucleate boiling can only be sustained when the liquid macrolayer re-wets the heating surface. Due to heat transfer, the liquid/vapor interface residing above the vapor patch is evaporating, and vapor is ejected
Frontiers in Heat and Mass Transfer
beneath the macrolayer and toward the heating surface. The lift-off model assumes that the macrolayer cannot re-wet the heating surface when the reaction due to the evaporating vapor momentum flux exceeds the pressure pushing downward on the liquid/vapor interface. The difference in the pressure above and below liquid/vapor interface 1 drives the interface toward the heating surface, and the vapor momentum flux acts to lift the interface away from the surface. The wavelength, λl, between two stems is the most dangerous Taylor wavelength (Haramura and Katto 1983), and the macrolayer thickness is half of the critical Kelvin-Helmholtz wavelength (Rajvanshi al. 1992). The ratio of the critical heat flux predicted by the lift-off model compared with that of Zuber is
1 . 0
,
87 . 1 "
"
l v Zuber
CHF CHF
q q
(5)
In the early work of Guan et al. (2011) pool boiling curves and CHF data were measured for pentane, hexane, and FC-72 at three different pressures. It is the objective of this work to explore the efficacy of the lift-off model in predicting horizontal pool boiling CHF over a wider parameter space. As such, horizontal saturated pool boiling curves and CHF are measured for pentane, hexane, methanol, FC-72, FC-87, and R113 at five different operating pressures ranging from 100 to 450 kPa (reduced pressure ranging from 0.01-0.24). It is of particular interest to compare the variation in CHF with pressure compared to that predicted with the lift-off model.
Fig. 1 Idealized representation of liquid macrolayer and mushroom
bubble.
Fig. 2Sketch of 2-D disturbance to the liquid macrolayer by a vapor
patch.
3.
RESULTS AND DISCUSSION
The horizontal saturated pool boiling curves and CHF are measured using the experimental pool boiling facility show in Fig. 3 and described in detail by Guan et al. (2011). A 25.4 mm diameter brass surface with 650 nm RMS roughness is used as the boiling surface. Since all of the fluids considered are highly wetting, the surface is considered smooth for boiling heat transfer applications. The uncertainty in measuring heat flux, temperature, and pressure are ±7 W/m2, ±0.8 °C, and ±3 kPa. When measuring the CHF with pentane,
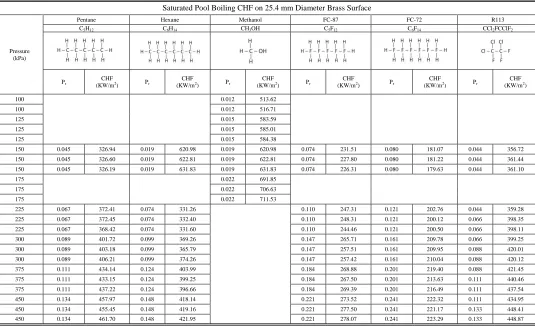
Hexane, FC-72, FC-87, and R113 pressures of 150, 225, 300, 375, and 450 kPa are considered. Due to rapidly increasing temperature after CHF, the heating surface temperature may exceed 280 °C at a pressure higher than 175 kPa with methanol. At this high temperature and pressure, the polymer seals for the boiling facility start degrading. Therefore, the methanol CHF measurements are made at pressures of 100, 125, 150, and 175 kPa. The saturated pool boiling experiments for all the fluids at different pressures are repeated at least twice to check for repeatability. The CHF measurements for all the working fluids are reported in Table 1, and the repeatability is within ±5% as shown.
Fig. 3Sketch of the Pool Boiling Facility.
Pentane
Wall Superheat Temp (K)
0 5 10 15 20 25
H
e
a
t
Flu
x
(
kW
/m
2)
0 100 200 300 400 500
150kPa 225kPa 300kPa 375kPa 450kPa
Fig. 4Boiling curves for pentane on brass heater surface.
Hexane
Wall Superheat Temp (K)
0 5 10 15 20 25
H
e
a
t
Flu
x
(
kW
/m
2)
0 100 200 300 400 500
150kPa 225kPa 300kPa 375kPa 450kPa
FC-72
Wall Superheat Temp (K)
0 2 4 6 8 10 12 14
H
e
a
t
Flu
x
(
kW
/m
2)
0 50 100 150 200 250
150kPa 225kPa 300kPa 375kPa 450kPa
Fig. 6Boiling curves for FC-72 on brass heater surface.
FC-87
Wall SuperheatTemp (K)
0 2 4 6 8 10 12 14 16 18
H
e
a
t
Flu
x
(
kW
/m
2)
0 50 100 150 200 250 300
150kPa 225kPa 300kPa 375kPa 450kPa
Fig. 7Boiling curves for FC-87 on brass heater surface.
R113
Wall Superheat Temp (K)
0 10 20 30 40
H
e
a
t
Flu
x
(
kW
/m
2)
0 100 200 300 400 500
150kPa 225kPa 300kPa 375kPa 450kPa
Fig. 8Boiling curves for R113 on brass heater surface.
Methanol
Wall Superheat Temp (K)
0 5 10 15 20
H
e
a
t
F
lu
x
(k
W
/m
2)
0 200 400 600 800
100kPa 125kPa 150kPa 175kPa
Fig. 9Boiling curves for methanol on brass heater surface.
Table 1 Measured CHF for pentane, hexane, methanol, FC-87, FC-72, and R113 in pool boiling at different pressures.
Saturated Pool Boiling CHF on 25.4 mm Diameter Brass Surface
Pressure (kPa)
Pentane Hexane Methanol FC-87 FC-72 R113
C5H12 C6H14 CH3OH C5F12 C6F14 CCl2FCClF2
Pr
CHF
(KW/m2) Pr
CHF
(KW/m2) Pr
CHF
(KW/m2) Pr
CHF
(KW/m2) Pr
CHF
(KW/m2) Pr
CHF (KW/m2)
100 0.012 513.62
100 0.012 516.71
125 0.015 583.59
125 0.015 585.01
125 0.015 584.38
150 0.045 326.94 0.019 620.98 0.019 620.98 0.074 231.51 0.080 181.07 0.044 356.72
150 0.045 326.60 0.019 622.81 0.019 622.81 0.074 227.80 0.080 181.22 0.044 361.44
150 0.045 326.19 0.019 631.83 0.019 631.83 0.074 226.31 0.080 179.63 0.044 361.10
175 0.022 691.85
175 0.022 706.63
175 0.022 711.53
225 0.067 372.41 0.074 331.26 0.110 247.31 0.121 202.76 0.044 359.28
225 0.067 372.45 0.074 332.40 0.110 248.31 0.121 200.12 0.066 398.35
225 0.067 368.42 0.074 331.60 0.110 244.46 0.121 200.50 0.066 398.11
300 0.089 401.72 0.099 369.26 0.147 265.71 0.161 209.78 0.066 399.25
300 0.089 403.18 0.099 365.79 0.147 257.51 0.161 209.95 0.088 420.01
300 0.089 406.21 0.099 374.26 0.147 257.42 0.161 210.04 0.088 420.12
375 0.111 434.14 0.124 403.99 0.184 268.88 0.201 219.40 0.088 421.45
375 0.111 433.15 0.124 399.25 0.184 267.50 0.201 213.63 0.111 440.46
375 0.111 437.22 0.124 396.66 0.184 269.39 0.201 216.49 0.111 437.54
450 0.134 457.97 0.148 418.14 0.221 273.52 0.241 222.32 0.111 434.95
450 0.134 455.45 0.148 419.16 0.221 277.50 0.241 221.17 0.133 448.41
450 0.134 461.70 0.148 421.95 0.221 278.07 0.241 223.29 0.133 448.87
The saturated pool boiling curves obtained for pentane, hexane, FC-72, FC-87, R113 and methanol at five different pressures are shown in Fig. 4-9, respectively. In the boiling curves, the wall superheat varies more than 20% with given heat flux under the same pressure and testing fluid before and at incipience. The reason for the substantial wall superheat temperature fluctuations is due to the edge boiling effect. After incipience, the wall superheat temperature with a given heat flux varies within 10% for R113 and methanol and varies within 5% for pentane, hexane, FC-72 and FC-87. Hence, edge boiling only affects the incipient superheat and does not impact CHF.
The pool boiling curves displayed in Fig. 4-8 clearly illustrate that the rate of heat transfer increases with increasing pressure as reflected by boiling curves shifting to the left, as expected. Decreasing vapor bubble departure diameter from nucleation sites is also observed with increasing the system pressure as suggested by Zeng et al. (1993). On average, nucleation sites with smaller departing bubbles can remove heat at a faster rate than those with larger departing bubbles. The methanol boiling curves shown in Fig. 9 for pressures ranging from 100 to 175 kPa show only a slight improvement in the heat transfer rate with increasing pressure. This is consistent with the observation that methanol vapor bubbles departing the heating surface do not vary appreciably with increasing pressure.
The large macro bubbles that depart from the liquid macrolayer are measured during the transition from the nucleate to film boiling regime. The major chord length of the bubbles is measured and listed in Table 2 and compared with the Taylor wavelength. It is observed that the major cord length of the departing macro bubbles agrees reasonably well with the Taylor wavelength.
Table 2 Comparison between Taylor wavelength and macro bubble
chord length in transition from nucleate to film boiling.
Fluid
Surface Tension
Taylor Wavelength
Macro Bubble
Chord Length
Chord Length Standard Deviation (50 data)
N/m mm mm mm
Pentane
0.013 9.4 10.4 1.8
0.010 8.7 8.9 1.6
0.009 8.1 8.8 1.5
Hexane
0.012 9.0 10.0 1.7
0.009 8.2 7.9 1.3
0.008 7.7 6.9 1.3
Methanol 0.019 10.3 10.2 1.9
0.017 9.9 10.0 1.4
FC-72
0.007 4.2 4.4 0.7
0.005 3.6 3.5 0.6
0.004 3.4 3.1 0.3
FC-87
0.008 4.6 4.9 0.8
0.006 4.1 4.1 0.8
0.005 3.7 3.4 0.5
R113
0.013 6.1 7.5 1.6
0.011 5.6 6.5 0.9
0.009 5.2 5.8 1.1
The pool boiling curves for R113 (Fig. 8) reveal some unusual behavior as CHF is approached. It is observed that small incremental increases in heat flux result in large increases in wall superheat, which is not characteristic of nucleate boiling. Such behavior is characteristic of the formation of local dry patches as would be found during transition boiling. The low pressure FC-72 (Fig. 6) boiling curves display similar behavior. Based on observations, the transition time takes seconds between nucleate boiling to film boiling for all the test fluids except R113. The transition time for R113 takes
minutes to complete once CHF is reached. The current lift-off CHF model should be able to predict the onset of dry patches, but it does not reflect a transition regime, as observed in Fig. 8. Therefore, when examining the CHF lift-off model for R113, the measured heat flux just prior to the transition regime (HFT) will be reported in addition to the CHF data.
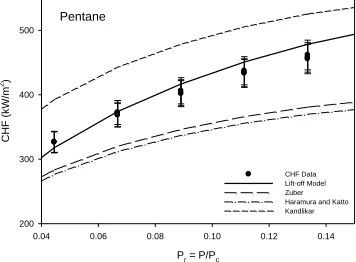
The experimentally measured CHF data summarized in Table 1 for pentane are compared with the predicted CHF models in Fig. 10. The models of Zuber and Haramura and Katto tend to under predict CHF, while Kandlikar’s model tends to over predict CHF when compared with experimental data. The lift-off model gives the best CHF prediction for reduced pressures ranging from 0.04 to 0.13 (150 to 450 kPa). It is also observed that the lift-off model is best at matching the CHF dependence on pressure.
Pentane
Pr = P/Pc
0.04 0.06 0.08 0.10 0.12 0.14
C
H
F
(kW
/m
2)
200 300 400 500
CHF Data Lift-off Model Zuber Haramura and Katto Kandlikar
Fig. 10Comparison of CHF models with pentane data.
Fig. 11 shows a comparison of the measured CHF for hexane with the four models over the reduced pressure range 0.04 to 0.15 (150 to 450 kPa). The lift-off model gives a reasonably good prediction. Zuber and Haramura and Katto models under predict the CHF while Kandlikar’s model over predicts the CHF.
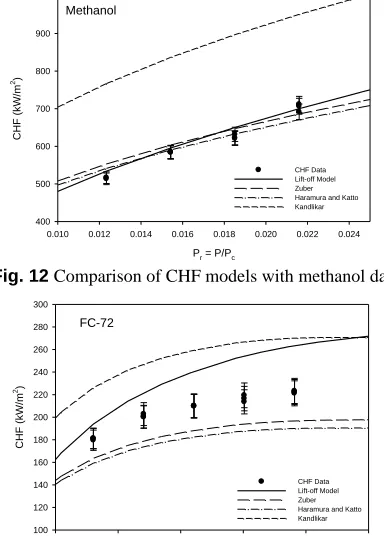
The variation of the measured methanol CHF with increasing pressure is shown in Fig. 12 over the reduced pressure range of 0.012 to 0.022 (100 to 175 kPa). The lift-off, Zuber, and Haramura and Katto models agree well with the measured CHF, while the Kandlikar model over predicts the CHF.
Hexane
Pr = P/Pc
0.04 0.06 0.08 0.10 0.12 0.14 0.16
C
H
F
(kW
/m
2)
200 250 300 350 400 450 500
CHF Data Lift-off Model Zuber Haramura and Katto Kandlikar
Fig. 11Comparison of CHF models with hexane data.
heat, there is at least a 6.5% uncertainty in predicting the CHF due to uncertainty in the latent heat.
Methanol
Pr = P/Pc
0.010 0.012 0.014 0.016 0.018 0.020 0.022 0.024
C
H
F (kW
/m
2)
400 500 600 700 800 900 1000
CHF Data Lift-off Model Zuber Haramura and Katto Kandlikar
Fig. 12Comparison of CHF models with methanol data.
FC-72
Pr = P/Pc
0.05 0.10 0.15 0.20 0.25 0.30
C
H
F
(kW
/m
2)
100 120 140 160 180 200 220 240 260 280 300
CHF Data Lift-off Model Zuber Haramura and Katto Kandlikar
Fig. 13Comparison of CHF models with FC-72 data.
Fig. 14 shows a comparison of the measured FC-87 CHF data with the four models over reduced pressure range 0.05 to 0.25 (150 kPa to 450 kPa). The Zuber and Haramura and Katto models under predict the CHF, and the Kandlikar model over predicts CHF. The experimental CHF data agree well with the lift-off model. The reported latent heat of FC-87 has a similar problem to that of FC-72. The percent difference in reported latent heat between the product information sheet and saturated tables is 3.3%.
FC-87
Pr = P/Pc
0.05 0.10 0.15 0.20 0.25 0.30
C
H
F
(kW
/m
2)
100 150 200 250 300 350
CHF Data Lift-off Model Zuber Haramura and Katto Kandlikar
Fig. 14Comparison of CHF models with FC-87 data.
Fig. 15 shows both the measured CHF data and the measured heat flux just prior to the transition regime (HFT) for R113. As reflected in the R113 boiling curves, it appears that the local dryout can be stable with slight increases in heat flux. Hence, the transition between the nucleate boiling regime and the film boiling regime for R113 requires higher heat flux. All of the models under predict the CHF for R113. The Kandlikar model gives the best prediction of HFT.
R113
Pr = P/Pc
0.04 0.06 0.08 0.10 0.12 0.14
C
H
F
(kW
/m
2)
150 200 250 300 350 400 450
HFT CHF Lift-off Model Zuber Haramura and Katto Kanlikar
Fig. 15Comparison of CHF models with R113 data.
4.
CONCLUSIONS
The lift-off model predicts CHF well with pentane, hexane, methanol, and FC-87. The FC-72 and R113 CHF predictions show more deviation from the data. A significant uncertainty for predicting CHF for FC-72 is the 6.5 difference in the reported latent heat from different sources. The boiling curves for R113 show there is a transition regime with local dryout before CHF occurs, and this is not accounted for in the lift-off model.
The measured change in CHF with increasing reduced pressure with FC-72, FC-87, and R113 is lower than that for pentane, hexane, and methanol. It is believed that local dryout prior to CHF is more pervasive with FC-72, FC-87, and R113 compared with pentane, hexane, and methanol. It is not clear why this is, although, it is observed that the fluids experiencing local dry out tend to have smaller departing bubbles and higher nucleation site density in the isolated bubble regime than those that do not experience local dryout. The average bubble departure diameters for the isolated bubble regime are computed using a force balance model proposed by Zeng et al. (1993),
) 2 ( 2
2
) 1 ( 2
3 4 3 2
n n
s n
n n n C g K d
(6)
where d is the departure bubble diameter, Cs is the empirical constant equal to 20/3, K and n are the respective leading coefficient and the exponent constant for the power law fit of the vapor bubble growth,
n
Kt t
a() (7)
where a(t) describes the vapor bubble growth. The vapor bubble growth is computed using a simplified model described by Chen et al. (1995). The computation results estimate that the bubble departure diameters for FC-72, FC-87, and R113 at 150 kPa are 0.67 mm, 0.65 mm, and 0.86 mm, respectively, and for pentane, hexane, and methanol at 150 kPa re 1.9 mm, 1.7 mm, and 3.7 mm, respectively with an applied heat flux, q”=100 kW/m2
. The bubble departure diameters for pentane, hexane, and methanol are at least twice larger than those for FC-72, FC-87, and R113.
ACKNOWLEDGEMENTS
This paper was prepared with the support of the National Science Foundation under award number CBET-0957437.
NOMENCLATURE
a(t) bubble growth rate
Av cross-sectional area of vapor stems (m2)
Aw area of heater surface (m
2 )
Cs empirical constant equal to 20/3
g gravity (m/s)
hfg latent heat (J/kg)
q'' heat flux (W/m2)
t time (s)
Greek Symbols
β liquid/solid contact angle (rad.)
θ surface inclination angle (rad.)
ρ density (kg/m3)
σ surface tension (N/m)
Subscripts
CHF critical heat flux
l liquid
v vapor
REFERENCES
Galloway, J.E. and Mudawar, I. 1993, "CHF mechanism in flow boiling from a short heated wall--II. Theoretical CHF model",
International Journal of Heat and Mass Transfer. 36(10), 2527-2540 http://dx.doi.org/10.1016/S0017-9310(05)80191-7
Guan, C.-K., Klausner, J.F. and Mei, R. 2011, "A new mechanistic model for pool boiling CHF on horizontal surfaces", International Journal of Heat and Mass Transfer. 54(17-18), 3960-3969.
http://dx.doi.org/10.1016/j.ijheatmasstransfer.2011.04.029
Haramura, Y. and Katto, Y. 1983, "New hydrodynamic model of critical heat flux, applicable widely to both pool and forced
convection boiling on submerged bodies in saturated liquids",
International Journal of Heat and Mass Transfer. 26(3), 389-399. http://dx.doi.org/10.1016/0017-9310(83)90043-1
Kandlikar, S.G. 2001, "A theoretical model to predict pool boiling CHF incorporating effects of contact angle and orientation", Journal of Heat Transfer. 123(6), 1071-1079.
http://dx.doi.org/10.1115/1.1409265
Mudawar, I., Howard, A.H. and Gersey, C.O. 1997, "An analytical model for near-saturated pool boiling critical heat flux on vertical surfaces", International Journal of Heat and Mass Transfer. 40(10), 2327-2339.
http://dx.doi.org/10.1016/S0017-9310(96)00298-0
Rajvanshi, A.K., Saini, J.S. and Prakash, R. 1992, "Investigation of macrolayer thickness in nucleate pool boiling at high heat flux",
International Journal of Heat and Mass Transfer. 35(2), 343-350. http://dx.doi.org/10.1016/0017-9310(92)90272-T
Sturgis, J.C. and Mudawar, I. 1999, "Critical heat flux in a long, rectangular channel subjected to one-sided heating--I. flow visualization", International Journal of Heat and Mass Transfer.
42(10), 1835-1847.
http://dx.doi.org/10.1016/S0017-9310(98)00274-9
Wang, C.H. and Dhir, V.K. 1993, "Effect of surface wettability on active nucleation site density during pool boiling of water on a vertical surface", ASME J. Heat Tranfer. 115 659-669.
http://dx.doi.org/10.1115/1.2910737
Zeng, L.Z., Klausner, J.F. and Mei, R. 1993, "A Unified model for the prediction of bubble detachment diameters in boiling systems - I. Pool boiling", International Journal of Heat and Mass Transfer.
36(9), 2261-2270.
http://dx.doi.org/10.1016/S0017-9310(05)80111-5
Zuber, N. 1959, Hydrodynamic aspects of boiling heat transfer, University of California, Los Angeles, California.