ISSN 2319-8133 (Online
(An International Research Journal), www.physics-journal.org
Flood Hazard Vulnerability Mapping Using Remote
Sensing and GIS: A Case Study of Surat
Dhruvesh. K. Mathur1, Praful. M. Udani2 and Aditya M Vora3
1Research Scholar,
Faculty of Sciences (Physics) CU Shah University, Wadhwan, INDIA.
email:[email protected]
2
(Ex Scientist ISRO) Director, ISTAR-CVM, Vallabh Vidyanagar, INDIA.
3
Faculty of Sciences (Physics), B.V. Shah Science College, CU Shah University, Wadhwan, INDIA.
(Received on: July 17, 2016)
ABSTRACT
Surat city is discussed using help of remote sensing & GIS.Also discuss major steps to taken for prevention of flood and its after effects.
Keywords: Remote Sensing, GIS Analysis, Types of Flood, Surat, Risk Zone, Vulnerability.
1. INTRODUCTION
India is one of the most flood prone countries in the world. The principal reasons for flood are prevailing natural ecological systems in the country and these are heavy rainfall with temporal and spatial variation, highly silted river systems and inadequate capacity to carry the high flood discharge, inadequate drainage to carry away the rainwater quickly to streams / rivers. Many times typhoons and cyclones also cause floods. Flash floods are caused by steep and highly erodible mountains, particularly in Himalayan ranges. The average rainfall in India is 1150 mm with significant variation across the Country. The annual rainfall along the western coast and Western Ghats, Khasi hills and over most of the Brahmaputra valley amounts to more than 2500 mm. Most of the floods occur during the monsoon period and are usually associated with tropical storms, depressions and active monsoon conditions. Due to the mentioned conditions floods occur in almost all river basins in India1.
Vulnerability to floods and other natural disasters is caused by the high population density, widespread poverty, illiteracy, enormous pressure on rural land, and agriculture dominated economy. Children, women, old age and disabled are particularly more vulnerable. Eighty five percent of the deaths during disasters are of women and children (Centre for Research on the Epidemiology of Disasters, CRED 2000). Presently protection in the country against floods is inadequate. Though non-structural measures improve the preparedness to floods and reduce losses, the necessity of structural measures would always remain for minimizing the extent of physical damage caused by floods. In future programmes and development planning of the country, it is required to integrate flood control and management planning along with climate change2.
1.1 Types of Floods.
Flash floods- They are characterized as a rapid and significant rise in water level due to a sudden and intense heavy rainfall event. These floods occur when rainfall rates are so high that the ground cannot absorb the water quickly enough to prevent significant runoff and are especially common in areas with steep slopes. Flash floods can also occur due to a dam failure. These floods can occur in less than an hour and can destroy structures, down trees and wash out roads with little to no warning time. Although flash floods may not last as long or cover as large of an area as other floods, the sudden onset and strength of the water give them the ability to create devastation in a very short period of time3.
reaches levels that overflow the banks. When this occurs, the flood can cover an enormous area and affect downstream areas even if they didn’t receive much rain themselves. Although river flooding can be predicted, its effects, even over a longer period of time, can cause extensive damage to residents living near rivers and streams4.
Coastal flooding- These floods occur when ocean water is pushed inland. Hurricanes and tropical storms can cause large waves and actually raise the sea level, creating storm surge along beaches. Earthquakes can displace large amounts of water and produces tsunami waves which rush to inland and resulted in flooding. On a much smaller scale, extremely high tides associated with a full moon can also cause minor coastal flooding.
Urban floods-These can be caused by flash, river or coastal flooding but most commonly, it is caused by high rainfall rates over developed areas that do not have the ability to absorb the water. Urbanization can increase water runoff as much as 2 to 6 times over what would occur on natural terrain. These floods can cause high economic damages to businesses and homes.
Areal flooding –These results in standing water in low-lying areas and open fields. They often occur due to heavy rainfall over a larger area in a brief period of time. Additionally, a prolonged period of rainfall can also lead to flooding, often causing dangerous inundation of low lying areas. Agricultural losses can occur with these floods and in addition, stagnant water can serve as a breeding ground for insects and disease.
2. STUDY AREA
Surat city is located in the delta region of the Tapi River and has a history of frequent flooding. The Tapi Basin shown in figure 1 is divided in three sub basins, namely the upper Tapi Basin (up to Hathnur), the middle Tapi Basin (from Hathnur to Gighade) and the lower Tapi Basin (from Gighade to the sea). The Surat city lies in the lower Tapi basin region after crossing Surat city Tapi river meets to sea. Over 90%of the total rainfall arrives during the summer monsoon (i.e. June–October) season in the basin. The basin falls within the zone of severe rainstorms. In this area maximum rainfall of 86 to 459mm in 24 hours is reported. The Tapi River is the second largest west-flowing river of India. It originates from Multai in Betul district in Madhya Pradesh at an elevation of 752 m, having a length of 724 km, and falls into the Arabian Sea. Majority of the higher order tributaries, such as Panzara, Purna and Girna join the Tapi River from the south. The total drainage area of the Tapi River is 65145 km2, out
of which 9804 km2, 51504 km2 and3837 km2 lie in the Madhya Pradesh, Maharashtra and
Gujarat states of India respectively. The basin is elongated in shape, with a maximum length (i.e. 687 km) from east to west and maximum width (210 km) from north to south5.
3. RESEARCH METHODOLOGY
GIS database creation mainly involves data collection, mapping, digitization, GIS error handling, attaching attributes data and making GIS data usable. The major tasks involved in database creation are:
1. Collection of satellite data, maps and tables
2. Analysis of satellite data for generating thematic maps using GPS field observations for generating ground control point’s library, Creation of spatial registration framework. 3. Geo-referencing of satellite image data and scanned map data. Environment setting and
point, line and polygon database creation using onscreen visual digitization. 4. Analysis based on GIS maps.
4. RESULTS And DISCUSSIONS
Figure 2 shows satellite picture of Surat city captured from Google earth It is clearly shown that river is passing directly from central part of surat City .area on both sides of banks of river is Highly populated area .majority of risk during monsoon season is for highly populated and lower elevation areas.In figure 3 Surat city is devided in various zones.
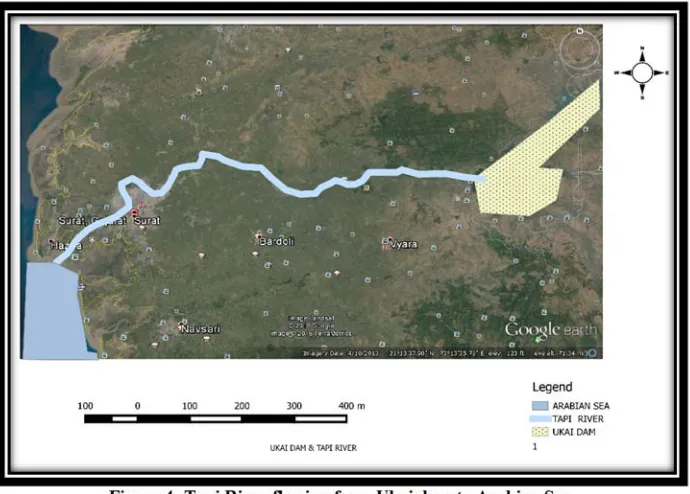
In figure 4 satellite picture captured using google earth and digitize in QGIS it is clearly shown from figure path of travel of Tapi river from Ukai dam passing through Surat city and meets at Arabian sea near Surat .
Figure 2 Satellite picture of Surat city.
Figure 4 -Tapi River flowing from Ukai dam to Arabian Sea.
Following steps are suggested to minimize effects of flood.
1. Construction of Embankments & Retaining walls-Restoration and strengthening of existing flood protection earthen embankment on the bank of river Tapi has been constructed for prevention from flood.
2. Flood inundation map-Using Remote sensing & GIS flood Inundation maps for different water levels are prepared it helps in disaster managers during flood.
3. Early warning system-The early warning flood system is installed in the catchment area of Tapi basin and Surat city This system help in efficient way to monitor flow throughout the basin. This help in monitoring high inflow events. Early warning system installed – telemetry system- at 23 points in Tapi catchment area is considered the main reason for there being no floods after 2006 in Surat.
4. Disaster management plan-The disaster management plans can be prepared in advance and use modern technology for relief operations. The flood cell becomes active during monsoon season. The releases from Ukai dam, Ukai Reservoir level and inflow to the reservoir is not only monitored but inform people in vulnerable areas for flooding.as part of disaster management poor people residing near banks of Tapi river is moved at some higher elevation areas due to this loss of humans and property can be minimized. Apart from public awareness programme, health measures, proper medical facility for affected areas, spreading of pesticides, fogging and several other measures are adopted after Flooding. Also inform people about various shelters, Hospitals used during flood time for protection of peoples.so disaster management cell operated by collector office having major role during flooding6.
5. CONCLUSION
Remote sensing and GIS inputs are useful for relief and rescue operations as well as for impact assessment to infrastructure and properties. Remote sensing and GIS inputs are used operationally for early warning and decision support by authorities during disaster. City like Surat which frequently affected by flooding in monsoon need better disaster management. For better disaster preparedness planning and post disaster impact assessment, it is required to use RS data with required spatial and temporal resolution for information extraction. GIS framework provides facility for data integrating, query, analysis and decision support. This paper has provided insight about the possible applications of remote sensing and GIS in flood management.
REFERENCES
1. P. M. U. a. D. K.Mathur, "GIS data base design, development and flood analysis:," Pelagia Research Library, Vol. 7, no. 4, pp. 71-78, (2016).
2. NDRMS, "National Disaster Management guidelines for Management of floods," Govt. of India. , New Delhi, (2014).
4. GSDMA, "Gujarat state disaster Management plan vol.1, 2," GSDMA, Gandhinagar, (2014).
5. S. M. Yadav, "Lessons from Surat Floods: Planning Structural and Non Structural Flood," E-proceedings of the 36th IAHR World Congress 28 June – 3 July, 2015, The Hague, the Netherlands, pp. 1-5, (2015).
6. D. M. U. Dhruvesh Mathur, "Application of GIS and Remote Sensing Technologies in Disaster Management," in ICGS 2015 conference at GTU-Chandkheda., Ahmedabad, (2015).