DigitalCommons@University of Nebraska - Lincoln
DigitalCommons@University of Nebraska - Lincoln
Computer Science and Engineering: Theses,
Dissertations, and Student Research Computer Science and Engineering, Department of
Spring 4-20-2020
Advanced Techniques to Detect Complex Android Malware
Advanced Techniques to Detect Complex Android Malware
Zhiqiang LiUniversity of Nebraska - Lincoln, [email protected]
Follow this and additional works at: https://digitalcommons.unl.edu/computerscidiss
Part of the Computer Engineering Commons, and the Computer Sciences Commons
Li, Zhiqiang, "Advanced Techniques to Detect Complex Android Malware" (2020). Computer Science and Engineering: Theses, Dissertations, and Student Research. 188.
https://digitalcommons.unl.edu/computerscidiss/188
This Article is brought to you for free and open access by the Computer Science and Engineering, Department of at DigitalCommons@University of Nebraska - Lincoln. It has been accepted for inclusion in Computer Science and Engineering: Theses, Dissertations, and Student Research by an authorized administrator of
by
Zhiqiang Li
A DISSERTATION
Presented to the Faculty of
The Graduate College at the University of Nebraska In Partial Fulfilment of Requirements
For the Degree of Doctor of Philosophy
Major: Computer Science
Under the Supervision of Professors Qiben Yan and Witawas Srisa-an
Lincoln, Nebraska May, 2020
Zhiqiang Li, Ph.D. University of Nebraska, 2020
Adviser: Qiben Yan and Witawas Srisa-an
Android is currently the most popular operating system for mobile devices in the world. However, its openness is the main reason for the majority of malware to be targeting Android devices. Various approaches have been developed to detect malware.
Unfortunately, new breeds of malware utilize sophisticated techniques to defeat malware detectors. For example, to defeat signature-based detectors, malware authors change the malware’s signatures to avoid detection. As such, a more effective approach to detect malware is by leveraging malware’s behavioral characteristics. However, if a behavior-based detector is based on static analysis, its reported results may contain a large number of false positives. In real-world usage, completing static analysis within a short time budget can also be challenging.
Because of the time constraint, analysts adopt approaches based on dynamic analyses to detect malware. However, dynamic analysis is inherently unsound as it only reports analysis results of the executed paths. Besides, recently discovered malware also employs structure-changing obfuscation techniques to evade detection by state-of-the-art systems. Obfuscation allows malware authors to redistribute known malware samples by changing their structures. These factors motivate a need for malware detection systems that are efficient, effective, and resilient when faced with such evasive tactics.
In this dissertation, we describe the developments of three malware detection
by mobile malware. GranDroid is a graph-based malware detection system that combines dynamic analysis, incremental and partial static analysis, and machine learning to provide time-sensitive malicious network behavior detection with high
accuracy. Obfusifier is a highly effective machine-learning-based malware detection
system that can sustain its effectiveness even when malware authors obfuscate these malicious apps using complex and composite techniques.
Our empirical evaluations reveal that DroidClassifier can successfully identify
different families of malware with 94.33% accuracy on average. We have also shown
GranDroid is quite effective in detecting network-related malware. It achieves
93.0% accuracy, which outperforms other related systems. Lastly, we demonstrate
that Obfusifiercan achieve 95% precision, recall, and F-measure, collaborating its
ACKNOWLEDGMENTS
The completion of this dissertation would not be possible without the financial support from my advisors: Professors Witawas Srisa-an and Qiben Yan. I want to thank them both for the efforts they put forth throughout my Ph.D. study.
Dr. Srisa-an has been mentoring me since the beginning of my Ph.D. career. He guides me well throughout my research work. His motivation and patience have given me massive power to make progress in my research. He is my mentor and a better advisor for my Ph.D. study beyond any imagination. I thank him for encouraging me and sharing insightful suggestions. He has given me the freedom to pursue various projects without any objection. He plays a significant role in polishing my research writing skills. I will never forget his guidance and kindness.
Dr. Yan has a significant influence on me, and it has been an honor to be his student. I learned a lot from him in the field of cybersecurity. I appreciate his generous contributions of time and ideas to make my Ph.D. experience productive. He is very enthusiastic and energetic. He has provided insightful information about my research, which is very inspirational for me.
Apart from my advisors, I would like to express the gratitude to my supervisory committee: Prof. Lisong Xu, Prof. Song Ci, and lastly, Prof. David Swanson for the encouragement, valuable comments, and many insightful suggestions.
I also thank Jun Sun and Lichao Sun, who have been collaborating with me during my study. I will remember the inspirational discussions we had, and the moments of ecstasy after we caught the deadline. I would never forget my fellow labmates for the fun time we spent together. They are Supat Rattanasuksun, Zhen Hu, Shakthi Bachala, Yutaka Tsutano, and Jackson Dinh. Every time I talk to Supat, I always feel relaxed, and he gives me a lot of valuable advice in life. I always enjoy the Thai
massage he gave me. Zhen is the only girl in our lab and we are from the same country. To me, she is similar to some of my friends in college in China. Getting along with her reminds me of my precious time in college. Shakthi has a cheerful personality and is a person who can bring joy to others. I feel relaxed with him. Yutaka is an excellent and proud man, and he pursues things to the extreme. I can always learn from him. Jackson is quick-minded and can solve problems quickly. He is a good helper for me. I want to say thank you to Thammasak Thianniwet for helping me to improve my writing skills and all of my friends from the University of Nebraska for talking and hanging out with me. Their immense support and critiques help me rectify numerous issues and strengthen my papers.
Most importantly, I want to say thank you to the most influential people in my life: my parents and my sister. They gave me endless support, encouragement, and motivation to achieve my goals.
Table of Contents
List of Figures ix
List of Tables x
1 Introduction 1
1.1 Contributions . . . 4
2 DroidClassifier: Efficient Adaptive Mining of Application-Layer Header for Classifying Android Malware 6 2.1 Motivation . . . 7
2.2 System Design . . . 10
2.2.1 Model Training . . . 11
2.2.2 Malware Clustering during Testing . . . 16
2.2.3 Malware Classification . . . 19
2.2.4 Malware Detection . . . 19
2.3 Evaluation . . . 20
2.3.1 Malware Classification Effectiveness Across Different Cluster Numbers . . . 21
2.3.2 Detection Effectiveness Per Family . . . 22
2.3.3 Comparing Detection Effectiveness of Clustering versus Non-Clustering . . . 24
2.3.4 Comparing Performance with Other Mobile Malware Detectors 25
2.4 Discussion . . . 28
2.5 Related Work . . . 30
2.6 Conclusion . . . 31
3 GranDroid: Graph-based Detection of Malicious Network Behav-iors in Android Applications 32 3.1 Motivation . . . 33 3.2 System Design . . . 36 3.2.1 Graph Generation . . . 36 3.2.2 Feature Extraction . . . 41 3.2.3 Detection . . . 43 3.3 Evaluation . . . 44 3.3.1 Data Collection . . . 45 3.3.2 Detection Result . . . 46
3.3.3 Evaluating Aggregated Features . . . 49
3.3.4 Comparison with Related Approaches . . . 50
3.3.5 Average Malware Detection Time . . . 53
3.4 Discussion . . . 54
3.5 Related Work . . . 55
3.6 Conclusion . . . 58
4 Obfusifier: Obfuscation-resistant Android Malware Detection Sys-tem 59 4.1 Background on Code Obfuscation . . . 62
4.2 Effects of Obfuscation on Malware Detection . . . 63
4.3.1 Graph Generation . . . 67
4.3.2 Graph Simplification . . . 69
4.3.3 Sensitive API Path (SAP) Generation . . . 70
4.3.4 Feature Extraction . . . 71 4.3.5 Detection . . . 72 4.4 Empirical Evaluation . . . 73 4.4.1 Experimental Objects . . . 74 4.4.2 Experimental Methodology . . . 74 4.4.3 Detection Result . . . 75
4.4.4 Comparison with Related Approaches . . . 79
4.4.5 Runtime Performance . . . 82
4.5 Discussion . . . 83
4.6 Related Work . . . 84
4.7 Conclusion . . . 86
5 Conclusions and Future Work 87
List of Figures
2.1 Steps taken by DroidClassifier to perform training . . . 11
3.1 Android.Feiwo Adware Example . . . 34
3.2 System Architecture . . . 36
3.3 Method Graph . . . 38
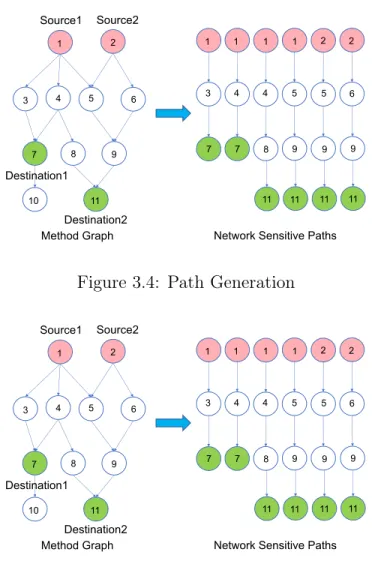
3.4 Path Generation . . . 39
3.5 Subpath Generation . . . 39
3.6 Subpath Frequency Feature . . . 42
3.7 Performance of Random Forest . . . 48
4.1 The Difference in Detection Rate of Original and Obfuscated Malware . . 64
4.2 Obfuscation Process . . . 66
4.3 System Architecture . . . 67
4.4 Method Graph . . . 68
4.5 Graph Simplification Process . . . 69
List of Tables
2.1 Features Extracted . . . 13
2.2 Classification Result with Different Number of Clusters ( TPR=TP/(TP+FN);
TNR=TN/(TN+FP) ) . . . 22
2.3 Malware Classification Performance with 1000 Clusters ( F_Measure =
2TP / (2TP + FP + FN) ) . . . 23
2.4 Classification Performance without Clustering Procedure . . . 24
2.5 Detection Rates of DroidClassfier and Ten Anti-Virus Scanners . . . 26
2.6 Time Comparison of Matrix Calculation (Experiments run on Apple
Mac-Book Pro with 2.8GHz Intel Core i7 and 16G memory) . . . 27
3.1 The performance of GranDroidusing five different features (F1 – F4, F3
& F4) and three different Machine Learning algorithms: Support Vector
Machine (SVM), Decision Tree (DT) and Random Forest (RF). . . 47
3.2 Utilized HTTP Statistic Features (Approach-1) . . . 51
3.3 The performance comparison of two different approaches (Approach 1 and
Approach 2) and three different Machine Learning algorithms: Support
Vector Machine (SVM), Decision Tree (DT) and Random Forest (RF). . 52
3.4 Detection Result Comparison . . . 52
4.2 The performance of Obfusifieron non-obfuscated apps using five different features (F1 – F4, F1UF2UF3UF4) and three different Machine Learning algorithms: Support Vector Machine (SVM), Decision Tree (DT) and
Random Forest (RF). . . 78
4.3 The performance of Obfusifier with obfuscated apps as testing set . . 78
4.4 Comparison Without Obfuscation (Pr = Precision, Re = Recall, and Fm
= F-measure) . . . 82
4.5 Comparison With Other Methods (Pr = Precision, Re = Recall, and Fm
Chapter 1
Introduction
Android is currently the most popular smart-mobile device operating system in the world, holding about 80% of worldwide market share. Due to their popularity and platform openness, Android devices, unfortunately, have also been subjected to a marked increase in the number of malware and vulnerability exploits targeting them. According to a recent study from F-Secure Labs, there are at least 275 new families (or new variants of known families) of malware that currently target Android [1]. On
the contrary, only one new threat family on iOS was reported.
Among these malware families, one type of attack involves sending sensitive and private user’s information to external sites. Because these malicious actions generate trails of network traffic, it is possible to detect apps that perform such malicious actions by observing network activities. In the past, security analysts have used network connectivity analysis to identify mobile applications to facilitate network management tasks [2]. Because cybercriminals have also exploited Android’s network connectivity to glean sensitive information or launch devastating network-level attacks [3,4,5], studying network traffic going into or coming out of Android devices can yield unique insights about the attack origination and patterns. Therefore, researchers have statically or dynamically analyzed network information to detect malicious Android apps.
manner and thus incur no runtime overhead. However, static analysis can result in excessive false positives. Moreover, they are often ineffective when various forms of obfuscation and encryption techniques are applied to the program codes. Dynamic analysis approaches, on the other hand, are more precise but incur additional runtime overhead [12, 13, 14]. as they need to incorporate the apps’ actual runtime behaviors that may be triggered by dynamically downloaded codes from remote servers. However, the analysis results are unsound. Furthermore, recent reports indicate that dynamic analysis can be easily defeated if an app under analysis can discover that it is being observed (e.g., running in an emulator), and as a result, it behaves as a benign app [15, 16, 17].
Due to the limitations above, it is not a surprise that recently introduced malware detection approaches perform hybrid analysis, leveraging both static and dynamic in-formation. In general, hybrid analysis approaches statically analyze various application components of an app, execute the app, and then record runtime information [18,19,20]. These approaches then use both static and dynamic information to detect malicious apps, which can lead to more in-depth and precise results. However, most of the existing Android malware analysis approaches detect Android malware by matching manually selected characteristics (e.g., permissions) [6, 11, 21, 22] or predefined
pro-gramming patterns [8, 10]. The existing approaches do not capture the programming
logic that leads to malicious network behaviors.
Our key observation about a typical hybrid analysis approach is that: a significant amount of efforts are spent on constructing various static analysis contexts (e.g., API calls, control-flow graphs, and data-flow graphs). Yet, the malicious network
behaviors are only induced by specific programming logic, i.e., the network-related
paths or events (e.g., distilling and sending information to a suspicious C&C server) that have been dynamically executed. This can lead to wasteful static analysis efforts.
Furthermore, running an instrumented app or modified runtime systems (e.g., Dalvik or ART) to log events can incur significant runtime overhead (e.g., memory to store runtime information, and network or USB bandwidth to transport logged information for processing). In the end, it is still challenging for hybrid analysis to be able to complete its analysis within a given time budget (e.g., five minutes) as statically analyzing an app can yield varying time depending on the size and complexity of the
app under analysis. Adhering to a time budget is an important criterion for real-world
malware analysis and vetting systems.
Code obfuscation, a common approach used by developers to protect the intellectual properties of their software [23] by making reverse-engineering more difficult, has also been used by malware authors as an anti-analysis tool to hide malicious code within an application. As such, it is not surprising that we have seen applications of various obfuscation techniques to malicious apps to evade the security analysis. These techniques are especially effective in defeating existing malware and virus scanners, which often rely on signature matching or program analysis. In this work, we applied various obfuscation techniques to known malware samples and evaluated them by VirusTotal [24]. The analysis results indicate that many existing techniques deployed by VirusTotal would misclassify known but obfuscated malware samples as benign.
Applying code obfuscation to malware can also defeat state-of-the-art machine learning-based malware detection systems [9, 11, 13, 25, 26, 27]. These existing systems extract unobfuscated features from benign and malware Android samples to build classifiers to detect malware. One recent work [28] has shown that when obfuscated Android malware samples are submitted to these classifiers, they can be miscategorized as features used by these classifiers are now more ambiguous due to obfuscation [29].
Developing an obfuscation-resilient systems would prevent malware authors from simply obfuscating known malware for redistribution.
1.1
Contributions
The contributions of this dissertation are as follows:
1. We implement DroidClassifier, which considers multiple dimensions of mobile
traffic information from different families of mobile malware to establish distin-guishable malicious patterns. Besides, we design a novel weighted score-based metric for malware classification, and we further optimize the performance of our classifier using a novel combination of supervised learning (score-based clas-sification) and unsupervised learning (malware clustering). The clustering step makes our detection phase more efficient than prior efforts, since the subsequent malware classification can be performed over clustered malware requests instead of individual requests from malware samples.
2. We develop GranDroid based on system-level dynamic graphs to detect
ma-licious network behaviors. GranDroid utilizes detailed network-related
pro-gramming logic to automatically and precisely capture the malicious network
behaviors. GranDroid enables partial static analysis to expand the analysis
scope at runtime, and uncover malicious programming logic related to dynami-cally executed network paths. Doing so can make our analysis approach more sound than a traditional dynamic analysis approach. We perform an in-depth
evaluation of GranDroid in terms of the runtime performance and the efficacy
of malicious network behavior detection. We show thatGranDroidcan run on
real devices efficiently, achieving a high accuracy in detecting malicious network behaviors.
3. We implement Obfusifier, a machine-learning-based malware detector that is
and robust results when obfuscated samples are submitted for detection.
Ob-fusifier generates method call graphs using static analysis. It then simplifies
method call graph by removing the user-defined methods, system-level methods and only keeping Android API methods. This simplification process enables us to reconstruct a graph that is obfuscation-resistant while preserving the structural and semantic information concerning Android API usage of the original graph.
Obfusifier then extracts machine learning features from simplified graphs and
these features can resist against code obfuscation because of graph simplification.
We evaluate the detection efficacy and runtime performance Obfusifier using
both unobfuscated and obfuscated samples. The results show thatObfusifier
can handle obfuscated Android malware with high efficiency and accuracy.
Next, we describe these approaches in turn. Note that we embed prior related work inside each approach so that we can compare and contrast their capabilities to those of our systems after our systems have been introduced.
Chapter 2
DroidClassifier: Efficient Adaptive Mining of
Application-Layer Header for Classifying Android Malware
Portions of this material have previously appeared in the following publication:
Z. Li, L. Sun, Q. Yan, W. Srisa-an, and Z. Chen, “Droidclassifier: Efficient adaptive mining of application-layer header for classifying android malware,” in Inter-national Conference on Security and Privacy in Communication Systems. Springer, 2016, pp. 597–616.
In this chapter, we present DroidClassifier, a systematic framework for classifying
and detecting malicious network traffic produced by Android malicious apps. Our work attempts to aggregate additional application traffic header information (e.g., method, user agent, referrer, cookies, and protocol) to derive a more meaningful
and accurate malware analysis results. As such, DroidClassifier has been designed
and constructed to consider multiple dimensions of malicious traffic information to establish malicious network patterns. First, it uses the traffic information to create clusters of applications. It then analyzes these application clusters (i) to identify
whether the apps in each cluster are malicious or benign and (ii) to classify which family the malicious apps belong to.
DroidClassifier is designed to be efficient and lightweight, and it can be integrated
into network IDS/IPS to perform mobile malware classification and detection in a
vast network. We evaluate DroidClassifier using more than six thousand Android
benign apps and malware samples, each with the corresponding collected network traffic. In total, these malicious and benign apps generate 17,949 traffic flows. We
then use DroidClassifier to identify the malicious portions of the network traffic and
to extract the multi-field contents of the HTTP headers generated by the mobile malware to build extensive and concrete identifiers for classifying different types
of mobile malware. Our results show that DroidClassifier can accurately classify
malicious traffic and distinguish malicious traffic from benign traffic using HTTP header information. Experiments indicate that our framework can achieve more than 90% classification rate and detection accuracy. At the same time, it is also more efficient than a state-of-the-art malware classification and detection approach [30].
The rest of this chapter is organized as follows. Section 2.1 explains why we consider multidimensional network information to build our framework. Section 2.2 discusses
the approach used in the design of DroidClassifier, and the tuning of important
parameters in the system. DroidClassifier is evaluated in Section 2.3. Section 2.4
discusses limitations and future work. Section 2.5 describes the related work, followed by the conclusion in Section 2.6.
2.1
Motivation
A recent report indicates that close to 5,000 Android malicious apps are created each day [31]. The majority of these apps also use various forms of obfuscation to avoid
detection by security analysts. However, a recent report by Symantec indicates that Android malware authors tend to improve upon existing malware instead of creating new ones. In fact, the study finds that more than three quarters of all Android malware reported during the first three months of 2014 can be categorized into just 10 families [32]. As such, while malware samples belonging to a family appear to be different in terms of source code and program structures due to obfuscation, they tend to exhibit similar runtime behaviors.
This observation motivates the adoption of network traffic analysis to detect malware [30, 33, 34, 35]. The initial approach is to match requested URIs or hostnames with known malicious URIs or hostnames. However, as malware authors increase malware complexities (e.g., making subtle changes to the behaviors or using multiple servers as destinations to send sensitive information), the results produced by hostname analysis tend to be inaccurate.
To overcome these subtle changes made by malware authors to avoid detection, Aresu et al. [30] apply clustering as part of network traffic analysis to determine malware families. Once these clusters have been identified, they extract features from these clusters and use the extracted information to detect malware [30]. Their experimental results indicate that their approach can yield 60% to 100% malware detection rate. The main benefit of this approach is that it handles these subtle changing malware behaviors as part of training by clustering the malware traffic. However, the detection is done by analyzing each request to identify network signatures and then matching signatures. This can be inefficient when dealing with a large traffic amount. In addition, as these changes attempted by malware authors occur frequently, the training process may also need to be performed frequently. As will be shown in Section 2.3, this training process, which includes clustering, can be very costly.
the classification and detection process to make it more efficient than the approach
introduced by Aresu et al. [30]. Our proposed approach, DroidClassifier, relies on two
important insights. First, most newly created malware belongs to previously known families. Second, clustering, as shown by Aresu et al., can effectively deal with subtle
changes made by malware authors to avoid detection. We construct DroidClassifier
to exploit previously known information about a malware sample and the family it belongs to. This information can be easily obtained from existing security reports as well as malware classifications provided by various malware research archives including Android Malware Genome Project [36]. Our approach uses this information to perform training by analyzing traffic generated by malware samples belonging to the same family to extract most relevant features.
To deal with variations within a malware family and to improve testing efficiency, we perform clustering of the testing traffic data and compare features of each resulting cluster to those of each family as part of classification and detection process. Note that the purpose of our clustering mechanism is different from the clustering mechanism used by Aresu et al. [30], in which they apply clustering to extract useful malware signatures. Our approach does not rely on the clustering mechanism to extract malware traffic features. Instead, we apply clustering in the detection phase to improve the detection efficiency by classifying and detecting malware at the cluster granularity instead of at each individual request granularity, resulting in much less classification and detection efforts. By relying on previously known and precise classification information, we only extract the most relevant features from each family. This allows us to use fewer features than the prior approach [30]. As will be shown in Section 2.3,
2.2
System Design
Our proposed system, DroidClassifier, is designed to achieve two objectives: (i) to
distinguish between benign and malicious traffic; and (ii) to automatically classify malware into families based on HTTP traffic information. To accomplish these
objectives, the system employs three major components: training module, clustering
module, and malware classification and detection module.
The training module has three major functions: feature extraction, malware database construction, and family threshold decision based on scores. After extracting features from a collection of HTTP network traffic of malicious apps inside the training
set, the module produces a database of network patterns per family and the zscore
threshold that can be used to evaluate the maliciousness of the network traffic from malware samples and classify them into corresponding malware families. To address subtle behavioral changes among malware samples and to improve detection efficiency, the clustering module is followed to collect a set of network traffic and gather similar HTTP traffic into the same group to classify network traffic as groups.
Finally, the malware classification and detection module computes the scores and
the corresponding zscore based on HTTP traffic information of a particular traffic
cluster. If this absolute value of zscore is less than the threshold of one family, and our
system classifies the HTTP traffic into the malware family. It then evaluates whether the HTTP traffic requests are from a particular malware family or from benign apps, the strategy of which is similar to that of the classification module. Our Training and Scoring mechanisms provide a quantitative measurement for malware classification and detection. Next, we describe the training, traffic clustering, malware classification, and malware detection process in detail.
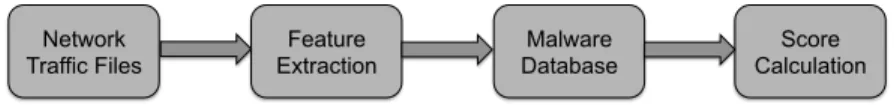
2.2.1 Model Training
The training process requires four steps, as shown in Figure 2.1. The first step is collecting network traffic information of applications that can be used for training, classification, and detection. Concerning training, the network traffic data set that we focus on is collected from malicious apps. The second step is extracting relevant features that can be used for training and testing. The third step is building a malware database. Lastly, we compute the scores that can be used for classification and detection. Next, we describe each of these steps in turn.
Network
Traffic Files Extraction Feature Database Malware Calculation Score
Figure 2.1: Steps taken by DroidClassifier to perform training
Collecting Network Traffic. To collect network traffic, we locate malware samples previously classified into families. We use the real-world malware samples provided by the Android Malware Genome Project [36] and Drebin [9] project, which classify 1,363 malware samples, making a total of 2,689 HTTP requests, into 10 families. We randomly choose 706 samples to build the training model and the remaining 657 samples as a malware evaluation set. We also use 5,215 benign apps, generating 15,260 HTTP requests, to evaluate the detection phase. These benign apps are from the Google Play store.
The first step of traffic collection is installing samples belonging to a family into an Android device or a device emulator (as used in this study). We use 50% of malware samples for training, i.e., 30% for database building and 20% for threshold calculation. We also use 20% of benign apps for threshold calculation.
To exercise these samples, we use Monkey to randomly generate event sequences
duration because a prior work by Chen et al. [35] shows that most malware would generate malicious traffic in the first 5 minutes.
In the third step, we use Wireshark ortcpdump, a network protocol analyzer, to
collect the network traffic information. In the last step, we generate network traffic traces as PCAP files. After we have collected the network traffic information from a family of malware, we repeat the process for the next family.
It is worth noting that our dataset contains several repackaged Android malware samples. Though most of the traffic patterns generated by repackaged malware apps and carrier apps are similar, we find that these repackaged malware samples do generate malicious traffic. Furthermore, our samples also generate some typical ad-library traffic, and the traffic can also add noise to our training phase. In our implementation, we establish a “white-list” request library containing requests sending to benign URLs and common ad-libraries. We filter out white-listed requests and use only the remaining potential malicious traffic to train the model and perform the detection.
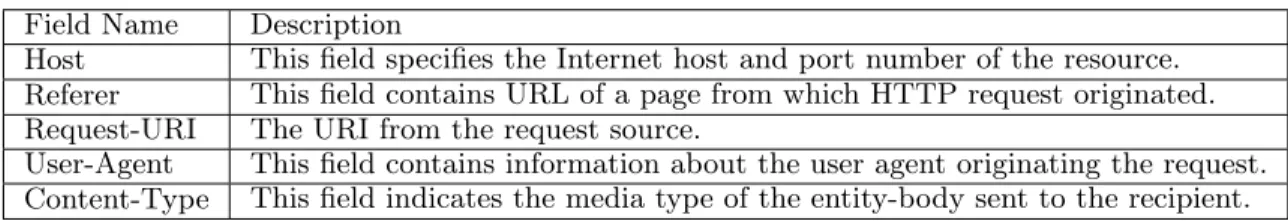
Extracting Features for Model Building. We limit our investigation to HTTP traffic because it is a commonly used protocol for network communication. There are four types of HTTP message headers: General Header, Request Header, Response Header, and Entity Header. Collectively, these four types of header result in 80 header fields [37]. However, we also observe that the generated traffic uses fewer than 12 fields. We manually analyze these header fields and choose five of them as our features. Note that we do not rank them. If more useful headers can be obtained from a different dataset, we may need to retrain the system.
Also, note that we utilize these features differently from the prior work [34]. In the training phase, we make use of multiple fields and come up with a new weighted score-based mechanism to classify HTTP traffic. Perdisci et al. [34], on the other
hand, use clustering to generate malware signatures. In our approach, clustering is used as an optimization to reduce the complexity of the detection/classification phase. As such, our approach is a combination of both supervised and unsupervised learning. By using different fields of HTTP traffic information, we, in effect, increase the dimension of our training and testing datasets. If one of these fields is inadequate in determining malware family, e.g., malware authors deliberately tamper one or more fields to avoid analysis, other fields can often be used to help determine malware family, leading to better clustering/classification results. Next, we discuss the rationale of selecting these features and the relative importance of them.
Table 2.1: Features Extracted
Field Name Description
Host This field specifies the Internet host and port number of the resource. Referer This field contains URL of a page from which HTTP request originated. Request-URI The URI from the request source.
User-Agent This field contains information about the user agent originating the request. Content-Type This field indicates the media type of the entity-body sent to the recipient.
• Host can be effective in detecting and classifying certain types of malware with
clear and relatively stabilized hostname fields in their HTTP traffic. Based on our observation, most of the malware families generate HTTP traffic with only a small number of disparate host fields.
• Referrer identifies the origination of a request. This information can introduce privacy concerns as IMEI, SDK version, and device model; device brand can be sent
through this field, as demonstrated by DroidKungFu and FakeInstaller families.
• Request-URI can also leak sensitive information. We observe that Gappusin
family can use this field to leak device information, such as IMEI, IMSI, and OS Version.
• User-Agent contains a text sequence containing information such as device manufacturer, version, plugins, and toolbars installed on the browser. We observe that
malware can use this field to send information to the Command & Control (C&C) server.
• Content-Type can be unique for some malware families. For example, Opfake
has a unique “multipart/form-data; boundary=AaB03x" Content-Type field, which can also be included to elevate the successful rate of malware detection.
Request-URI and Referrer are the two most important features because they contain rich contextual information. Host and User-Agent serve as additional discernible features to identify certain types of malware. Content-Type is the least important in terms of identifiable capability; however, we also observe that this feature is capable of recognizing some specific families of malware.
Although dedicated adversaries can dynamically tamper these fields to evade detection, such adaptive behaviors may incur additional operational costs, which we suspect is the reason why the level of adaptation is low, according to our experiments. We defer the investigation of malware’s adaptive behaviors to future work. In addition, employing multiple hosts can evade our detection at the cost of higher maintenance expenses. In our current dataset, we have seen that some families use multiple hosts to receive information, and we are still able to detect and classify them by using multiple network features.
We also notice that these malware samples utilize C&C servers to receive leaked information and control malicious actions. In our data set, many C&C servers are still fully or partially functional. For fully functional servers, we observe their responses. We notice that these responses are mainly simple acknowledgments (e.g., “200 OK”). For the partially functional servers, we can still observe information sent by malware samples to these servers.
Building Malware Database. Once we have identified relevant features, we extract values for each field in each request. As an example, to build a database for the
DroidKungFu malware family, we search all traffic trace files (PCAPs) of the all samples belonging to this family (100 samples in this case). We then extract all values or common longest substring patterns, in the case of Request-URI fields, of the five relevant features. Next, we put them into lists with no duplicated values and build a map between each key and its values.
Scoring of Malware Traffic Requests. In the training process, we assign scores to malware traffic requests to compute the classification/detection threshold, which
we termed as training zscore computation. We need to calculate the malware zscore
range for each malware family. We use traffic from 20% of malware samples belonging
to each family for training zscore computation. For each malware family, we assign a
weight to each HTTP field to quantify different contributions of each field according to the number of patterns the field entails since the number of patterns of a field indicates the uncertainty of extracted patterns.
For example, the field with a single pattern is deemed as a unique field; thus, it is considered to be a field with high contributions. In contrast, the field with several patterns would be weighted lower. As such, we compute the total number of patterns of each field from the malware databases to determine the weight. The following
formula illustrates the weight computation for each field: wi = t1
i ×100, where wi
stands for the weight for ith field, and ti is the number of patterns for the ith field
for each family in malware databases. For instance, there are 30 patterns for field User-Agent of one malware family in malware databases, so the weight of User-Agent
is 301 ×100.
In terms of the Request URI field, we use a different strategy because this filed usually contains a long string. We use the Levenshtein distance [38] to calculate the similarity between the testing URI and each pattern. Levenshtein distance measures the minimum number of substitutions required to change one string into the other.
After comparing with each pattern, we choose the greatest similarity as a target
value, for example, if the similarity value is 0.76, the weight will be 0.76 × 100
or 76 for the URI field. The score can be calculated using the following equation:
score = 1
N
PN
i=1wi ×mi, where wi is weight for ith field, and mi indicates whether
there is a pattern in the database that matches the field value. If there is, mi is 1;
otherwise, it is 0. Note that mi is always 1 for the URI field.
After obtaining all the field values and calculating the summation of these values, we then divide it by the total number of fields (i.e., 5 in this case). The result is the
original score of this HTTP request. Then we need to calculate the malware zscore
range for each family. we calculate the average score and standard derivation of those original scores which are mentioned above. Next, we calculate the absolute value of the zscore, which represents the distance between the original score (x) and the mean
score (x¯) divided by the standard deviation (s) for each request: |zscore|=
x−¯x
s
.
Once we get the range of absolute value of zscore from all malware training requests
of each family, it is used to determine the threshold for classification and detection. We will illustrate the threshold decision process in the following section. Algorithm 1 outlines the steps of calculating original scores from PCAP files. Note that in the
testing process, the same zscore computation is conducted to evaluate the scores of
the testing traffic requests, which we termed as testing zscore computation to avoid
confusion.
2.2.2 Malware Clustering during Testing
We automatically apply clustering analysis to all of our testing requests. We use hierarchical clustering [39], which can build either a top-down or bottom-up tree to determine malware clusters. The advantage of hierarchical clustering is that it is
Algorithm 1 Calculating Request Scores From One PCAP
1: dataBase[ ]←Database built from the previous phrase
2: pcapFile←Each PCAP file from 20% of malware families
3: fieldNames[ ]←Name list for all the extracted fields
4: tempScore←0
5: sumScore←0
6: avgScore←0
7: foreach httpRequest in pcapFile do
8: foreach name in fieldNamesdo
9: if httpRequest.name6=NULLthen
10: if name6=“requestURI” then
11: if httpRequest.name in dataBase(name)then
12: tempScore←100 {The default weight is 100}
13: else 14: tempScore←0 15: end if 16: else 17: similarity← similarityFunction(httpRequest.requestURI, dataBase(“requestURI”)) 18: tempScore←100×similarity 19: end if 20: end if
21: sumScore←sumScore + tempScore
22: end for
23: avgScore←sumScore÷Size of fieldNames
24: record avgScore as the original score of each httpRequest
25: end for
flexible on the proximity measure and can visualize the clustering results using a dendrogram to help with choosing the optimal number of clusters.
In our framework, we use the single-linkage [39] clustering, which is an agglomerative or bottom-up approach. According to Perdisci et al. [34], single-linkage hierarchical clustering has the best performance compared to X-means [40] and complete-linkage [41] hierarchical clustering.
Feature Extraction for Clustering. First, we need to compute distance measures to represent similarities among HTTP requests. We extract features from URLs and define a distance between two requests according to an algorithm proposed in [34], except that we reduce the number of features to make our algorithm much more efficient. In the end, we extract three types of features to perform clustering: the domain name and port number, a path to the file, and Jaccard’s distance [42] between parameter keys. As an example, consider the following request:
http://www.example.com:80/path/to/myfile.html?key1=value1&key2=value2
The field, www.example.com:80, represents the first feature. The field, /path/to/
myfile.html, represents the second feature. The field, key1=value1&key2=value2, represents the parameters, each is a key-value pair, of this request. To compute the third feature, we calculate the Jaccard’s distance [42] between the keys. We do not use the parameter values here because these values can be very long, and the comparison between a large number of long strings would consume a large amount of time.
Note that in work by Perdisci et al. [34], they also use the same three features with an addition of the fourth with is the concatenation of parameter values to calculate the similarity of requests for desktop applications. According to [30], the length of URL is larger for the Android malware than the desktop malware, and from our tests, we find the time to calculate the similarity using the fourth feature is much longer than with just three features. We also find that we can get comparable clustering accuracy by just using the three features. As such, we exclude the fourth feature to make our system more efficient but without sacrificing accuracy. In Section 2.3, we show that our system is as effective as using four features [30], but is also significantly faster.
Recall that we extract five HTTP features (see Table 2.1) to perform training. Since these features are strings, we use the Levenshtein Distance [38] between two strings to measure their similarity. For parameter keys, Jaccard’s distance [42] is
applied to measure the similarity. Suppose the number of HTTP requests is N, we
can get three N×N matrices based on three clustering feature sets. We calculate the
average value of the three matrices and regard this average matrix as the similarity matrix used by the clustering algorithm.
consider requests from the same cluster as one group and use the average value to classify this cluster.
2.2.3 Malware Classification
We use the remaining 50% of malware samples in each family as the testing set. To determine the threshold for classification, we include traffic from 20% benign apps and 20% malware samples. We use the same method as depicted in the previous section to calculate the original score of each benign request. However, when we calculate the
zscore range of benign apps, we use the mean score (x¯) and standard derivation(s) of the
20% malware family we have in previous sections (i.e. |zscore|=
x−x¯(malware) s(malware) ). Then
we use the malware zscore range and benignzscore range to determine the threshold for
each malware family in an adaptive manner.
For instance, in the BaseBridge family, the absolute range of zscore varies from 1.0
to 1.3 using malicious traffic from 20% malware samples. Meanwhile, this value ranges
from 1.5 to 10 for the 20% benign apps using the BaseBridge database. As a result,
we can then set the threshold to be 1.4, which is computed by (1.3 + 1.5)/2. For the
testing traffic, if the absolute value of zscore derived by testing zscore computation is
less than the threshold, the app is classified into this BaseBridge family.
2.2.4 Malware Detection
This detection process is very similar to the clustering process. However, the testing set has been expanded to include traffic from both malicious apps and 5,215 benign apps. The detection phase proceeds like the classification phase. We use BaseBridge family as an example. After extracting each HTTP request from PCAP files, we calculate the score based on BaseBridge training database, similar to classification phase, and
believe this traffic comes from BaseBridge family, and the traffic request is classified as malicious. Otherwise, the traffic does not belong to the BaseBridge family. In the end, if the traffic request is not assigned to any malware families, this request is deemed benign.
Next, we illustrate how to calculate the detection accuracy for each malware family through an example using the BaseBridge family. If a request is from a BaseBridge fam-ily app, and it is also identified as belonging to it, then this is true positive (TP). Other-wise, it is false negative (FN). If the request is not from BaseBridge family app, but it is identified as belonging to it, then it is false positive (FP); otherwise, it is true negative
(TN). We then calculate thedetection accuracy(DetectionAccuracy = T P+T NT P++T NF N+F P)
and malware detection rate (M alware Detection Rate = SU M(SU MF N)+(T PSU M) (T P)) of each family.
2.3
Evaluation
We evaluate the malware classification performance of DroidClassifier. We use 30% of
the malware samples for database building, 20% of both malware and benign apps for threshold calculation. We set up the testing set to use the remaining 50% of the malware samples and 80% of benign apps. Specifically, we evaluate the following
performance aspects of DroidClassifier system.
1. We evaluate classification effectiveness of DroidClassifier to classify malicious
apps into different families of malware. We present the performance in terms of detection accuracy, TPR (True Positive Rate), TNR (True Negative Rate), and F-Measure. Our evaluation experiments using different numbers of clusters to determine which one yields the most accurate classification result.
2. We evaluate the malware detection effectiveness of DroidClassifier using only
malware samples as the training and testing sets. We only focus on how
well DroidClassifier correctly detects malware. The detection performance is
represented by detection accuracy.
3. We evaluate the influence of clustering on malware detection effectiveness by
comparing the detection rates between the best case inDroidClassifier when the
number of cluster is 1000, and DroidClassifier without clustering process.
4. We compare our classification effectiveness with results of other approaches. We
also compare the efficiency of DroidClassifier with a similar clustering system [30].
Our dataset consists of 1,363 malicious apps, and our benign apps are downloaded from multiple popular app markets by app crawler. Each downloaded app is sent to VirusTotal for initial screening. The app is added to our normal app set only if the test result is benign. Eventually, we get a normal app set of 5,215 samples belonging to 24 families. We also collect a large amount of traffic data by an automatic mobile traffic collection system, similar to the system described in [35] to evaluate
the classification/detection performance of DroidClassifier. In the end, we get
500.4 MB of network traffic data generated by malware samples in total, out of which we extract 18.1 MB of malicious behavior traffic for training purposes. Similarly, we collect 2.15 GB of data generated by normal apps for model training and testing.
2.3.1 Malware Classification Effectiveness Across Different Cluster Num-bers
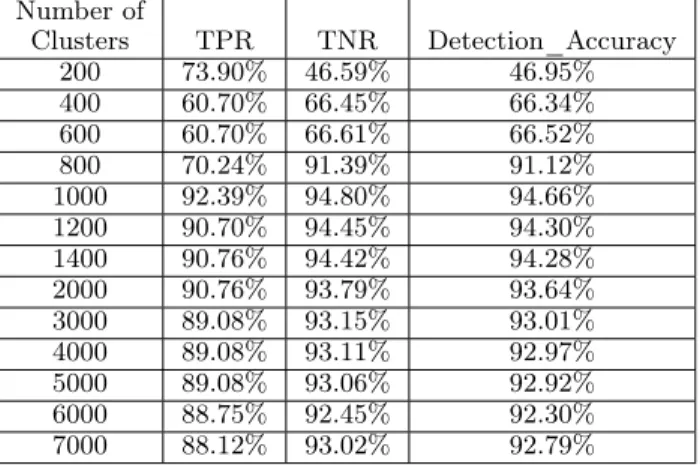
In our experiment, we investigate the sensitivity of our approach to the number of clusters. Therefore, we strategically adjust the number of clusters to find the optimal number that is used to classify malware in the testing data. To do so, we evaluate 13
Table 2.2: Classification Result with Different Number of Clusters ( TPR=TP/(TP+FN); TNR=TN/(TN+FP) ) Number of Clusters TPR TNR Detection_Accuracy 200 73.90% 46.59% 46.95% 400 60.70% 66.45% 66.34% 600 60.70% 66.61% 66.52% 800 70.24% 91.39% 91.12% 1000 92.39% 94.80% 94.66% 1200 90.70% 94.45% 94.30% 1400 90.76% 94.42% 94.28% 2000 90.76% 93.79% 93.64% 3000 89.08% 93.15% 93.01% 4000 89.08% 93.11% 92.97% 5000 89.08% 93.06% 92.92% 6000 88.75% 92.45% 92.30% 7000 88.12% 93.02% 92.79%
different numbers of clusters for the whole dataset, ranging from 200 to 7000 clusters. Table 2.2 shows the classification results using 13 different numbers of clusters. When we increase the number of clusters from 200 to 1000, the detection accuracy also improves from 46.95% to 94.66%, respectively. However, using more than 1000 clusters does not improve accuracy. As such, using 1000 clusters is optimal for our dataset. In
this setting, but without using DroidKungfu and Gappusin, the two families which
are previously known to be hard to detect and classify [9], DroidClassifier achieves
TPR of 92.39% and TNR of 94.80%, respectively. With these two families, our TPR and TNR still yield 89.90% and 87.60%, respectively.
2.3.2 Detection Effectiveness Per Family
Next, we further decompose our analysis to determine the effectiveness of
Droid-Classifier by evaluating our effectiveness metrics per malware family. As shown
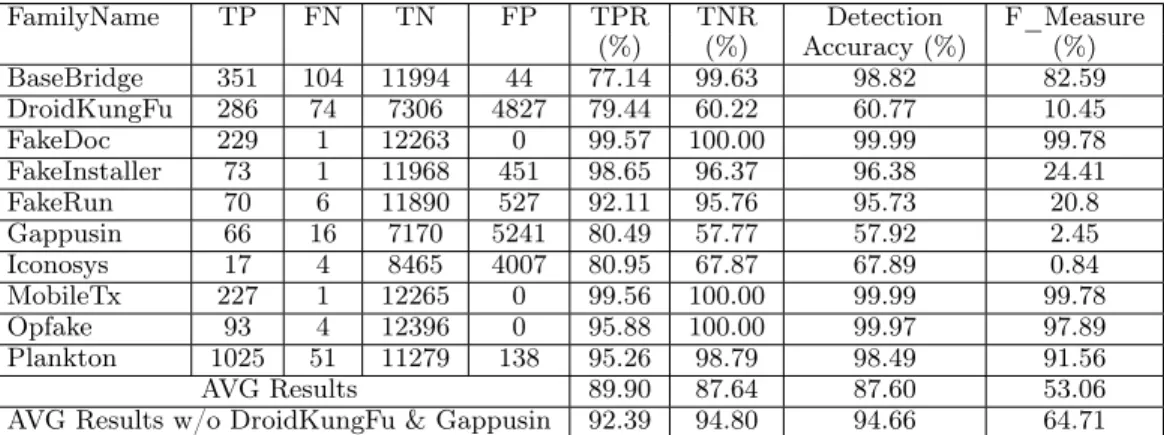
in Table 2.3, in four out of ten families, our system can achieve more than 90% in F-Measure, meaning that it can accurately classify malicious family as it detects more true positives and true negatives than false positives and false negatives. As the table reports, our system yields accurate classification results in BaseBridge, FakeDoc,
Table 2.3: Malware Classification Performance with 1000 Clusters ( F_Measure = 2TP / (2TP + FP + FN) )
FamilyName TP FN TN FP TPR TNR Detection F_Measure
(%) (%) Accuracy (%) (%) BaseBridge 351 104 11994 44 77.14 99.63 98.82 82.59 DroidKungFu 286 74 7306 4827 79.44 60.22 60.77 10.45 FakeDoc 229 1 12263 0 99.57 100.00 99.99 99.78 FakeInstaller 73 1 11968 451 98.65 96.37 96.38 24.41 FakeRun 70 6 11890 527 92.11 95.76 95.73 20.8 Gappusin 66 16 7170 5241 80.49 57.77 57.92 2.45 Iconosys 17 4 8465 4007 80.95 67.87 67.89 0.84 MobileTx 227 1 12265 0 99.56 100.00 99.99 99.78 Opfake 93 4 12396 0 95.88 100.00 99.97 97.89 Plankton 1025 51 11279 138 95.26 98.79 98.49 91.56 AVG Results 89.90 87.64 87.60 53.06
AVG Results w/o DroidKungFu & Gappusin 92.39 94.80 94.66 64.71
FakeInstaller, FakeRun, MobileTx, Opfake, and Plankton. Specifically, FakeDoc and MobileTx show above 99% in F-measure, which means it almost detect everything correctly in these two families. However, DroidKungFu, FakeInstaller, FakeRun, Gappusin, and Iconosys show very low F-measure.
Discussion. Our system cannot accurately classify these three families (i.e. Droid-KungFu, Gappusin, and Iconosys) due to two main reasons. First, the amounts of network traffic for these families are too small. For example, we only have 38 appli-cations in Iconosys family, and among these, only 19 appliappli-cations produce network traffic information. We plan to extend the traffic collection time to address this issue in future works.
Second, the malware samples in DroidKungFu and Gappusin families produce a large amount of traffic information that shares similar patterns with that of other families and can lead to ambiguity. We also cross-reference our results with those
reported by Drebin [9]. Their results also confirm our observation as their approach
can only achieve less than 50% detection accuracy, which is even lower than that achieved by our system. This is the main reason why we report our result in Table 2.5 by excluding DroidKungFu and Gappusin.
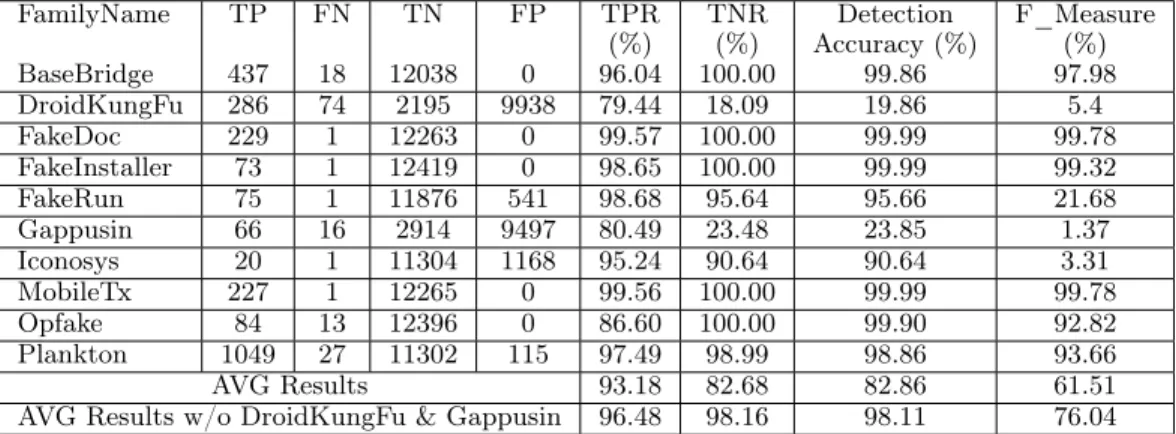
Table 2.4: Classification Performance without Clustering Procedure
FamilyName TP FN TN FP TPR TNR Detection F_Measure
(%) (%) Accuracy (%) (%) BaseBridge 437 18 12038 0 96.04 100.00 99.86 97.98 DroidKungFu 286 74 2195 9938 79.44 18.09 19.86 5.4 FakeDoc 229 1 12263 0 99.57 100.00 99.99 99.78 FakeInstaller 73 1 12419 0 98.65 100.00 99.99 99.32 FakeRun 75 1 11876 541 98.68 95.64 95.66 21.68 Gappusin 66 16 2914 9497 80.49 23.48 23.85 1.37 Iconosys 20 1 11304 1168 95.24 90.64 90.64 3.31 MobileTx 227 1 12265 0 99.56 100.00 99.99 99.78 Opfake 84 13 12396 0 86.60 100.00 99.90 92.82 Plankton 1049 27 11302 115 97.49 98.99 98.86 93.66 AVG Results 93.18 82.68 82.86 61.51
AVG Results w/o DroidKungFu & Gappusin 96.48 98.16 98.11 76.04
2.3.3 Comparing Detection Effectiveness of Clustering versus Non-Clustering
In Table 2.4, we report the detection results when clustering is not performed (i.e., we configure our system to have a cluster for each request). As shown in the table, the detection accuracy without clustering is significantly worse than those with clustering for DroidKungFu and Gappusin. In DroidKungFu family, the detection accuracy decreases from 60.77% to 19.86% by eliminating the clustering procedure. In Gappusin family, the detection accuracy decreases from 57.92% to 23.85%. However, after removing these two families, it shows better average detection accuracy than
DroidClassifier with the clustering procedure. The detection accuracy of the Iconosys
family increases from 67.89% to 90.64% by removing the clustering procedure.
Discussion. Upon further investigation of the network traffic information, we uncover that the network traffic generated by many benign applications and that of the Iconosys family are very similar. As such, many benign network traffic flows are included with malicious traffic flows as part of the clustering process. However, the overall detection rate including two worst cases (i.e. AVG results in Table 2.3 and 2.4) shows that
DroidClassifier with clustering is more accurate thanDroidClassifier without clustering.
classifies malware as a group, while the mechanism without clustering classifies malware
individually. This makes DroidClassifier with clustering much more efficient than the
mechanism without clustering, in terms of system processing time.
2.3.4 Comparing Performance with Other Mobile Malware Detectors
In this section, we compare our detection results with other malware detection
approaches, including Drebin, PermissionClassifier, Aresu et al. [30], and Afonso et
al. [43].
• Drebin [9] is an approach that detects malware by combining static analysis of
permissions and APIs with machine learning. It utilizes Support Vector Machine (SVM) algorithm to classify malware data set.
• PermissionClassifier, on the other hand, uses only permission as the features
to perform malware detection. During the implementation, we use the same
malicious applications used to evaluateDrebin. Then we useApktool [44] to find
the permissions called by each application. We randomly separate the data set as training and testing set. SVM classification approach is employed to perform malware classification.
• Aresu et. al [30] extract malware signatures by clustering HTTP traffic, and
they use these signatures to detect malware. We implement their clustering method, and compare the result with that produced by our system.
• Afonso et al. [43] develop a machine learning system that detects Android
malicious apps by using dynamic information from system calls and Android API functions. They employ a different dynamic way to detect malware and also use Android Malware Genome Project [36] as the dataset.
Table 2.5 reports the results of our evaluation. Drebin uses more features than
PermissionClassifier, including API calls and network addresses. As a result, Drebin
outperforms PermissionClassifier in detection accuracy. We also compare the results
of our system against those of 10 existing anti-virus scanners [9]: AntiVir, AVG, BitDefender, ClamAV, ESET, F-Secure, Kaspersky, McAfee, Panda, Sophos. We report the minimum, maximum, and average detection rate of these 10 virus scanners in columns 5 to 7 (AV1 – AV10).
Table 2.5: Detection Rates of DroidClassfier and Ten Anti-Virus Scanners
Method Droid Permission Drebin Aresu Afonso AV1 – AV10 Classifier Classifier et al. et al. Min Max Avg. Full Dataset 94.33% 89.30% 93.90% 60% - 100% 96.82% 3.99% 96.41% 61.25%
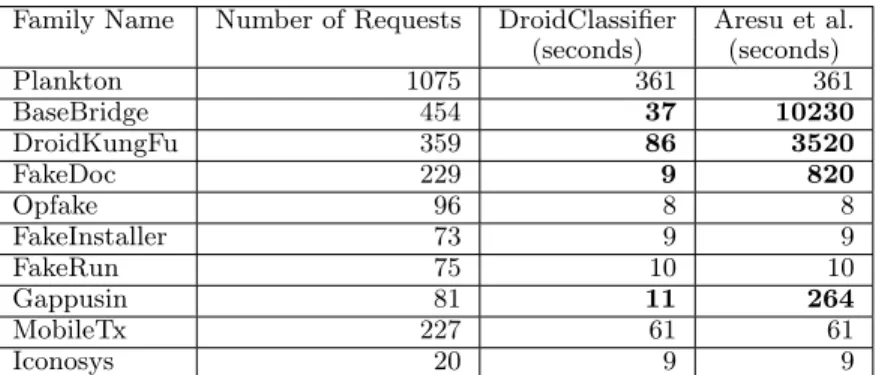
The most time-consuming part of the hierarchical clustering is the calculation of the similarity matrix. Aresu et. al [30] use one more feature, the aggregation of values in the Request-URI field, to build their clustering system. We implement their method and evaluate the time to compute the similarity matrix. We then compare their time consumption for matrix computation of each malware family with that of
DroidClassifier and report the result in Table 2.6. For BaseBridge, DroidKungFu,
FakeDoc, and Gappusin, our approach incurs 60% to 100% less time than their approach while yielding over 94% detection rate. For other families, the time is about the same. This is because those families do not generate traffic with the Request-URI field.
Drebin and PermissionClassifier are the state-of-the-art malware detection system with high detection accuracy. Our approach is a dynamic-analysis based approach. In the literature, as far as we know, there is a lack of comparative work using dynamic analysis on a large malware dataset to evaluate malware detection accuracy. Therefore, though Drebin and PermissionClassifier use static analysis features, we compare against them in terms of malware detection rate to prove the detection accuracy of
Table 2.6: Time Comparison of Matrix Calculation (Experiments run on Apple MacBook Pro with 2.8GHz Intel Core i7 and 16G memory)
Family Name Number of Requests DroidClassifier Aresu et al. (seconds) (seconds) Plankton 1075 361 361 BaseBridge 454 37 10230 DroidKungFu 359 86 3520 FakeDoc 229 9 820 Opfake 96 8 8 FakeInstaller 73 9 9 FakeRun 75 10 10 Gappusin 81 11 264 MobileTx 227 61 61 Iconosys 20 9 9
DroidClassifier. As our proposed classifier is a network-traffic based classifier, the
main advantage of our classifier is that we can deploy our system on gateway routers instead of end-user devices.
Work by Aresu et al. uses clustering to extract signatures to detect malware. We have emphasized the difference between our work and Aresu before. In terms of comparison, we compare the detection rate and time cost with them. Our work can achieve over 90% detection rate. Even though the purpose of our clustering is different, we can still compare the clustering efficiency. For BaseBridge, DroidKungFu, FakeDoc, and Gappusin, our approach, in terms of clustering time, is more efficient than their approach by 60% to 100%.
Work by Afonso et al. [43] can achieve the average detection accuracy of 96.82%. So far, the preliminary investigation of detection effectiveness already indicates that our system can achieve nearly the same accuracy. Unlike their approach, our system can also classify samples into different families, which is essential, as repackaging is a common form to develop malware. Their approach still requires that a malware sample executes completely. In the case that it does not (e.g., interrupted connection with a C&C server or premature termination due to detection of malware analysis environments), their system cannot perform detection. However, our network
traffic-based system can handle partial execution as long as the malware attempts to send sensitive information. The presence of our system is also harder to detect as it captures the traffic on the router side, preventing specific malware samples from prematurely terminating execution to avoid analysis.
2.4
Discussion
In this chapter, we use HTTP header information to help classify and detect malware. However, our current implementation does not handle encrypted requests through HTTPS protocol. To handle such type of requests in the future, we may need to work closely with runtime systems to capture information before encryption, or use on-device software such as Haystack [45] to decrypt HTTPs traffic.
Our system also expects a sufficient number of requests in the training set. As shown in families such as Iconosys, insufficient data used during training can cause the system to classify malware and benign samples incorrectly. Furthermore, to generate network traffic information, our approach, similar to work by Afonso et al. [43], relies on Monkey to generate sufficient traffic. However, events triggered by Monkey tool are random, and therefore, may not replicate real-world events, especially in the case that complex event sequences are needed to trigger malicious behaviors. In such scenarios, malicious network traffic may not be generated. Creating complex event sequences is still a major research challenge in the area of testing GUI- and event-based applications. To address this issue in the future, we plan to use more sophisticated event sequence generation approaches to including GUI ripping and symbolic or concolic execution. [46]. We will also evaluate the minimum number of traffic requests that are required to induce good classification performance in future works.
Currently, our framework can only detect new samples from known families if they happen to share previously modeled behaviors. For sample requests from totally unknown malware samples, our framework can put all these similar requests into a cluster. This can help analysts to isolate these samples and simplify the manual analysis process. We also plan to extract other features beyond application-layer header information. For example, we may want to focus on the packet’s payload that may contain more interesting information, such as C&C instructions and sensitive data. We can also combine the network traffic information with other unique features, including permission and program structures such as data-flow and control-flow information.
Similar to existing approaches, our approach can still fail against determined adversaries who try to avoid our classification approach. For example, an adversary can develop advanced techniques to change their features without affecting their malicious behaviors dynamically. Currently, machine-learning-based detection systems suffer from this problem [47]. We need to consider how adversaries may adapt to our classifiers and develop better mobile malware classification and detection strategies.
We are in the process of collecting newer malware samples to evaluate our system further. We anticipate that newer malware samples may utilize more complex interac-tions with C&C servers. In this case, we expect more meaningful network behaviors that our system can exploit to detect and classify these emerging-malware samples.
Lastly, our system is lightweight because it can be installed on the router to detect malicious apps automatically. The system is efficient because our approach classifies and detects malware at the cluster granularity instead of at each individual request granularity, resulting in much less classification and detection efforts. As future work,
2.5
Related Work
Network Traffic Analysis has been used to monitor runtime behaviors by exercising targeted applications to observe app activities and collect relevant data to help with analysis of runtime behaviors [21, 48, 49, 50, 51]. Information can be gathered at ISP level or by employing proxy servers and emulators. Our approach also collects network traffic by executing apps in device emulators. The collected traffic information can be analyzed for leakage of sensitive information [12, 52], used for classification based on network behaviors [34], or exploited to detect malware automatically [33, 35, 53].
Supervised and unsupervised learning approaches are then used to help with detecting [54,55,56] and classifying desktop malware [34,57] based on collected network traffic. Recently, there have been several efforts that use network traffic analysis and machine learning to detect mobile malware. Shabtai et al. [58] present a Host-based Android machine learning malware detection system to target the repackaging attacks. They conclude that deviations of some benign behaviors can be regarded as malicious ones. Narudin et al. [59] come up with a TCP/HTTP based malware detection system. They extracted basic information (e.g., IP address), content-based, time-based, and connection-based features to build the detection system. Their approach can only determine if an app is malicious or not, and they cannot classify malware to different families.
FIRMA [60] is a tool that clusters unlabeled malware samples according to network traces. It produces network signatures for each malware family for detection. Anshul et al. [53] propose a malware detection system using network traffic. They extract statistical features of malware traffic, and select decision trees as a classifier to build their system. Their system can only judge whether an app is malicious or not. Our system, however, can identify the family of malware.
Aresu et al. [30] create malware clusters using traffic and extract signatures from clusters to detect malware. Our work is different from their approach in that we extract malware patterns from existing families by analyzing HTTP traffic and determining scores to help with malware classification and detection. To make our system more efficient, we then form clusters of testing traffics to reduce the number of test cases (each cluster is a test case) that must be evaluated. This allows our approach to be
more efficient than the prior effort that analyzes each testing traffic trace.
2.6
Conclusion
In this chapter, we introduce DroidClassifier, a malware classification and detection
approach that utilizes multidimensional application-layer data from network traffic
information. DroidClassifier integrates clustering and classification frame to take
into account disparate and unique characteristics of different mobile malware families. Our study includes over 1,300 malware samples and 5,000 benign apps. We find that
DroidClassifier successfully identifies over 90% of different families of malware with
94.33% accuracy on average. Meanwhile, it is also more efficient than state-of-the-art approaches to perform Android malware classification and detection based on network
traffic. We envision DroidClassifier to be applied in network management to control
Chapter 3
GranDroid: Graph-based Detection of Malicious Network
Behaviors in Android Applications
Portions of this material have previously appeared in the following publication:
Z. Li, J. Sun, Q. Yan, W. Srisa-an, and S. Bachala, “Grandroid: Graph-based detection of malicious network behaviors in android applications,” in International Conference on Security and Privacy in Communication Systems. Springer, 2018, pp. 264–280.
In this chapter, we set our research goal to enhance the capability of hybrid analysis and evaluate if it can provide sufficiently rich context information in detecting malware’s malicious network behaviors on real devices within a specific time budget. Analyzing apps on real devices mitigates the evasion attacks by sophisticated malware that determines its attacking strategy based on its running environment. However, the challenge lies in need of lowering the analysis overhead incurred on resource-constrained mobile devices. Also, we aim at capturing additional relevant network-related programming logic by using dynamic analysis, so that we can avoid any wasteful efforts in distilling information from apps. We then evaluate the effectiveness
of the dynamically generated information in detecting malicious network behaviors of mobile malware.
To achieve this research goal, we introduce GranDroid, a graph-based malicious
network behavior detection system. GranDroid has been implemented as a tool
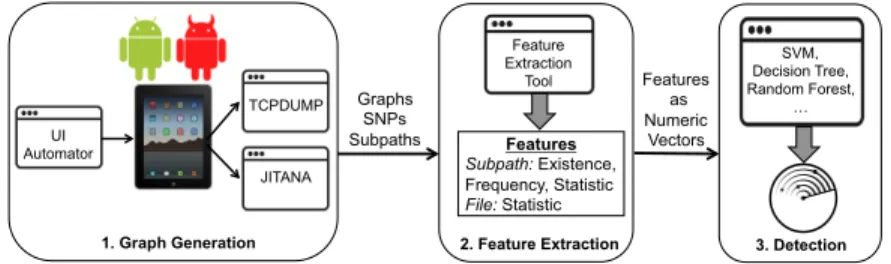
built on Jitana, a high-performance hybrid program analysis framework [61]. We
extract four network-related features from the network-related paths and subpaths that incorporate network methods, statistic features of each subpath, and statistic features on the sizes of newly-generated files during the dynamic analysis. These features uniquely capture the programming logic that leads to malicious network behaviors. We then apply different types of machine learning algorithms to build models for detecting malicious network behaviors.
We evaluate GranDroid using 1,500 benign and 1,500 malicious apps
col-lected recently, and run these apps on real devices (i.e., Asus Nexus 7 tablets) using
event sequences generated by UIAutomator1. Our evaluation results indicate that
GranDroid can achieve high detection performance with 93.2% F-measure.
The rest of the chapter is organized as follows. We provide a motivating example for this work in Section 3.1. We present system design and implementation in Section 3.2. We report our evaluation results in Section 3.3 and discuss the ramifications of the reported results in Section 3.4. We describe related work in Section 3.5 and conclude this chapter in Section 3.6.
3.1
Motivation
Bouncer, the vetting system used by Google, can be bypassed by either delaying
enacting the malicious behaviors or not enacting the malicious behaviors when the app 1available from: https://developer.android.com/training/testing/ui-automator.html
is running on an emulator instead of a real device. Figure 3.1 illustrates a code snippet from Android.Feiwo adware [62], a malicious advertisement library that leaks user’s private information including device information (e.g., IMEI) and device location. The
Malcodemethod checks fake device ID or fake model to determine whether the app is
running on an emulator.
1: public static Malcode(android.content.Context c) {
2: ...
3: v0 = c.getSystemService("phone").getDeviceId(); 4. if (v0 == 0 || v0.equals("000000000000000") == 0) { 5. if ((android.os.Build.MODEL.equals("sdk") == 0) &&
(android.os.Build.MODEL.equals("google_sdk") == 0)) {
6: server = http.connect (server A);}
7: else{
8: server = http.connect (server B); }}
9: else{
10: server = http.connect (server B);}
11: // Send message to server through network interface
12: ...}
Figure 3.1: Android.Feiwo Adware Example
In this example, if the app is being vetted through a system like Bouncer, it
would be running on an em