WORKING PAPER SERIES
FEDERAL RESERVE BANK
o
f
ATLANTA
What Explains Differences in Foreclosure Rates?
A Response to Piskorski, Seru, and Vig
Manuel Adelino, Kristopher Gerardi, and Paul Willen
Working Paper 2010-8
The authors thank Chris Foote for thoughtful comments. The views expressed here are the authors’ and not necessarily those of the Federal Reserve Banks of Atlanta or Boston or the Federal Reserve System. Any remaining errors are the authors’ responsibility.
Please address questions regarding content to Manuel Adelino, MIT and Federal Reserve Bank of Boston, MIT Sloan School of Management, 50 Memorial Drive, E52-458, Cambridge, MA 02142, 857-383-1027, [email protected]; Kristopher Gerardi, Research Department, Federal Reserve Bank of Atlanta, 1000 Peachtree Street, N.E., Atlanta, GA 30309-4470, 404-498-8561, [email protected]; or Paul Willen, Research Department, Federal Reserve Bank of Boston, P.O. Box 55882, Boston, MA 02205, 617-973-3149, [email protected].
Federal Reserve Bank of Atlanta working papers, including revised versions, are available on the Atlanta Fed’s Web site
FEDERAL RESERVE BANK o
f
ATLANTA
WORKING PAPER SERIES
What Explains Differences in Foreclosure Rates?
A Response to Piskorski, Seru, and Vig
Manuel Adelino, Kristopher Gerardi, and Paul Willen
Working Paper 2010-8
March 2010
Abstract: In this note we discuss the findings in Piskorski, Seru, and Vig (2010) as well as the authors’ interpretation of their results. First, we find that small changes to the set of covariates used by Piskorski, Seru, and Vig significantly reduce the magnitude of the differences in foreclosure rates between securitized and nonsecuritized loans. Second, we argue that early payment defaults (EPD) are not a valid instrument for the securitization status of the loans and that the empirical implementation chosen by the authors for using EPD is not a valid instrumental variables approach. Finally, we discuss the use of foreclosure rates as a measure of renegotiation and argue that explicitly using modification rates of delinquent mortgages is a better way of studying renegotiation activity. On balance, the evidence in Piskorski, Seru, and Vig indicates that there are at most small differences in the outcomes of delinquent loans, but whether those differences reflect accounting issues, willingness to renegotiate, or unobserved heterogeneity remains an open question.
JEL classification: D11, D12, G21
What Explains Differences in Foreclosure
Rates?
A Response to Piskorski, Seru, and Vig
∗
Manuel Adelino
†MIT and FRB Boston
Kristopher Gerardi
‡FRB Atlanta
Paul Willen
§FRB Boston
March 5, 2010
AbstractIn this note we discuss the findings in Piskorski, Seru, and Vig (2010), as well as the authors’ interpretation of their results. First, we find that small changes to the set of covariates used by PSV significantly reduce the magnitude of the differences in foreclosure rates between securitized and nonsecuritized loans. Second, we argue that early payment defaults (EPD) are not a valid instrument for the securitization status of the loans and that the empirical implementation chosen by the authors for using EPD is not a valid instrumental variables approach. Finally, we discuss the use of foreclosure rates as a measure of renegotiation and argue that explicitly using modification rates of delinquent mortgages is a better way of studying renegotiation activity. On balance, the evidence in PSV indicates that there are at most small differences in the outcomes of delinquent loans, but whether those differences reflects accounting issues, willingness to renegotiate or unobserved heterogeneity remains an open question.
∗We thank Chris Foote for thoughtful comments. †manuel.adelino@bos.frb.org
‡kristopher.gerardi@atl.frb.org §paul.willen@bos.frb.org
1. Introduction
Piskorski, Seru, and Vig (2010) (hereafter referred to as PSV), use micro-panel data on the repayment behavior of mortgage borrowers to study the role of securitization in foreclosure loss mitigation efforts. The authors find a foreclosure bias in servicing decisions induced by the process of securitization. Specifically, they find large differences in foreclosure sale rates between seriously delinquent loans held on a mortgage servicer’s portfolio (hereafter referred to as “portfolio-held” loans) and loans securitized by private trusts (hereafter referred to as “private-label” loans). According to their estimates, the probability of a portfolio-held, seriously delinquent loan being foreclosed upon is 3.8 to 7 percentage points lower in absolute terms and 18 to 32 percent lower relative to the unconditional foreclosure mean of private-label loans. They interpret this difference in foreclosure rates as evidence that servicers of private-label loans renegotiate with borrowers less often than servicers of portfolio-held loans do. In turn, they attribute such differences in renegotiation behavior to be the result of contract frictions present in securitization trusts that prevent an optimal amount of renegotiation to take place.
In this comment we discuss three issues that we believe shed serious doubts on the paper’s empirical findings as well as the authors’ interpretation of those findings. First, in section 1, we replicate the main PSV foreclosure rate results and show that they are extremely sensitive to the addition of covariates and are not particularly robust to a subsample analysis. Second, we discuss a “quasi experiment” that the authors use in an attempt to solve the endogenous selection issues inherent in the determination of whether or not a mortgage is securitized. A mortgage originator decides which loans to sell from its portfolio to issuers of mortgage-backed-securities (MBS) on the secondary mortgage market, and in turn, an MBS issuer decides which loans to purchase from mortgage originators. Since the dataset does not contain all of the variables that determine these decisions, there is the potential for omitted variable bias in the empirical estimation. PSV try to solve this problem by using early-payment default stipulations embedded in many securitization deals that require the originating institution to buy back loans that default within a specific number of months of being sold. They argue that these stipulations generate exogenous variation in the ultimate decision of whether or not a loan is securitized. In section 2 we provide a detailed list of reasons why early-payment default stipulations do not solve the securitization identification problem. Finally, in section 3, we discuss the authors’ interpretation that differences in foreclosure sale rates between private-label and portfolio-held loans represent differences in the incidence of renegotiation between borrowers and servicers of each type of loan, respectively. As an alternative to differences in foreclosure sale rates, we propose looking at
both differences in modification behavior and differences in mortgage “cure” rates, where we define a “cure” as an instance in which a seriously delinquent borrower catches up and becomes current on his or her mortgage. In other work (Adelino, Gerardi, and Willen, 2009 — hereafter referred to as AGW) we studied portfolio and private-label modification and “cure” rates and have negligible differences, suggesting that differences in foreclosure sale rates (to the extent that they actually exist) are caused by a mechanism other than differences in renegotiation behavior.
2. PSV Foreclosure Regressions Revisited
We begin by replicating PSV’s main results regarding differences in foreclosure rates between portfolio-held and private-label mortgages. We use a 10% random sample of mortgages from LPS (the same dataset used by PSV). We impose the same sample restrictions used by PSV. These are listed in Table 1.
Table 1
PSV Sample Restrictions
1. Loans originated in 2005 and 2006.
2. Mortgage payment history through the first quarter of 2008. 3. First-lien mortgages only.
4. Drop observations with incomplete information about original credit scores, original interest rates, origination amounts, and property values.
5. Drop mortgages originated outside of Metropolitan Statistical Areas. 6. Keep only mortgages with maturities of 15, 20, and 30 years.
7. Keep only mortgages that entered the LPS database within four months of the origination date. 8. Drop loans with FICO scores less than 500 and greater than 850.
9. Drop loans with LTV greater than 150 percent.
10. Exclude loans originated in Alaska, Hawaii, and other noncontinental areas.
11. Exclude loans that had their servicing rights transferred to a servicer outside of LPS’s coverage.
PSV estimate the following logistic regression,
P r(Yi = 1|Delinquency) = Φ(α+βP ortf olioi+γXi+δm+εi), (1)
where the dependent variable is a dichotomous variable for seriously delinquent loan ithat takes a value of 1 if the loan is foreclosed and 0 otherwise. PSV define a seriously delinquent loan as a case in which the borrower has missed at least two mortgage payments, and condition on the first time a loan becomes seriously delinquent. Xi is a vector of loan
and borrower characteristics that includes indicator variables associated with FICO score intervals, initial interest rates, initial LTV, the square of initial LTV, origination amount, the square of the origination amount, an indicator for whether the loan has a fixed-rate,
indicator variables for the three possible maturity lengths (15, 20, and 30 years), indicator variables for whether the borrower has private mortgage insurance, the age in months of the mortgage when it first becomes 60-days delinquent, and a full set of MSA fixed effects. The independent variable of interest is P ortf olio, which is a dichotomous variable that takes the value 1 if the delinquent loan was held on the lender’s balance sheet and 0 if the loan was securitized. Table 2 below displays the results from replicating PSV’s main findings (Table 3 in their paper). PSV estimate the logistic regressions separately for each quarter of origination, and this is reflected in Table 1, as each column corresponds to the estimation of equation 1 for a separate quarter of origination.
Table 2
Logit of Foreclosure Conditional on 60+ Days Delinquency: Replication of PSV’s Table 3
Origination Quarter 2005:Q1 2005:Q2 2005:Q3 2005:Q4 2006:Q1 2006:Q2 2006:Q3 2006:Q4 Dependent Variable: Foreclosure
Mean Portfolio Foreclosure (%) 23.6 19.1 18.8 16.1 22 15.8 16.2 14.7 Mean Private-Label Foreclosure (%) 29.9 28.6 25.1 26 25.6 22 19.2 14.5 Portfolio (d) -0.052** -0.095*** -0.061*** -0.111*** -0.065*** -0.066*** -0.049*** -0.028*** (-2.57) (-6.92) (-3.54) (-10.03) (-4.50) (-5.67) (-6.01) (-3.40) FICO<620 (d) -0.102*** -0.138*** -0.123*** -0.137*** -0.142*** -0.117*** -0.074*** -0.058*** (-5.00) (-8.89) (-8.84) (-8.75) (-10.87) (-12.22) (-7.39) (-6.24) 620≤FICO<680 (d) -0.032* -0.036** -0.026** -0.031** -0.034*** -0.034*** 0.001 -0.009 (-1.65) (-2.43) (-2.05) (-2.08) (-2.76) (-3.41) (-0.10) (-1.32) LTV 1.903*** 2.334** 1.947*** 1.126* 1.644*** 1.472*** 0.579** 0.147 (-3.00) (-2.27) (-2.76) (-1.69) (-2.63) (-3.14) (-2.38) (-0.72) LTV Squared -0.978** -1.110* -0.945** -0.46 -0.793** -0.716*** -0.22 -0.033 (-2.23) (-1.78) (-2.28) (-1.11) (-2.00) (-2.65) (-1.45) (-0.24) Origination Amount -0.000*** 0 0 0 0.000* 0 0 0 (-3.07) (-0.07) (-0.66) (-0.94) (-1.65) (-1.12) (-0.08) (-0.74)
Origination Amount Squared 0.000*** 0 0 -0.000* -0.000** 0 0 0
(-4.00) (-0.40) -0.09 (-1.66) (-2.17) (-1.08) (-0.77) (-0.92) Original Interest Rate 0.016*** 0.015*** 0.019*** 0.008* 0.015*** 0.017*** 0.015*** 0.005**
( -3.57) (-4.32) (-3.73) (-1.90) (-4.27) (-4.32) (-5.56) (-2.16) FIX (d) -0.108*** -0.097*** -0.066*** -0.071*** -0.057*** -0.030*** -0.029*** -0.016* (-6.24) (-7.07) (-5.30) (-6.82) (-4.32) (-3.30) (-3.54) (-1.73) Age at Delinquency -0.013*** -0.016*** -0.019*** -0.024*** -0.030*** -0.028*** -0.029*** -0.026***
(-15.61) (-25.10) (-20.84) (-34.15) (-39.08) (-46.89) (-64.46) (-73.96)
MSA Fixed Effects Y Y Y Y Y Y Y
N 4,990 6,821 6,561 7,102 6,959 6,826 6,044 4,324
Notes: The only difference between our specification and the PSV specification is that we do not control for whether the borrower has private mortgage insurance (we were unable to acquire this variable from LPS). We also include indicator variables for the maturity of the mortgage (15 and 20 years respectively), but do not display the results because for some of the quarters the indicators were dropped due to collinearity problems.
The results are very close to those obtained by PSV, with the minor differences likely attributable to the fact that we are using a 10 percent random sample, while PSV use the entire sample. PSV find seriously delinquent, portfolio-held loans have between 3.8
percent to 7 percent lower foreclosure rates in absolute terms and 18 percent to 32 percent lower rates (relative to the unconditional mean of the private-label foreclosure rate) than comparable private-label loans. We find that portfolio-held loans have between 2.8 percent to 11.1 percent lower foreclosure rates in absolute terms (17 percent to 45 percent lower relative to the unconditional mean of the private-label foreclosure rate).
Having established that we can closely replicate the main set of results from PSV’s paper, we now turn to a sensitivity analysis to determine how robust their findings are to slight variations of the covariates and to different subsamples. Table 3 contains the results of this robustness analysis. To simplify and shorten the exposition we pool all of the quarters (of origination) and include a full set of quarter of origination fixed effects.1
The first column of Table 3 contains results from the pooled PSV specification. According to the coefficient estimate associated with P ortf olio, portfolio-held loans are about 27 percent less likely to experience foreclosure than private-label loans (relative to the unconditional mean of the private-label foreclosure rate).
The first perturbation we make to the main PSV logistic specification is to replace the variable that measures the age of the loan at the time of first serious delinquency with a full set of quarter-of-delinquency dummy variables (this is the approach we take in AGW to account for the effect of loan age). This change allows the time between origination and serious delinquency to enter into the regression in a nonlinear manner, while the PSV specification constrains the time interval to enter into the regression in a linear manner. This slight change has a dramatic impact on the estimation results, as the coefficient estimate associated withP ortf oliois reduced by about 50 percent, from -0.064 to -0.032.2
To try to determine the reasons why this substitution of a full set of quarter-of-delinquency indicator variables for the linear age term has such a dramatic impact on the estimation results, we plot in Figure 1 the percentage of loans that are portfolio-held and the percentage of loans that eventually experience a foreclosure as a function of the age of the loan (in months) at
1
We prefer pooling all loan vintages and including quarter-of-origination fixed effects over estimating each vintage separately as PSV do for the following reason: Differences in the estimates for each quarter of origination are due to sampling variation, which is not necessarily important to the question at hand, unless one believes that there were substantial differences across vintages (by quarter) that could not be controlled for by a simple set of fixed effects. In other words, providing a range of point estimates as PSV do in their paper (18 percent to 32 percent) does not convey information about the precision of the estimates, but only about sample differences. So the top of the range, 32 percent, tells us that for one vintage quarter the point estimate of the difference in foreclosure rates is 32 percent, but this cannot be extrapolated to the entire sample. By pooling the vintages, we are able to obtain a point estimate that is the average across all vintages, and thus can be interpreted in the context of the full sample of LPS delinquent mortgages.
2
We also experimented with adding higher-order polynomial terms rather than the set of quarter dum-mies, and obtained very similar results. The results are also similar when we use a full set of interactions between quarter of delinquency and quarter of origination, as well as when we ran separate regressions for each quarter of origination.
the time of first serious delinquency. There are some notable patterns in the figure. First, the fraction of portfolio-held loans is sharply decreasing in age, initially from more than 70 percent when age of delinquency is three months to under 10 percent when age of delinquency is seven months, relatively constant from 7 months to 30 months, and then sharply increasing between 35 and 40 months, from about 10 percent to 30 percent. The reason for the high fraction of portfolio-held loans at very low age of delinquency values is likely because many of the loans are initially held on originators’ balance sheets in anticipation of being sold to the secondary market and subsequently securitized. The pattern for the percentage of loans held in portfolio changes again at the end of the age distribution — a much higher fraction of the loans originated in early 2005 that first became delinquent near the end of the sample were portfolio-held compared with the average fraction of portfolio-held loans across the age-of-delinquency distribution, and it is unclear what is driving this change. A second observation is that the fraction of seriously delinquent loans (of both types) that experience foreclosure by the end of the sample (2008:Q1) is negatively correlated with the fraction of portfolio-held loans at the very beginning and the very end of the age-of-delinquency distribution. The unconditional probability of foreclosure is initially increasing with age at the same time that the fraction of portfolio-held loans is decreasing in age from three to seven months. The fraction of loans that experience foreclosure is then monotonically decreasing in age at delinquency, likely because of right-censoring.3
This negative correlation between the fraction of portfolio-held loans and the fraction of loans that end up in foreclosure at the beginning and end of the age-of-delinquency distribution implies that controlling for the effect of age at delinquency in a purely linear manner will create a bias in the coefficient estimate ofP ortf olio. This is exactly what we see from the first two columns of Table 3.
Next, we control for additional mortgage characteristics in the PSV specification. These additional covariates include an indicator for whether a mortgage falls beneath the con-forming loan limits set by the GSEs4
, an interest-only indicator, a negative-amortization indicator, an indicator for whether the mortgage is characterized by a fixed interest rate period and then a variable rate period (Hybrid−ARM), an indicator for a B or C grade loan (commonly referred to as an alt-a and subprime mortgage, respectively), and a lin-ear and squared FICO term, which provides for a more flexible specification. Finally, we include an indicator variable for mortgages with loan-to-value ratios (LTVs) of exactly 80 percent.5
These additional covariates are included to control for observable differences in
3
The end of the sample is fixed at 2008:Q1, so there are likely many delinquent loans that will ultimately experience foreclosure, but that simply have not made it all of the way through the foreclosure process by the end of the sample period.
4
If the loan amount is above the conforming limit, the mortgage is not eligible to be directly purchased by the GSEs. The conforming limit was $359,650 in 2005 and $417,000 in 2006.
5
Table 3
Robustness Analysis of PSV Logit Specification
Full Sample Full Documentation Sample FICO≥680 FICO<680 FICO<620
Mean Portfolio Foreclosure (%) 18.2 18.2 18.2 12.3 18.3 21.9
Mean Private-Label Foreclosure (%) 24.1 24.1 24.1 20.5 22.6 22.2
(1) (2) (3) (4) (5) (6) Portfolio (d) -0.064*** -0.032*** -0.029*** -0.057** -0.023** -0.014 (-8.75) (-7.66) (-6.76) (-2.36) (-2.10) (-0.95) FICO<620 (d) -0.120*** -0.079*** -0.025*** (-9.55) (-8.96) (-4.10) 620≤FICO<680 (d) -0.022*** -0.021*** -0.004 (-3.48) (-4.78) (-0.78) LTV 1.381*** 0.799*** 0.520*** 1.33 0.441 0.355 -6.04 -5.34 -4.5 -1.09 -1.36 -0.94 LTV Squared -0.649*** -0.373*** -0.204*** -0.699 -0.101 -0.06 (-4.94) (-4.37) (-3.10) (-0.94) (-0.50) (-0.25) Origination Amount 0 0 0 0 0 0 -0.92 -0.98 -0.1 (-0.60) -0.02 (-0.36)
Origination Amount Squared 0 0 0 0 0 0
(-1.14) (-1.22) (-0.69) (-0.24) (-0.49) (-0.14) Original Interest Rate 0.017*** 0.010*** 0.014*** 0.027*** 0.018*** 0.014***
-6.02 -5.12 -6.45 -3.74 -4.9 -3.02 FIX (d) -0.069*** -0.042*** -0.014 -0.055** 0.174 (-8.94) (-8.34) (-1.60) (-2.01) -0.97 FICO 0.002*** 0.006 0 -0.002 -5.12 -0.43 (-0.04) (-0.42) FICO Squared -0.000*** 0 0 0 (-4.62) (-0.40) -0.53 -0.63 LTV = 80% (d) 0.029*** 0.087*** 0.051*** 0.032*** -8.73 -4.39 -6.23 -3.47 Jumbo (d) 0.009 0.052* 0.012 0.029 -1.02 -1.68 -0.61 -0.95 Interest-Only (d) 0.039*** 0.037** 0.063*** 0.058*** -6.52 -2.12 -5.75 -4.02 Negative Ammortization (d) 0.036*** 0.001 0.100*** 0.32 -2.64 -0.01 -5.93 -1.51 Hybrid-ARM (d) 0.022** -0.011 0.061*** 0.198 -2.29 (-0.34) -6.61 -1.62
B/C Grade Loans (Subprime) (d) -0.002 0.006 0.021* -0.018
(-0.81) -0.33 -1.74 (-0.75)
Age at Delinquency -0.018*** (-15.70)
Quarter of Delinquency Effects N Y Y Y Y Y
Quarter of Origination Effects Y Y Y Y Y Y
MSA Fixed Effects N N N N N N
Observations 52,506 52,506 52,506 2,112 15,353 10,579
We choose not to employ a full set of MSA fixed effects in order to speed up computational time. The pres-ence of MSA-fixed effects has virtually no effect on the estimates in Table 2. We estimated the specification in column (1) with MSA-fixed effects and also found no differences.
construct a measure of cumulative loan-to-value ratios. Many mortgage borrowers who made a downpayment of less than 20 percent used two separate loans, with the first having an LTV of 80 percent exactly, and the second having an LTV of up to 20 percent (the second loan is often referred to as a piggyback mortgage).
Figure 1. Illustration of the Bias Created by controlling for Loan Age Linearly
mortgage attributes that are likely to be correlated with default and foreclosure (the same set of covariates we use in AGW). Column (3) in Table 3 displays the estimation results when we include these controls with PSV’s covariates. The coefficient estimate associated withP ortf olioincreases slightly by approximately 10 percent (from -0.032 to -0.029), which implies that private-label loans are slightly riskier than portfolio loans.
Since the inclusion of the time of delinquency effects and the additional covariates does not decrease the sample size, we view these additions as an improvement over PSV’s specifi-cation. In addition, the results show that there is a significant downward bias created by the omission of these variables. According to the pooled PSV specification results in column (1), portfolio-held loans are approximately 27 percent less likely to experience a foreclo-sure (relative to the unconditional mean forecloforeclo-sure rate for private-label loans, which is 24 percent), while the results in column (3) show a difference of only 12 percent.
In the last three columns of Table 3 we focus on the sample of full documentation loans. These loans correspond to borrowers for whom the originating institutions collected extensive information regarding employment, income, and financial assets. PSV focus on the
We include an indicator for mortgages with LTVs of exactly 80 percent to proxy for the possibility that the combined LTV is higher.
subsample of full documentation loans for which the borrowers’ FICO scores at origination were at least 680. They focus on this particular group of full documentation loans for at least two reasons. First, they want to address the concern that the difference in foreclosure rates they find between private-label and portfolio-held loans could be driven entirely by private information that lenders collect at the time of origination when they screen the loans. In particular, PSV are concerned that lenders choose to securitize loans that are worse on unobservable information, and keep loans that are better in their own portfolio.6
If this is the case, then it could explain why portfolio-held loans foreclose at a lower rate. Thus, PSV focus on loans with relatively high credit scores (FICO≥680), based on the theory that lenders are likely to screen these loans less than loans with lower credit scores and less documentation. The argument they use is that the combination of full documentation and high initial credit score is a sufficient statistic for the credit worthiness of the borrower, and thus the lenders do not need to collect private information. As a result, adverse selection in the form of lenders choosing to sell loans that they know to be worse credit risks but that the issuers of MBS do not, should not be as great a problem. Second, PSV argue that based on moral hazard arguments in the literature, servicers have an incentive to renegotiate more with high credit worthy borrowers.7
Column (4) in Table 3 confirms PSV’s findings of a relatively large difference in foreclo-sure rates for the sample of high FICO (≥680) and full documentation loans. Portfolio-held loans are about 28 percent less likely than private-label loans to experience foreclosure, rela-tive to the unconditional mean of the private-label foreclosure rate in this sample. However, the high-FICO sample of full documentation loans is the only sample that delivers large differences in foreclosure rates. Column (5) shows that when we look at the sample of full documentation loans with FICO scores below 680, the estimated difference in foreclosure rates decreases substantially (10 percent relative to the private-label mean). If we limit the sample to loans with FICO scores below 620, which is the sample of loans that Keys et al. (2008) claim suffers most from the adverse selection and private information issues described above, then the difference in foreclosure rates is no longer statistically significantly different from zero. This is an important finding, because based on the logic of PSV described above, we should expect to find larger differences in foreclosure rates for these low credit score samples, not smaller ones.8
The expectation of finding large differences in foreclosure rates was PSV’s justification for ignoring this sample and focusing on the high FICO sample, but it turns out that we do not find large differences, and we argue that this invalidates such
6
Keys et al. (2008) find evidence of such behavior using the same LPS dataset.
7
PSV cite Bolton and Rosenthal (2002) and Piskorski and Tchkivski (2008) for this argument.
8
In fact, when we look at low FICO score and low documentation and zero documentation loans, we also find small differences in foreclosure rates.
a justification. Thus, at least on the surface, it appears as though PSV have developed a theory to justify focusing on the one subsample in the LPS dataset that contains large differences in foreclosure rates.
We also find no support for the second argument given by PSV for focusing on the sample of high FICO mortgages. Using our method in AGW to identify modified mortgages, we find that only 6 percent of seriously delinquent loans originated after 2005:Q1 with FICO scores above 680 were modified, while 18 percent of seriously delinquent low FICO mortgages (FICO< 620) were modified. We agree that moral hazard issues are important in the servicer’s decision to renegotiate a mortgage, but it does not appear to create an incentive to modify loans of high credit score borrowers over those with low credit scores.
3. Early-Payment Default as an Instrument for
Mort-gage Securitization
The study of the impact of securitization on the outcomes for borrowers inevitably runs into the problem of omitted variables bias — even when observables are taken into account, it is possible that the performance of mortgages is affected by unobserved factors that are correlated with both mortgage outcomes and the probability that a loan is securitized. PSV have developed a strategy to deal with this issue that involves using Early Payment Defaults as an instrument for whether a loan remains in a securitization trust (and is serviced as a securitized loan) or gets transferred to the originator’s balance sheet and is serviced as a portfolio loan. Early Payment Default (EPD) clauses are part of the contractual set-up of some securitization trusts and usually require the originator to buy back mortgages that become delinquent shortly after being securitized.
The empirical strategy of PSV is to compare loans that become delinquent in the third month after securitization and get bought back by the originators to loans that become delinquent in the fourth month after securitization and remain securitized (because the EPD and repurchase clauses no longer apply to the “late defaulters”).9
The advantage of this strategy is that one can reasonably argue that the fact that a loan becomes delinquent in the third versus the fourth month is random. PSV then draw the conclusion that the securitization status of these loans is “as if” randomly assigned. There are, however, several issues that make it impossible to use EPD as a valid instrument for the securitization status
9
The discussion here relates to the January 2010 version of the PSV paper and the presentation by one of the authors of those results at a Harvard University Labor Economics Workshop in March 2010. In the September 2009 version that is available on SSRN (http://papers.ssrn.com/sol3/papers.cf m?abstractid=
of a mortgage, and we discuss these problems in detail below.
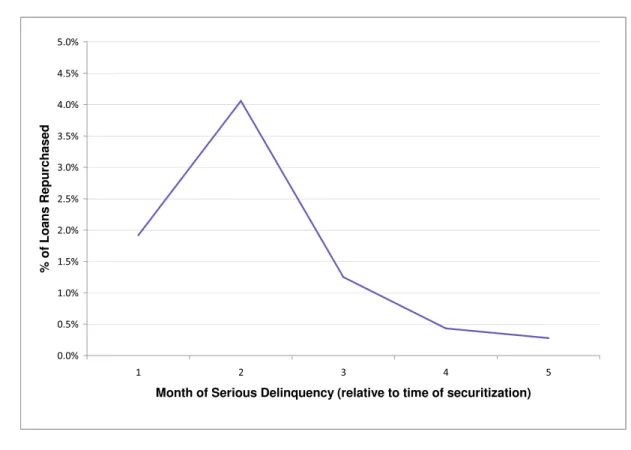
The first problem with using EPD as an instrument for securitization is that it is only very weakly correlated with securitization. As PSV acknowledge, the percentage of delin-quent loans that are immediately sold back to the originator after delinquency is very low. We confirm that result for the first five months after securitization. Using the sample of loans that are securitized and default in the first months after securitization, only 1.3 percent of the loans that become delinquent in the third month after origination are actually bought back by the originators (the authors find that 3 percent of the loans are bought back). This compares with around 0.4 percent for loans that become delinquent in month four (or 1.5 percent in PSV). Figure 2 below shows the percentage of loans that are bought back as a function of the moment they become delinquent (number of months after securitization takes place).10
Figure 2. Early Payment Default Repurchases
10
One way to assess the importance of the 90-day cutoff rule that PSV stress is to look at whether there is a discontinuity in the number of delinquent loans that are transferred from private securitization trusts to the originators’ portfolios at three months. This cannot be tested rigorously, but according to the figure, the raw percentage of loans that are “put back” seems to decrease smoothly as a function of the time of the first delinquency from about 4 percent in month two, to 1.3 percent in month three, to 0.4 percent in month four.
Perhaps an even more significant problem for the EPD experiment is the assumption that repurchased loans are serviced in the same manner as normal portfolio loans. PSV state “Once a loan has been sold back, the originators service these loans as any other loan on their balance sheets,” but they do not provide any concrete evidence that this is the case. In fact, a deeper look at the LPS data tells us that this is not the case. Just three months after being bought back by the originators, approximately 9 percent of the loans that are repurchased in month three are back in a securitization trust, and six months later this percentage is 25 percent. This is actually a fairly well-known phenomenon, often referred to as the Scratch & Dent (S&D) market. According to a Mortgage Banker’s article, the S&D market buys repurchased loans that originators do not want to keep on their balance sheets:
With nonperforming loans—those 60 days late on payment—investors are push-ing back on the originators to keep those loans or take them back. In turn, originators are trying to get rid of them any way they can-so they are selling them to the S&D people at 30 and 40 cents on the dollar. But the buyers want to keep them and reform the loan, if possible (James Dowell, Mortgage Banking, September 17, 2007).
The third (and most important) problem with the approach used in PSV is that the authors do not use EPD as an instrument. Instead, PSV create and compare two samples of loans: those that default in month three and are repurchased and those that default in month four and remain securitized. This strategy suffers from severe selection bias. For this approach to be valid, it is necessary that the subset of loans that are repurchased be a random subset of all loans that default. At least two facts suggest that this is not the case. First, the securitization trusts that include EPD clauses in their contracts are unlikely to be a random subset of all securitization trusts. Second, the share of loans that are actually bought back is a small (highly selected) percentage of even the trusts that have EPD clauses (PSV, suggest that 10 percent of all trusts have such clauses, yet they observe only 3 percent of delinquent loans being bought back, and using our sample we observe only around 1.3 percent of delinquent loans actually being transferred out of the pool in the month following early delinquency).
Importantly, the selection problem that arises from only a small fraction of loans being bought back cannot be overcome by showing that the loans that are repurchased and the ones that aren’t have similar observable characteristics. First, it is possible that the loans that are bought back have quite distinct unobservable characteristics. In particular, if the servicer knows that some loans are of better quality (and this is unknown to the econometrician), this could drive both the repurchase decision and the fact that the loans are foreclosed on
at a lower rate. This would lead to the mistaken conclusion that the securitization status determines the outcomes of delinquent loans. The second potential source of selection bias is even harder to deal with, and that has to do with the types of servicers that choose to buy the loans back. Given that only a small fraction of loans are bought back after early default, it is likely that only a few servicers are involved in these repurchases. This would then imply that what seems like the effect of a loan being on a bank’s portfolio is, in fact, the result of some special subset of servicers behaving differently compared to the universe of servicers.
The correct way to use EPD as an identification strategy is to use it in an instrumental variables (IV) setup, for example, two-stage least squares. In the first stage, EPD can be used as an instrument for whether the loan is securitized or not, and in the second stage the instrumented securitization dummy can be used as an independent variable in a regression that predicts foreclosure sale. The problem with this approach is that the EPD instrument is too weak. This is visible from the above figure. The first stage of an IV procedure will predict whether a loan is securitized or not, based on 1.3 percent of loans that are bought back in month three versus 0.4 percent in month four (or 3 percent versus 1.5 percent according to PSV). This produces very low F statistics in a first stage regression, below the commonly accepted threshold of 10 (for example, Nichols, 2006). The standard errors of the second stage (even in the univariate case) are very large and the point estimate for the coefficient on the securitization dummy variable is not meaningful.
The fourth and last issue we point out regarding the use of EPD as a quasi-experiment for the securitization status of a loan is that some characteristics of the data used for this exercise (the LPS dataset) make it very hard to carry out the analysis in a rigorous manner. The problem here is that the definition of the moment of securitization is not clear in the LPS data. The strategy used by PSV selects mortgages based on the number of months that elapse between the moment of securitization and that of delinquency. The LPS dataset does not, however, track loans from the moment of origination. While the authors exclude mortgages that enter the dataset more than four months after origination, there is still significant variation in the moment that the loan first appears in the data. If we look at the sample of loans that become 60 days delinquent at some point during their lifetime, only about 7 percent are in the data from origination, 33 percent enter one month later and the remaining 60 percent enter the data between two and four months after origination. While this is, in general, not a significant problem for studies that use this dataset, it is of central importance when one tries to determine the precise moment of securitization. A loan may have been in a private trust for up to four months before we see it in the data and that introduces measurement error and potentially biases the estimates of the effect of
securitization if servicers systematically differ in the moment they start reporting to LPS.11
To summarize, there are numerous problems in using EPD properly in a two-stage, IV setup. The most important problem is the fact that many loans that are repurchased end up back in securitization trusts within a short time horizon, but we also point out the weak correlation of EPD with securitization and the noisy measurement of the moment of securitization. Additionally, PSV do not use an instrumental variables specification, and thus the authors’ analysis also suffers from important selection issues.
4. Alternative Measures of Mortgage Renegotiation
PSV interpret their empirical results as evidence that servicers of private-label loans rene-gotiate with borrowers less frequently than servicers of portfolio-held loans because of some type of friction present in the structure of securitization trusts. They propose a number of potential frictions, including limits on loan modifications in the Pooling and Service Agree-ments (PSAs) that govern the relationship between the servicers of private-label loans and the MBS investors, misaligned servicer incentives, and even what has been referred to as “tranche warfare”, where investors in one segment of a securitization deal have financial incentives to hold up the process of renegotiation at the expense of investors in other seg-ments. While we agree that this could be one explanation for differences in foreclosure rates (if they exist), we do not believe that it is the only viable explanation. Besides the issues of unobserved heterogeneity and servicer selection that we discussed above, there could also be differences in the accounting procedures for portfolio-held loans and securitized mortgages that may impact the duration of the foreclosure process for each type of loan. There is at least anecdotal evidence that suggests that banks may be dragging out the foreclosure process in an effort to hide losses and delay writing down the value of delinquent mortgages on their balance sheets. For example, in an August 2009 article in American Banker, Dar-rell Duffie states, “Banks are believed to be carrying a lot of loans at accounting levels well above their true market value... But once a property goes into foreclosure, their options have disappeared.” If banks are increasing foreclosure time-lines in an effort to delay taking
11
The difficulty in determining the moment of securitization also makes it very hard to replicate the results reported by PSV. There are several decisions to be made as to how one constructs the sample and the authors are not clear about these. It is, for example, unclear what one should assume about the months when a loan is not in the data. In doing this exercise, we chose to count the first month of securitization only from the first observation where the loan appears as securitized. Another alternative is to use loans that first appear as portfolio loans and then become securitized, but this reduces the sample dramatically. Other questions include whether one should include re-securitizations and whether we should consider the delinquency history before the loan is securitized when constructing the sample (that is, should loans that default before they are securitized also be included).
write-downs, then it certainly could explain the small differences in foreclosure rates that we see in the LPS dataset.
In Adelino, Gerardi, and Willen (2009) we attempted to directly test the interpretation put forth by PSV by directly identifying the renegotiation decisions of both portfolio and private-label mortgage servicers. In AGW we developed a simple algorithm to identify in-stances of permanent loan modifications in the LPS data, and then compared modification rates across private-label and portfolio loans. We found negligible differences (not statisti-cally significant from zero), and we interpret this finding as evidence against PSV’s inter-pretation that differences in foreclosure rates are the result of frictions in the securitization
process that inhibits renegotiation.12
In addition, as both a robustness check of our modification algorithm and an alternative to PSV’s foreclosure rate regressions, we compared differences in mortgage “cure” rates, where we define a “cure” as an instance in which a seriously delinquent borrower catches up and becomes current on his or her mortgage. In our view, this is a superior test of renegotiation differences, as any appreciable difference in servicer renegotiation behavior will manifest itself in differences in cure rates, while accounting differences that create differences in foreclosure time-lines will not. We found very small (and for the most part not statistically different from zero) differences in cure rates between private-label and portfolio-held loans. This finding combined with our findings from the modification rate comparison leads us to conclude that differences in foreclosure rates are not the result of differences in rates of renegotiation.
5. Conclusion
In this note we have discussed the seeming lack of robustness of the PSV foreclosure rate results and the limits of their “quasi” experiment that uses early-payment defaults in an attempt to solve identification issues associated with the securitization decision. In addi-tion, we have discussed results from our own work that we believe sheds serious doubt on the interpretation given by PSV that differences in foreclosure rates between portfolio-held and private-label mortgages are driven by differences in the extent of renegotiation between mortgage borrowers and the servicers of each type of loan, respectively.
12
We also compared redefault rates of portfolio-held and private-label loans in order to test whether there are differences in the type or quality of modifications. We find no substantive differences.
6. References
Adelino, M., Gerardi, K., P. Willen, 2009. “Why Don’t Lenders Renegotiate More Home Mortgages? Redefaults, Self-Cures and Securitization,” FRB Atlanta Working Paper 2009-17.
Bolton, P., H. Rosenthal, 2002. “Political Intervention in Debt Contracts,” Journal of Political Economy 110(5).
Dowell, J. “Servicing Scratch-and-Dent Loans Presents Special Challenges” Mortgage Bank-ing September 2007.
Keys, B., Mukherjee, T., Seru, A., Vig, V., 2008. “Securitization and Screening: Evidence From Subprime Mortgage Backed Securities,” Quarterly Journal of Economics 125(1). Nichols, A. (2006). “Weak instruments: An Overview and New Techniques” Stata 5th North American Meeting Presentation.
Piskorski, T., A. Tchistyi (2008). “Stochastic House Appreciation and Optimal Mortgage Lending.” Working Paper, Columbia Business School and UC Berkeley Haas School of Busi-ness
Piskorski, T., A. Seru, and V. Vig (2010). “Securitization and distressed loan renegotiation: Evidence from the subprime mortgage crisis.” Working Paper, Chicago Booth School of Business and Columbia Business School