https://doi.org/10.30560/jems.v2n2p33
Comparative Analysis of Banking System Profitability in Western
Balkan Countries
Qazim Tmava1, Fahredin Berisha2 & Milaim Mehmeti3
1 Professor assistant at Faculty of Economics, University of Mitrovica “Isa Boletini”, Kosovo 2 Lecturer at FAMA Coledge, Prishtina, Kosovo
3 Assistant at Faculty of Economics, University of Mitrovica “Isa Boletini”, Kosovo
Correspondence: Qazim Tmava, Professor assistant at Faculty of Economics, University of Mitrovica “Isa Boletini”, Kosovo. Tel: 383-4420-0021. E-mail: [email protected], [email protected]
Received: April 26, 2019; Accepted: May 13, 2019; Published: June 1, 2019
Abstract
The aim of this paper is to analyze the profitability of the banking sector in the Western Balkan countries. (Note 1) This paper reviews return on assets (ROA) as an indicator of profit and return on equity (ROE) as an indicator of profitability in the banking systems of the respective countries, as well as some other macroeconomic variables that influence them. The main objective of this study is to identify the specific and macroeconomic variables of this industry, that have an impact on the profitability of commercial banks operating in the Western Balkan countries during the 2008-2015 period. Specifically, this paper addresses external indicators (gross domestic product, remittances, foreign direct investment, unemployment), and industry and bank specific indicators (assets, loans, loan-to-deposit ratio, non performing loans and interest rates) that affect the profitability of the banking system in respective countries.
Therefore, according to the data generated during the research and the literature review, the profitability of banks measured by the ROA and ROE indicators, regarding the analyzed countries, turns out to be extremely low, especially compared to EU countries where they strive.
Keywords: Western Balkan, banking sector, profitability, ROA, ROE
1. Introduction
Financial sector is vital to the economy of any country, with banks comprising most of the sector, especially in developing countries, where the capital market is not strong enough (Matthew & Laryea, 2012). During their operation as intermediary institutions, banks enable the transfer of financial assets from surplus units to deficit ones. Through this process they generate profit. Hereinafter, the paper focuses on the profitability of the banking sector in the Western Balkan countries, as well as the indicators that affect it during the 2008-2015 period. All these countries have undergone a transformation process from a centrally planned economy to an open market economy. All of them, apart from Albania, are from ex-Yugoslavia and have experienced a very painful process of separation with plenty of serious consequences. Today, all these countries aspire to join the EU and are at different stages of the accession process. Financial systems of all these countries are dominated by commercial banks so it can be concluded that these countries have banking-based (bank centric) financial systems. This further highlights the importance of addressing the profitability of the banking system in these countries. The purpose of the paper is to identify and analyze the various indicators that impact the profitability of the banking sector in the six Western Balkan countries.
Indicators of profitability have been debated for years in different countries and still there are no universally accepted findings for these variables. This is due to the fact that countries have different economic, political, financial, as well as business environments.
Flamini et al. (2009) states that profitability indicators are dynamic from time to time and vary due to the firm's nature of operation from one country to another.
According to Lartey (2013), profitability represents the ability of the bank to generate more revenue in relation to the level of expenditure, with capital as its base.
According to Yuksel et al. (2018) bank's profitability represents the difference between the amount earned from business activities and the liabilities from expenses.
Whereas, Herrero et al. (2009) approaches the banks' profitability through business success, management quality and bank strategy, as well as the efficiency and risk management capacity. While, Caruntu and Romanescu (2008), defines profitability as a modality to implement the main organizational goal, ie the maximization of profit. Devinaga Rasiah (2010) (according to Gremi, 2013) states that in order to understand how well a bank is doing financially, it is very important to consider two indicators: return on assets (ROA) and return on equity (ROE); Hereinafter, the profitability of the banking sector in the respective countries mentioned above will be addressed through the two traditional indicators, namely: ROA and ROE.
Return on Assets (ROA), is calculated as follows: ROA = x 100
This indicator according to Rose and Hudgins (2015) represents the efficiency of the management to transform assets to net profit. Whereas, according to Gremi (2013), return on assets (ROA) is the ratio of net income after-tax to total assets. On the other hand, return on equity (ROE) is calculated through the formula:
ROE = x 100
This indicator, according to Rose and Hudgins, (2012), represents the benefits that the shareholders receive from the invested capital in the bank. This is treated through the shareholders rate of return. Whereas, according to Kalluci (2011) the return on equity (ROE), represents the profit gained over a period of time, from the shareholders' perspective.
This paper will initially analyze the external macroeconomic factors that determine the profitability of the banking system, related to the structure and the environment of the industry: GDP growth (GDP, GDP per capita), foreign direct investment, remittances, inflation and interest rates. While, within the framework of internal factors, variables specific to each bank will be analyzed: non-performing loans, deposits, loan-deposit ratio.
Due to the nature of the work, the most accessible sources, have been data from secondary sources (e.g. monetary authorities of respective countries, statistical agencies of respective countries, IMF and the World Bank). These data are harmonized with the data of the banking authorities in each country.
2. Literature Review
Today, there are plenty of studies regarding the indicators that impact the profitability of banks, not only in developed countries, but also in developing ones.
Regarding the profitability of banks, many empirical studies have been conducted, both for a specific country and for a group of countries, region.
Thus, in the context of studies conducted for a particular country, we can mention: in the USA (Berger, 1995, Angbazo, 1997), Greece (Kosmidou, 2006), UK (Saeed, 2014), in Switzerland (Dietrich and in Wanzenried, 2010), Spain (Trujillo-Ponce, 2012), Turkey (Atasoy, 2007) in Pakistan (Javaid et al., 2011), Japan (Lui and Wilson, 2010), Korea (Sufian, 2011), Macedonia (Curak et al., 2011), in Albania (Duraj & Moci, 2015) etc.
Meanwhile, many studies on banking profitability for a group of states were conducted by: Molyneux and Thorton (1992), Demirguc-Kunt and Huizinga (2001), then Abreu, Mendez (2001), Hassan and Bashir (2003) Goddard et al. (2004), Kosak and Zajc (2006), Athanasoglou, Delis and Stakouras (2006), Bolt et al. (2012), Curak et al. (2011) and so on.
Nevertheless, all conducted studies (whether for a particular country or group of countries), when considering the indicators that affect banks' profitability, they divide them into two large groups: internal indicators (microeconomic and specific to banks) and external indicators (macroeconomic and specific to industry). Therefore, in the academic literature, currently, the banking system's profitability is represented as a function of internal and external factors.
Thus, Anbar and Alper (2011) point out that internal factors are related to bank management decisions, while external factors reflect the economic and legal environment affecting banks' operations and performance. Internal indicators (micro variables) are generated from financial statements (balance sheet and income statement), the reason as why they are also referred to as bank specific variables. While external indicators (macro variables) have nothing to do with internal bank processes but significantly affect its profitability.
According to Gungor (2007), the micro variables include bank size, capital, risk management, expenditure management, securities and non-performing loans, while the macro variables include inflation rate, interest rate, GDP growth, and the rate of taxation.
Molyneux and Thorton (1992) were among the first to analyze the banks' profitability in 18 European countries for the 1986-1989 period. During their analysis, they found a positive correlation between return on equity (ROE) and interest rates in each country.
Similarly, Bourke (1989) was amongst the first to study the impact of internal indicators in banking performance: net income before and after taxation compared to total assets, as well as indicators of capital and bank reserves, which have a high impact on profitability indicators.
Subsequently, Demirgüç-Kunt and Huizinga (1999) analyzed the banking sector in 80 different countries, using regression analysis. These authors find a positive correlation between the inflation rate and the bank's profitability. Kosak and Zajc (2006) evaluate the determinants of efficiency in the new EU member states. They find that ROA and ROE have a positive relationship with the efficiency
On the other hand, Saeed (2014), while analyzing banks in UK concludes that the inflation rate negatively impacts the bank's profitability.
Ramlall (2009) and Sufian (2009) find a positive relationship between bank size and profitability. The larger the bank, the greater its profitability and vice versa. This in fact illustrates an example of economies of scale. Contrary, Hannan and Prager (2009), Kosmidou (2008) and Luo (2003) argue that large banks and profitability have a negative relationship and that small banks can generate more profits because they have lower spending and more efficient performance.Deietrich and Wanzenreid (2010) study the main determinants of profitability for the Swiss banking industry. In their empirical study, they used data from 453 banks, for the observation period 1999-2008. Generated results show that well-capitalized banks are more profitable. Whereas, Curak et al. (2011) applying the Dynamic Panel Analysis method in 16 banks from the Macedonian banking system, in the 2005-2010 period, examines the internal as well as external indicators that influence the banking profitability in this country. The following section analyzes the macroeconomic and microeconomic factors that affect the performance of banking systems in the Western Balkan countries in the 2008-2015 period.
3. Macroeconomic Factors
The macroeconomic indicators that will be examined are GDP, inflation, unemployment remittances and FDI, for the 2008-2015 period, on each respective country. The following section reviews the annual increase of GDP (%) in Western Balkan countries during the 2008-2015 period.
3.1 GDP (annual, %)
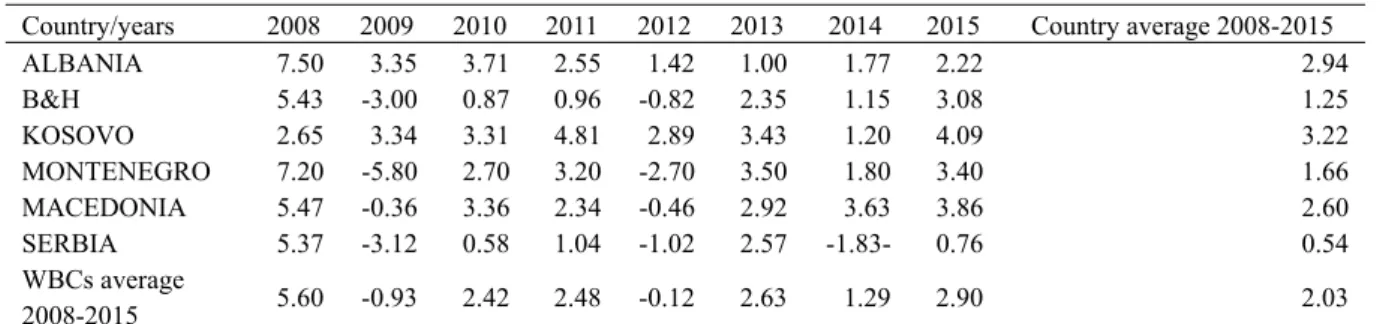
This section presents the GDP increase, in Western Balkan Countries, Table 1. GDP Increase (annual, %) in WB countries, during 2008-2015 period
Country/years 2008 2009 2010 2011 2012 2013 2014 2015 Country average 2008-2015
ALBANIA 7.50 3.35 3.71 2.55 1.42 1.00 1.77 2.22 2.94 B&H 5.43 -3.00 0.87 0.96 -0.82 2.35 1.15 3.08 1.25 KOSOVO 2.65 3.34 3.31 4.81 2.89 3.43 1.20 4.09 3.22 MONTENEGRO 7.20 -5.80 2.70 3.20 -2.70 3.50 1.80 3.40 1.66 MACEDONIA 5.47 -0.36 3.36 2.34 -0.46 2.92 3.63 3.86 2.60 SERBIA 5.37 -3.12 0.58 1.04 -1.02 2.57 -1.83- 0.76 0.54 WBCs average 2008-2015 5.60 -0.93 2.42 2.48 -0.12 2.63 1.29 2.90 2.03
Source: World Bank Group. Author’s calculation.
From the above data, we can conclude that the GDP in WB countries for the analyzed period has shown different trends. At the peak of the GFC (global financial crisis), in 2009, only Albania and Kosovo have shown growth of 3.35% and 3.34% respectively. On the other hand, the other WB countries have shown a decline on GDP in comparison to the previous years. The average GDP growth for the countries analyzed in 2009 was negative ie (0.9%). There is a similar situation in 2012 as well. On average, for the analyzed 2008-2015 period, Kosovo has shown the highest GDP growth with 3.22%, followed by Albania with 2.94% and Macedonia by 2.6%. The lowest
GDP growth for the analyzed period is experienced by Montenegro with 1.66%, B and H with 1.25% and Serbia with only 0.54%.
3.2 Inflation
The following section analyzes the inflation rate in WB countries, throughout the years.
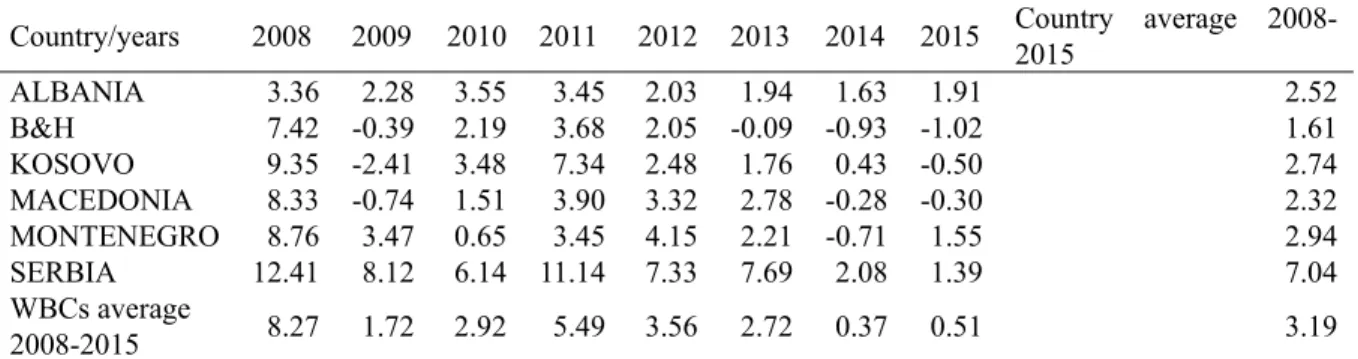
Table 2. Inflation according to consumption prices, in WB countries, during the 2008 – 2015 period
Country/years 2008 2009 2010 2011 2012 2013 2014 2015 Country average 2008-2015
ALBANIA 3.36 2.28 3.55 3.45 2.03 1.94 1.63 1.91 2.52 B&H 7.42 -0.39 2.19 3.68 2.05 -0.09 -0.93 -1.02 1.61 KOSOVO 9.35 -2.41 3.48 7.34 2.48 1.76 0.43 -0.50 2.74 MACEDONIA 8.33 -0.74 1.51 3.90 3.32 2.78 -0.28 -0.30 2.32 MONTENEGRO 8.76 3.47 0.65 3.45 4.15 2.21 -0.71 1.55 2.94 SERBIA 12.41 8.12 6.14 11.14 7.33 7.69 2.08 1.39 7.04 WBCs average 2008-2015 8.27 1.72 2.92 5.49 3.56 2.72 0.37 0.51 3.19
Source: World Bank Group. Author’s calculation.
From the above calculations it can be concluded that inflation in WB countries, for the analyzed period of 2008-2015, in the beginning of GFC (global financial crisis 2008) reflects a relatively high inflation rate which varied from 3.36% in Albania and 12.41% in Serbia. The average inflation rate during this year, for all Western Balkan Countries was 8.27%. Nevertheless, throughout the years, inflation experienced low rates and on certain cases was even followed with deflation, as was the case with Kosovo (2.41%), Macedonia (0.74%) and BiH (0.39%). The trend of low inflation continued until 2015, where the average inflation rate for all WB countries was only 0.51%. Otherwise, for the entire examined period, the highest inflation rate resulted in Serbia with 7.04%, Montenegro with 2.94 %, Albania with 2.52%, Kosovo with 2.74% and Macedonia with 2.32%. The lowest inflation rate was in B&H with only 1.61% for the entire period which in fact is 1.48% lower than the average inflation rate of the entire region.
3.3 Unemployment
Unemployment is a major problem in all WB countries, especially, in Kosovo (2015: 32.9%), Macedonia (2015: 26.1%) and B &H (2015: 27.6%). This section presents the unemployment rate in these countries.
Table 3. Total unemployment (% of total labour force), during the 2008 - 2015 period
Country/years 2008 2009 2010 2011 2012 2013 2014 2015 Country average 2008-2015 ALBANIA 13.00 13.80 14.20 14.00 13.90 16.00 17.50 17.10 14.94 B&H 23.90 24.10 27.20 27.60 28.10 28.40 27.50 27.60 26.80 KOSOVO 47.50 45.40 n/a n/a 30.90 30.00 35.10 32.90 36.97 MACEDONIA 33.80 32.20 32.00 31.40 31.00 29.00 28.00 26.10 30.44 MONTENEGRO 16.80 19.10 19.70 19.70 19.60 19.80 18.00 17.50 18.78 SERBIA 13.60 16.60 19.20 23.00 23.90 22.20 19.20 17.90 19.45 WBCs average
2008-2015 24.77 25.20 22.46 23.14 24.57 24.23 24.22 23.18 24.56 Source: World Bank Group. Author’s calculation
From the above data it can be concluded that the unemployment rate in the Western Balkan countries for the analyzed period was extremely high. For the entire comparative period all WB countries reached double-digit values in unemployment rate. The highest unemployment rate, permanently over the years, appears to be in Kosovo, which for the analyzed period varies between 47.5% in 2008 and 30.0% in 2013. The average unemployment rate for the entire analyzed period is 36.97%. It is worth mentioning that for Kosovo, during 2010 and 2011, there are no official data on the unemployment rate in the annual reports of KAS (Kosovo Agency of Statistics). A high
unemployment rate is also present in Macedonia, which varies between 33.80% in 2008 and 26.10% in 2015. The average unemployment rate for this country for the analyzed period is 30.44%. Subsequently, another high unemployment rate is reflected in BiH, which for the analyzed period varies between 28.4% in 2013 and 24.10% in 2010. The average period for this country was at a rate of 26.80%, which was 2.24% above the average of the unemployment rate for all WB countries. In Serbia, the unemployment rate varies between 13.60% in 2008 and 23.90% in 2013. The average unemployment rate for the analyzed period was 19.45%, which is 5.11% lower than the average for all WB countries. Montenegro also experienced a relatively high unemployment rate which varied between 16.8% in 2008 and 19.80% in 2013. The average rate for this country during the analyzed period was 18.78%, which was 5.78% lower than the average for all WB countries. Lower unemployment rates, compared with other WB countries, were experienced in Albania, varying between 13.00% in 2008 and 17.5% in 2014. The average unemployment rate for this country was 14.94%, which in fact was 9.52% lower than the average unemployment rate for the entire comparative period for all other WB countries.
3.4 Remittances
Remittances as an indicator are unique in the way they impact the economies of the WB countries. Remittances in all WB countries are mainly used for consumption and less for investment. On average, for the analyzed countries, the highest level of remittances is injected into the economy through unofficial channels. The level of remittances injected into the economy through official channels of WB countries (as% of GDP), is presented below:
Table 4. Remittances in the Western Balkan countries, (as % of GDP), during the 2008-2015 period
Country/years 2008 2009 2010 2011 2012 2013 2014 2015 Country average 2008-2015
ALBANIA 14.49 14.26 13.34 12.04 11.53 8.56 8.64 9.19 11.51 B&H 14.23 12.08 10.62 10.51 10.73 10.79 11.38 11.14 11.44 KOSOVO 18.33 18.66 17.27 14.93 14.61 14.97 14.87 15.08 16.09 MACEDONIA 6.60 7.31 8.10 8.85 9.73 9.48 9.40 9.48 8.62 MONTENEGRO 4.10 4.05 4.12 4.14 4.04 3.48 3.23 3.05 3.78 SERBIA 7.20 10.91 10.43 8.52 8.71 8.84 8.36 9.07 9.01 WBCs average 2008-2015 10.83 11.21 10.65 9.83 9.89 9.35 9.31 9.50 10.07
Source: World Bank Group. Author’s calculation
From the above data, it can be noted that the largest percentage of remittance growth over the years, in report to GDP, is reflected in Kosovo with an average growth of 16.09%, closely followed by Albania with 11.54%, and B and H with 11.51%. On the other hand, countries experiencing a single digit remittances growth, for the comparative period, were Serbia with an average of 9.01% and Macedonia with an average of 8.62%. A low remittance growth in report to GDP is reflected in Montenegro with an average of only 3.78% for the entire comparative period.
3.5 Foreign Direct Investment (FDI) Net Inflows (% of GDP) FDI as percentage of GDP are presented in the following table: Table 5. Foreign Direct Investment (FDI) net inflows (as % of GDP)
Country/years 2008 2009 2010 2011 2012 2013 2014 2015 County average 2008-2015
ALBANIA 9.73 11.16 9.14 8.13 7.45 9.82 8.69 8.69 9.10 B&H 5.26 0.79 2.58 2.53 2.27 1.72 2.94 2.36 2.56 KOSOVO 9.44 7.13 8.41 7.99 4.51 5.24 2.71 5.33 6.35 MACEDONIA 21.45 37.25 18.32 12.26 15.13 10.00 10.83 17.26 17.81 MONTENEGRO 6.17 2.76 3.20 4.84 3.47 3.72 0.54 2.95 3.46 SERBIA 8.23 6.87 4.29 10.61 3.13 4.53 4.52 6.31 6.06 WBCs average 2008-2015 10.05 10.99 7.66 7.73 5.99 5.84 5.04 7.15 7.56
From the table above data it can be concluded that FDI reflect diversity in Western Balkan countries. The largest average FDI inflow (as% of GDP) is reflected in Macedonia at a rate of 17.81% for the entire comparative period 2008-2015, which is 9.25% above the average of the respective countries in the comparative period. This is followed by Albania, with an average FDI inflow for the entire comparative period at 9.10%, which is 1.54% higher than the average of the respective countries for the 2008-2015 period.
Kosovo and Serbia have roughly the same average growth over the entire comparative period, at a rate of 6.35% and 6.06% respectively, which is 1.2% and 1.5% lower than the average for all WB countries.
The lowest average growth in FDI inflow for the whole period is reflected in Montenegro with a growth rate of 3.46% and B&H with only 2.56% average growth over the entire comparative period 2008-2015.
4. Industry Specific Factors
4.1 Banking System Assets
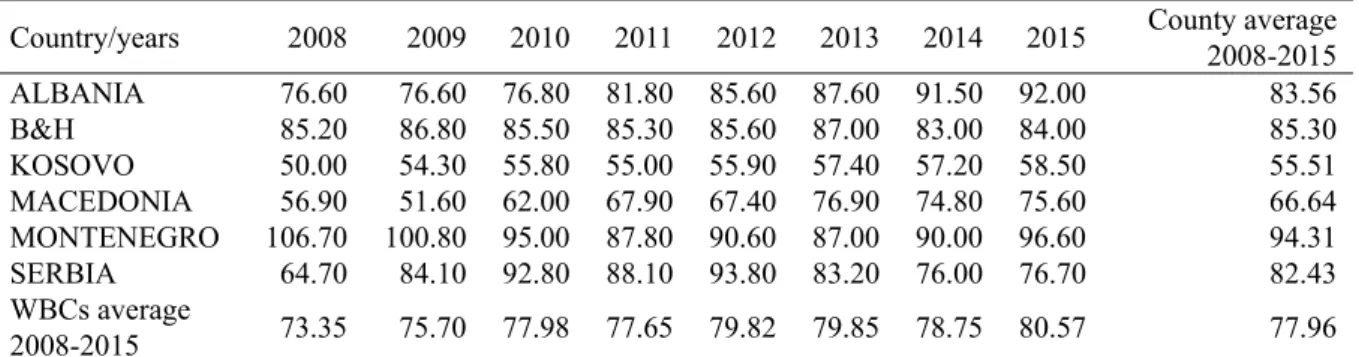
The participation of banking system assets in GDP in WB countries (in %) is presented in the table below: Table 6. Participation of assets in GDP, in WB countries, as %, during the 2008-2015 period
Country/years 2008 2009 2010 2011 2012 2013 2014 2015 County average 2008-2015 ALBANIA 76.60 76.60 76.80 81.80 85.60 87.60 91.50 92.00 83.56 B&H 85.20 86.80 85.50 85.30 85.60 87.00 83.00 84.00 85.30 KOSOVO 50.00 54.30 55.80 55.00 55.90 57.40 57.20 58.50 55.51 MACEDONIA 56.90 51.60 62.00 67.90 67.40 76.90 74.80 75.60 66.64 MONTENEGRO 106.70 100.80 95.00 87.80 90.60 87.00 90.00 96.60 94.31 SERBIA 64.70 84.10 92.80 88.10 93.80 83.20 76.00 76.70 82.43 WBCs average 2008-2015 73.35 75.70 77.98 77.65 79.82 79.85 78.75 80.57 77.96 Source: IMFs World Economic Outlook, National Authorities, Author’s Calculation.
4.2 Loans in Banking System
Lending is a very important profitability indicator in the banking systems of the WB countries, as it generates most of the revenues. Therefore, the quality of approved loans is a very important indicator of banking performance, which naturally also affects the profitability of the banking system. Problems presented as a result of delays in loan repayment not only affect the performance of the banking sector, but also have a major impact on the economy. The following section presents the participation of loans in GDP, in WB countries (as %).
Table 7. Participation of loans in GDP in WB countries (as %) during the 2008-2015 period. Country/years 2008 2009 2010 2011 2012 2013 2014 2015 County average 2008-2015 ALBANIA 36.40 38.90 38.10 41.40 41.10 38.70 42.10 41.80 39.81 B&H 58.90 58.10 58.70 59.60 62.10 62.30 63.70 64.50 60.99 KOSOVO 31.20 31.10 33.10 35.70 34.80 33.90 38.70 34.80 34.16 MACEDONIA 34.00 29.50 33.30 36.10 34.10 39.30 38.80 37.90 35.38 MONTENEGRO 95.50 88.10 81.20 73.70 75.50 73.10 69.60 67.90 78.08 SERBIA 36.70 45.40 54.20 52.30 56.10 47.80 48.10 61.00 50.20 WBCs average 2008-2015 48.78 48.52 49.77 49.80 50.62 49.18 50.17 51.32 49.77 Source: Annual reports from Central Banks of respective countries, throughout the years. Author’s calculations The average of loan participation in GDP in Western Balkan countries (as %), for the entire comparative period was only 49.77%. A higher average is reflected in Montenegro, with a rate of 78.08%, which is 28.31% higher than the average of all WB countries for the entire comparative period. Furthermore, a high average of loan
participation in GDP is also reflected in B&H at 60.99%, which is above the average of the comparative period for all countries by 11.22%. Loans (as % of GDP) in Serbia were at the 50.20%, which is only 0.53% above the average of the region for the comparative period.
While, other countries had lower loan rates (as % of GDP) than the average of the entire region for the comparative period, Albania with 39.81%, Macedonia with 35.38% and Kosovo with 34.16%.
4.3 Lending-Deposit Interest Rate Spread
The interest rate spread which represents gross profit, is an important indicator which largely impacts on banks' profitability. Therefore, the following section presents the interest rate spread of the respective countries.
Table 8. Lending-deposit interest rate spread)
Country/years 2008 2009 2010 2011 2012 2013 2014 2015 County average 2008-2015 ALBANIA 6.20 5.90 6.40 6.57 5.46 5.66 6.74 7.30 6.28 B&H 3.50 4.3 4.73 4.64 3.68 3.96 3.97 3.17 3.99 KOSOVO 9.40 10.1 10.93 10.24 9.12 8.68 8.2 6.54 9.15 MACEDONIA 3.80 3.00 2.42 2.96 3.41 3.62 3.76 4.20 3.40 MONTENEGRO 5.40 5.50 5.80 6.60 6.30 6.50 7.30 7.47 6.36 SERBIA 8.80 6.70 5.97 7.41 7.63 9.15 8.00 7.81 7.68 WBCs average 2008-2015 6.18 5.92 6.04 6.40 5.93 6.26 6.33 6.08 6.14
Source: The Global economy.com The IMF. Author’s calculation. Annual reports of National banks of respective countries, by year. Author’s calculation.
4.4 Participation of NPL in Total Loans of WB Countries (as %)
Throughout the years NPL as an indicator has a great importance in addressing the profitability of the banking system. The participation of NPLs in the total of approved loans is presented below:
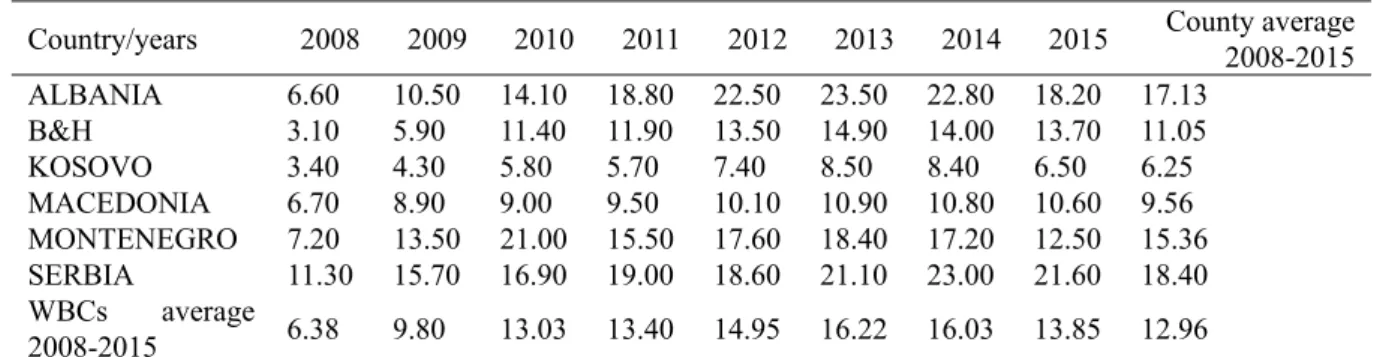
Table 9. Participation of Non-performing loans in total loans, in WBC(as %) throughout the years.
Country/years 2008 2009 2010 2011 2012 2013 2014 2015 County average 2008-2015 ALBANIA 6.60 10.50 14.10 18.80 22.50 23.50 22.80 18.20 17.13 B&H 3.10 5.90 11.40 11.90 13.50 14.90 14.00 13.70 11.05 KOSOVO 3.40 4.30 5.80 5.70 7.40 8.50 8.40 6.50 6.25 MACEDONIA 6.70 8.90 9.00 9.50 10.10 10.90 10.80 10.60 9.56 MONTENEGRO 7.20 13.50 21.00 15.50 17.60 18.40 17.20 12.50 15.36 SERBIA 11.30 15.70 16.90 19.00 18.60 21.10 23.00 21.60 18.40 WBCs average 2008-2015 6.38 9.80 13.03 13.40 14.95 16.22 16.03 13.85 12.96 Source: Annual reports of National banks of respective countries, by year. Author’s calculation.
From the above table it can be concluded that NPL, in the post GFC (global financial crisis) period, experienced a sharp increase in most WB countries.
The highest level of NPL is reflected in Serbia which varies from 11.3% in 2008 and 23% in 2014. The average NPL participation on loans for the comparative period 2008-2015, in this country was at the level of 18.4%. Thus, NPL on average in Serbia are 5.44% higher the average of the region for the comparative period. Another high level of NPL participation on loans is reflected in Albania which varies between 6.6% in 2008 and 23.5% in 2013, with an average of 17.13% for the entire period which is 4.97% above the average of region. In Montenegro, NPL fluctuate from 7.2% in 2008 and 18.4% in 2013. On average, for the comparative period, the NPL participation on loans were at the level of 15.36% which is 2.4% above the average of the region. In B&H, NPL vary between 3.1% in 2008 and 14.9% in 2013. This illustrates a major increase of NPL as a result of GFC (Global Financial Crisis) in this country. Despite the fact that NPL in this country are below the average of the region by 1.46%. In
Macedonia, NPL also experienced an increase from 6.7% in 2008 to 10.9% in 2013. The average NPL participation on loans in this country for the comparative period is 9.56%, which is 3.4% below the average of the region. The lowest level of NPL participation on loans is in Kosovo, where their rate varies from 3.4% in 2008 to 8.5% in 2013. The average NPL for the comparative period is 6.25%. On this regard, Kosovo, is the only country from Western Balkans, where NPLs are at a single digit value. Compared to the average of the region, for the entire comparative period, the level of NPLs in Kosovo is lower by 6.71%. This mainly due to the fact that banks in Kosovo have governed very conservative policies as well as enormous demand for collateral, which in certain cases exceeded double the loan value.
5. Bank Specific Indicators
The performance of banking systems in the Western Balkans countries for the 2008-2015 period is analyzed through two key indicators, return on assets (ROA) and return on equity (ROE).
The fluctuations of these two indicators over the years for the respective countries are presented in this section: 5.1 Return on Assets (ROA) and Return on Equity (ROE)
Banks' profitability, measured through two key indicators (ROA and ROE), displays a heterogeneity in all WB countries that conduct business in an extremely difficult business environment. The following table illustrates the fluctuations of these two indicators for all WB countries over the years.
Table 10. Indicators of bank profitability in the WBC, %, during the 2008-2015 period.
Country/years Profit. Indicat. 2008 2009 2010 2011 2012 2013 2014 2015
County average 2008-2015 ALBANIA ROA ROE 19.95 11.77 1.68 1.17 11.17 1.19 1.02 9.05 0.64 5.39 0.61 5.01 7.48 1.76 0.89 0.22 0.938.95 B&H ROA ROE 0.62 0.32 6.50 3.04 -0.46-4.02 0.84 6.54 0.97 -0.026.89 -0.16 0.75 0.31 5.25 4.15 0.423.52 KOSOVO ROA ROE 20.10 13.10 2.30 1.40 14.80 14.30 1.50 1.40 0.70 7.20 0.90 9.40 20.30 26.40 2.00 2.90 15.701.64 MACEDONIA ROA ROE 13.08 6.53 1.72 0.83 0.99 8.30 0.40 3.43 0.56 4.68 0.83 6.71 7.99 10.27 0.99 1.27 0.957.62 MONTENEGO ROA ROE -0.25 -3.27 0.37 3.25 -23.36-4.34 -0.16-1.54 -18.83-2.10 0.33 0.04 5.52 -2.58 0.77 0.36 -0.66-5.06 SERBIA ROA ROE 1.78 0.86 7.82 3.88 0.92 4.62 0.99 5.03 0.70 3.44 -1.990.41 -0.19 -0.93 1.15 0.24 0.712.88 WB average
2008-2015
ROA 1.31 0.83 -0.03 0.75 0.25 0.46 0.87 0.88 0.66 ROE 10.70 6.93 1.92 6.14 1.46 3.22 7.60 6.86 5.60 Source:Central banks of respective countries. The Global Economy.com. Author’s calculations.
From the above data it can be concluded that:
In Albania, ROA varies between 0.22% in 2015 and 1.68% in 2008. The average value for the analyzed period for this country is at 0.93%, which in fact is 0.27% higher the average for all Western Balkan countries. On the other hand, ROE varies between 1.77% in 2015 and 19.95% in 2008. The average value for ROE during the comparative period in Albania is at 8.95%, which is 3.35% higher the average of the region.
In B&H, ROA varies between -0.46% in 2010 and 0.97%. The average for the comparative period is 0.42 % which is below the average of the region for 0.24%. While ROE, in this country varies between -4.02% in 2010 and 6.89% in 2012. The average for the analyzed period is 3.52% which is lower than the average of the region for 2.08%. Performance indicators in Kosovo display better values compared to all other WB countries for the comparative period. Thus, ROA display a positive value and varies between 0.70% in 2012 and 2.90% in 2015. The average for the comparative value is 1.64% which is approximately 1% higher than the average of all WB countries. On the other hand, ROE, in Kosovo displays satisfactory performance and for the comparative period it varies between 7.2% in 2012 and 26.4% in 2015. The average for the analyzed period is 15.7% which is higher than the average of the region by 10.10%.
The performance indicator, ROA, in Macedonia varies between 0.40% in 2011 and 1.72% in 2008. The average for the period is 0.25% which is 0.29% higher than the average of the region. While ROE varies between 3.43% in 2011 and 13.08% in 2008. The average for the comparative period is 7.62% which is 2.02% higher than the average for all WB countries.
In Montenegro, ROA displays poor performance and varies between -4.34% in 2010 and 0.77% in 2014. The average for the analyzed period, for this country is negative at -0.66%, which is below the average of the region by 1.32%. Furthermore, even ROE displays poor performance and varies between -23.36% in 2010 and 5.52% in 2014. The average for the comparative period is 5.06% which is 10.66 lower than the average for all WB countries. Meanwhile in Serbia, ROA varies between the interval of -0.19% in 2014 and 1.78% in 2008. The average for the period is 0.71 which is above the average of the region by only 0.05%. ROE on the other hand, varies between -1.99% in 2013 and 7.32% in 2008. The average for the comparative period is only 2.88% which is in fact below the average of all WB countries for this period by 2.72%.
From the above analysis it can be concluded that both performance indicators (ROA and ROE) in Western Balkan Countries, for the comparative period (2008-2015) on average have shown better performance in the period before global financial crisis than the period after it and that some of these countries still have to fully recover from the crisis in question. Based on performance indicators (ROA and ROE) the banking system in Kosovo has shown the best results.
A few of the reasons why this is the case are explored in this paragraph. Kosovo has had little to no access in international markets. Commercial banks in this country have governed with very conservative policies. Collateral requirements in this country have surpassed double the value of the amount requested for loan. Furthermore, other than the borrower two other guarantors were required for any approved loan, an issue that burdens the client but secures the high value approved loans.
6. Conclusions and Recommendations
Financial systems in the WB countries are dominated by banks located in most of the countries with foreign capital. The assets of foreign-owned banks in these countries vary between 70-90% of total banking sector assets in these countries. The profitability of banks in WB countries, which carry out their business in a challenging environment, is addressed through two key indicators (ROA and ROE). Based on the literature review as well as the data analyzed in the Western Balkan countries, for the observed period 2008-2015, using the comparative method, it can be concluded that these indicators differ and are dependable on the variations of a number of internal and external variables. Therefore, for a specific period of time, some variables for a particular group of banks, in one country, may have a high statistical significance over ROA and ROE, while for the other period it may not be significant at all.
From the analysis so far and as the literature also suggests, it can be concluded that non-performing loans have high statistical significance with a negative relationship on bank profitability. The high level of NPLs in most of these countries continues to jeopardize the profitability of the banking system.
The average values for profitability indicators in Albania for the comparative period 2008-2015, are 0.93% for ROA and 8.95% for ROE. In BiH, the average for of the comparative period are 0.42% for ROA, while ROE is at 3.52%. Performance indicators in Kosovo show the highest values in comparison to all other WB countries. The average ROA, for the comparative period is 1.64%, while ROE is at 15.70%. In Macedonia, ROA for the analyzed period is at 0.95%, ROE on the other hand is at 7.62%. In Montenegro, performance indicators are as follows: ROA with -0.66% and ROE with -5.06%. In Serbia, the average for the analyzed period is 0.71% for ROA and 2.88% for ROE.
Based on the conducted analyzes and also as the literature suggests, non-performing loans and reserve provisions have high inverse statistical significance on banks profitability. Countries with high level of NPL display lower values for profitability indicators and vice versa.
Therefore, as a conclusion, the generated results indicate that the banking systems of WB countries for the 2008-2015 period have been characterized by many fluctuations in terms of performance, business risk management and problems related to non-performing loans.
Based on the so far analysis, regarding the banking systems of all Western Balkan countries, specific recommendations can be given, as follows:
- Improvement in legal infrastructure so that execution of collateral for bad loans is easier and faster. This would enable banks to access new financial means for new loans and would enable revenue generation, thus also influencing the profitability of the banking system of the respective countries.
- Further distribution of loans into different sectors would lower the risk exposure of banks, since in the majority of WB countries, the sectors which benefit most of the loans are trade and construction, which carry higher business risk. Therefore a diversification of loan portfolio is required in order to lower the risk exposure to bad loans from one sector only.
- To improve human and technical capacities should as well as the structure of business risk management, thus of credit risk.
- Expanding the range of banking products and services would increase revenue generating sources, thus also impacting the bank’s profitability.
- Further supervision of banks would affect the management of commercial banks to behave cautiously over business risk exposure.
- Commercial banks should consider the possibility to diversify their investment portfolio, especially in financial derivatives, which would enable the improvement of profitability indicators.
-The utilization of best practices from banking systems of developed nations would also affect the improvement of profitability indicators.
Note
Note 1. Western Balkan Countries in ABC order: Albania, Bosnia and Hercegovina, Kosova, North Macedonia, Montenegro, Serbia.
References
Abreu, M., & Mendes, V. (2002). Commercial Bank Interest Margins and Profitability: evidence from EU Countries. Working Paper Series, Porto. https://doi.org/10.12691/ijbrm-1-1-3
Alper, D., & Anbar, A. (2011). Bank Specific and Macroeconomic Determinants of commercial bank Profitability: Empirical Evidence from Turkey. Business and economics Research Journal, 2(2), 139-152. Retrieved from https://ssrn.com/abstract=1831345
Angbazo, L. (1997). Commercial bank net interest margins, default risk, interest-rate risk, and off-balance sheet banking. Journal of Banking & Finance, 21, 55-87. https://doi.org/10.1016/S0378-4266(96)00025-8 Atasoy, H. (2007). Expenditure-income analysis in turkish banking sector and determinants of profitability.
Unpublished Dissertations of Senior Specialists, Central Bank of Turkey, Ankara.
Athanasoglou, P., Delis, M., & Staikouras (2006). Determinants of Banking Profitability in the South Eastern European Region. Online at http://mpra.ub.unimuenchen.de/10274/MPRA Paper No. 10274, posted 20. September 2008 04:31 UTC.
Berger, A. (1995). The Profit Structure relationship in Banking Tests of Market Power and Efficient Structure Hypotheses. Journal of Money, Credit, and Banking, 27(2), 404-431. https://doi.org/10.2307/2077876 Bolt, W., de Haan L., Hoeberichts, M., van Oordt M. R. C., & Swank, J. (2012) . Bank Profitability during recession.
Journal of Banking and Finance, 36. https://doi.org/10.1016/j.jbankfin.2012.05.011
Bourke, P. (1989). Concentration and other determinants of bank profitability in Europe, North America and Australia. Journal of Banking and Finance, 13. https://doi.org/10.1016/0378-4266(89)90020-4
Caruntu, G. A., & Romanescu, M. L. (2008). The Assessment of Banking Performances-Indicators of Performance in Bank Area. MPRA Paper No. 1160, 2008, October. 4. Retrieved from http://mpra.ub.uni-muenchen.de/11600/
Cyrak, M., Popovski, K., & Pepur, S. (2011). Profitability Determinants of the Macedonian Banking Sector in Changing Environment. Procedia Social and Behaviour Science. https://doi.org/10.1016/j.sbspro.2012.05.045
Demirguç-Kunt, A., & Harry, H. (1999). Determinants of Commercial Bank Interest Margins and Profitability: Some international Evidence. The World Bank Review 13(2), 379-408. https://doi.org/10.1596/1813-9450-1900
from Switzerland. Journal of International Financial Markets, Institutions and Money, https://doi.org/10.1016/j.intfin.2010.11.002
Dotsey, M., & Sarte, G. (2000). Inflation Uncertainty and Growth in a Cash-In-Advance Economy. Journal of onetary Economics, 45(3), 631-655. https://doi.org/10.1016/S0304-3932(00)00005-2
Duraj, B., & Moci, E. (2015). Factors Influecing the Bank Profitabiliy-Empirical Evidence from Albania. Asian Economic and Financial Review, 5(3), 483. https://doi.org/10.18488/journal.aefr/2015.5.3/102.3.483.494 Flamini, V., McDonald, C. A., & Schumacher, L. B. (2009). The determinants of commercial bank profitability in
Sub-Saharan Afric. IMF Working Papers, (9), 1-30. https://doi.org/10.5089/9781451871623.001
Goddard, J. Molyneux, P., & Wilson, J. (2004). The Profitability of the European Banks: A cross -sectional and dynamic panel analysis. Manchester School, 72(3). https://doi.org/10.1111/j.1467-9957.2004.00397.x Goddard, J., Molyneux, P., & Wilson, J. (2004). Dynamics of growth and profitability in Banking. Journal of
Money, Credit and Banking, 16, 1069-1090. https://doi.org/10.1353/mcb.2005.0015
Gremi, E. (2013). International Factors Affecting Albanian Banking Profitability. Academic Journal of Interdisciplinary Studies , II(9). https://doi.org/10.5901/ajis.2013.v2n9p19
Güngör, B. (2007). Türkiye’de faaliyet gösteren yerel ve yabancı bankaların kârlılık seviyelerini Etkileyen faktörler: Panel veri analizi. Iktisat Isletme ve Finans, Bilgesel Yayincilik, 22(258), 40-63. https://doi.org/10.3848/iif.2007.258.1464
Hannan, T. H., & Prager, R. A. (2009). The Profitability of a Small Single-Market Banks in an Era of Multimarket Banking. Journal of Banking & Finance, 33(2), 263-271. https://doi.org/10.1016/j.jbankfin.2008.07.018 Hassan, M. K., & Bashir, A. H. M. (2003). Determinants of Islamic Banking Profitability. International Seminar
on Islamic Wealth Creation. University of Durham, 7-9.
Herrero, A., Gavila, S., & Santabarbara, D. (2009). What explains the low profitability of Chinese banks? Journal of Banking and Finance, 33, 2009, 2080-2090. https://doi.org/10.1016/j.jbankfin.2009.05.005
Javaid, S., Anwar, J., Zaman, K., & Gafoor, A. (2011). Determinants of Bank Profitability in Pakistan:Internal factor Analysis. Mediterranean Journal of Social Sciences, 2(1), January, ISSN.2039-2117.
Kalluci, I. (2011). Analysis of the Albanian banking System in a Risk-Performance Framework. Working paper, 03 (26) Research Department, Bank of Albania.
Kosak, M., & Zajc, P. (2006). Determinants of bank efficiency differences in the new EU member countries. Financial Stability report, Expert Papers. Ljubljana. Bank of Slovenija.
Kosmidou, K. (2008). The Determinants of Banks’ Profits in Greece during the Period of EU Financial Integration. Managerial Finance, 34(3), 146-159. https://doi.org/10.1108/03074350810848036
Lartey, V., Antwi, S., & Boadi, E. (2013). The Relationship between Liquidity and Profitability of Listed Banks in Ghana. International Journal of Business and Social Science, 4(3), 48-56.
Lui, H., & Wilson, J. (2010). The Profitability of Banks in Japan. Applied Financial Economics, 20, 1851-1866. https://doi.org/10.1080/09603107.2010.526577
Luo, X. (2003). Evaluating the Profitability and Marketability Efficiency of Large Banks. An Application of Data Envelopment Analysis. Journal of Business Research, 56(8), 627-635. https://doi.org/10.1016/S0148-2963(01)00293-4
Lupu, V. (2012). The Correlation between Inflation and Economic Growth in Romania. Lucrări Ştiinţifice, (5), Seria Zootenhie, 359-363.
Martin Gächter, Macki, P., Isabella Moder, I., Polgár, E. K., Li Savelin, L., & Żuk, P. (2017). Financial stability assessment of EU candidate and potential candidate countries Developments since 2014. European Central Bank, Occasional Paper Series No 190 / May 2017.
Matthew, N. G., & Laryea, A. E. (2012). A financial performance comparison of foreign vs local banks in Ghana. International Journal of Business and Social Science, 3(21), 82-87.
Molyneux, P., & Thorton, J. (1992). Determinants of European Bank profitability; A Note. Journal of Banking and Finance, 16, 1173-1178. https://doi.org/10.1016/0378-4266(92)90065-8
Ramlall, I. (2009). Bank-specific, industry-specific and macroeconomic determinants of profitability in Taiwanese banking system: under panel data estimation. International Research Journal of Finance and Economics, 34,
160-167.
Rose, P., & Hudgins, S. (2012). Bank Management and Financial Services.
Saeed, M. S. (2014). Bank-related, Industry-related and Macroeconomic Factors Affecting Bank Profitability: A Case of the United Kingdom. Research Journal of Finance and Accounting, 5, 42-50. ISSN (Paper)2222-1697 ISSN (Online)2222-2847.
Sufian, F., & Mzafar, S. H. (2009). Determinants of Bank Profitability in a Developing Economy: Evidence from Bangladesh. Journal of Business Economics and Management, 10(3), 91-112. https://doi.org/10.3846/1611-1699.2009.10.207-217
Tmava, Q., & Jakupi, S. (2019). Comparative Analysis of Interest Rates in Western Ballkan Countries, Kosova Perspective. International Journal of English Literature and Social Sciences (IJELS), 4(1), Jan - Feb, https://doi.org/10.22161/ijels.4.1.4
Topak, S. M., & Talu, H. N. (2017). Bank Specific and Macroeconomic Determinants of Commercial Bank Profitability: Empirical Evidence from Turkey. Business and Economics Research Journal, 2(2), 139-152. Trujillo-Ponce, A. (2013). What determines the profitability of banks? Evidence from Spain. Accounting and
Finance, 53, 561-586. https://doi.org/10.1111/j.1467-629X.2011.00466.x
Yuksel, M., Mukhtarov, S., Mammadov, E., & Özsarı, M. (2018). Determinants of Profitability in the Banking Sector: An Analysis of Post-Soviet Countries. Economies, MDPI, Open Access Journal, 6(3), 1-15, July. https://doi.org/10.3390/economies6030041
Copyrights
Copyright for this article is retained by the author(s), with first publication rights granted to the journal.
This is an open-access article distributed under the terms and conditions of the Creative Commons Attribution license (http://creativecommons.org/licenses/by/4.0/).