Planning, and Rcsrch
M., MPAPERS
Development Eoonomkis
OffiY:e of the Vice President Development Economics
The World Bank August 1988
WPS 77
Incentive Policies and
Agricultural Performance
in Sub-Saharan
Africa
Bela Balassa
It has often been said that Sub-Saharan
African countries do not
respond to price incentives
because of rigidities and
inflexibili-ties in their economic structure. This is not the case, however,
as this paper shows.
The Policy. Planning, and Research Complex distributes PPR Woding Papers to disseaminatethefindings ofwori in progress and to anourige the exchange of ideas among Bank staff and all others interested in development issues. These papers carry the names of the authors, reflect only their views, and should be used and cited accordingly. The findings. interpretations, and conclusions are the authors! own. They should not beattributed to theWorld Bank, its Board of Dirctors, itsamgemant, or any of its menberceuntries.
Public Disclosure Authorized
Public Disclosure Authorized
Public Disclosure Authorized
Pok,Piannlng, and Reorch
Dwevelpment Eoonomks0
Exports in general, and agricultural exports in Eastern and Southem Africa. According to this particular, are more responsive to price incen- study, industrial protection and overvalued tives in Sub-Saharan Africa than in developing exchange rates adversely affected the exports of countries as a whole. These are the resuits of an the region. Another Bank study has found that emonometric investigation on the effects of real in Sub-Saharan Africa agricultural growth rates exchange rates on exports. It further appears were higher in countries whose currency depre-that in Sub-Saharan Africa the impact of real ciated, than in countries whose currency appreci-exchange rates is greater on agricultural exports ated, in real terms.
thar on the exports of goods and services.
Kenya a-I the Ivory Coast exemplify Within Sub-Saharan Africa, market-oriented market-oriented, and Tanzania and Ghana countries generally gained, and interventionist interventionist, countries in Sub-Saharan Africa. countries lost, export market shares as the Pairwise comparisons between Kenya and
former, but not the latter, group of countries Tanzania and between the Ivory Coast and maintained realistic exchange rates and did not Ghana have indicated the superiority of the appreciably bias the system of incentives against market-oriented approach in promoting exports
exports. The differences in policies, and in ex- and agricultural production. port performance, are even gredter if
compari-sons are made between private market econo- This paper is a product of the Office of the mies and etatist countries in a three-fold classifi- Vice President, Development Economics. cation scheme that puts some countries in an Copies are available free from the World Bank, intermediate category. 1818 H Street NW, Washington, DC 20433.
Please contact Norma Campbell, room S9-047, These results are supported by the findings extension 33769.
of a World Bank study on agricultural exports in
The PPR Working Paper Series disseminates the findings of work under way in the Bank's Policy, Planming, and Research
Complex. An objective of the series is to get these fndings out quicldy, even if presentations are less than fully polished.
The findings, interpretations, and conclusions in these papers do not necessarily represent official policy of the Bank.
INCENTIVE POLICIES AND AGRICULTURAL PERFORMANCE IN
SUB-SAHARAN
AFRICA Bela Balassa *TABLE OF CONTENTS
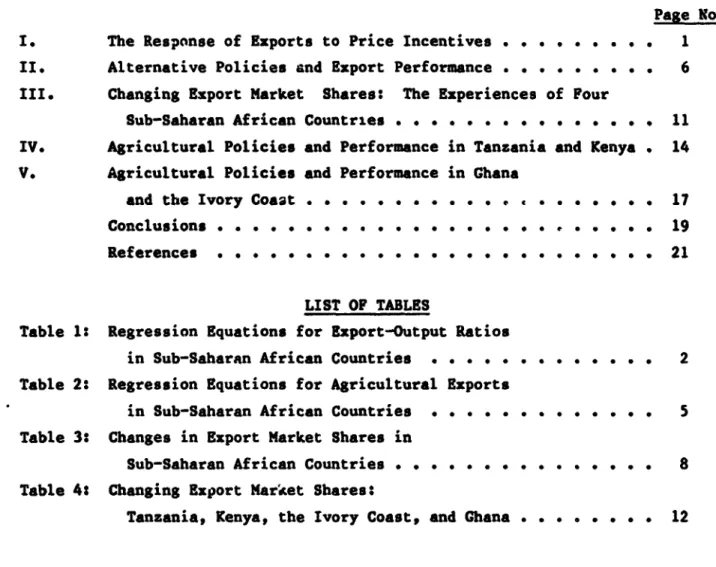
Page No.
I. The Response of Exports to Price Incentives . . . . . . . . . 1
II. Alternative Policies and Export Performance . . . . . . . . . 6
III. Changing Export Market Shares: The Experiences of Four
Sub-Saharan African Countries . . . .. . .. . . . . .. . 11
IV. Agricultural Policies and Performance in Tanzania and Kenya . 14
V. Agricultural Policies and Performance in Ghana
and the Ivory Coaat . . . ... . .a. . .. * 17
conclusions
. . . . . . . . . . . . . . . . . . . . . . . . . 19References
. . . . . . . . . . . 21LIST OF TABLES
Table 1: Regression Equations for Export-Output Ratios
in Sub-Saharan African Countries ... . .. .. . . . . 2
Table 2: Regression Equations for Agricultural Exports
in Sub-Saharan African Countries . . . . . . . . . . . . .
5
Table 3: Changes in Export Market Shares in
Sub-Saharan African Countries . . ... .... 8
Table 4s Changing Export Market Shares:
Tanzania, Kenya, the Ivory Coast, and Ghana . . . . . . . . 12
* The author is Professor of Political Economy at the Johns Hopkins University
and Consultant to the World Bank. He is indebted to Uma Lele for helpful
INCENTIVE POLICIES AND AGRICULTURAL PERFORMANCE IN SUB-SAHARAN AFRICA
Bela
Balassa
This paper examines
the experience
of Sub-Saharan
Africa with
economic
incentives
in general,
and
agricultural
incentives
in particular,
and
analyzes
the effects
of these
incentives
on economic
performance.
Section
I
of the paper
reports
on the findings
of an econometric
investigation
on the
responsiveness
of exports
to incentives.
Section
II reviews
changes
in the
export market shares of Sub-Saharan
African
countries
pursuing
different
development
strategies.
Section
III
examines
changes
in export
market
shares
for four
Sub-Saharan
African
countries,
Tanzania,
Kenya,
Ghana,
and the Ivory
Coast. Sections
IV and V provide
a comparative
analysis
of agricultural
policies
and performance
in two pair
of these
countries:
Tanzania
and Kenya
(Section
IV)
and
Ghana
and
the
Ivory
Coast
(Section
V).
I. The
Response
of Exports
to Price
Incentives
Table
1 reports
the
results
of estimates
for
the
exports
of goods
and
services
and for merchandise
exports,
obtained
by the
use of a reduced
form
equilbrium
equation,
for 16 Sub-Saharan
African
countries.
11 The estimates
pertain
to the
1965-82
period
and
to the 1965-73
and
the
1974-82
subperiods.
The real exchange
rate variable
has the expected
sign
and it is
statistically
significant
at the 1 percent
level
in the equations
for the
1974-82
subperiod
and the entire
1965-82
period
but not for the 1965-73
subperiod.
In the
latter
case,
the
regression
coefficient
is significant
at
1/ The
underlying
model,
and
the
derivation
of the
equation,
are
presented
in
-2-Table I
Regression Equations for Export-Output Ratios in Sub-Saharan African Countries (t-valu*s In parenthesis)
Constant Real Exc;lang* Rate Foreign Income N F R2
1. 1965-7Z
(a) exports of goods and -0.05 0.37 1.21 128 2.43 0.022
nonfactor servicos (-0.87) (1.97)+ (1.07)
(b) merchandise exports -0.14 0.27 3.39 128 2.81 0.028 (-1.77)+ (1.04) (2.17)
11, 1974-82
(a) exports of goods and -0.02 0.78 0.95 128 24.44 0.270 nonfactor services (1.13) (6.60) (1.45)
(b) merchandise exports -0.02 0.91 1.79 '28 10.28 0.127 (-0.65) (4.07) (1.46)
111. 1965-82
(a) exports of goods and 0.01 O.86 0.04 272 36.98 0.210
nonfactor services (0.76) (8.49)* (0.06)
(b) oerchandise exports 0.02 1.01 0.52 272 18.83 0.116 (0.54) (5.93) (0.71)
Source World Bank data base
Note: (a) The variables have been expressed In terms of rates of change between successive years for Individual countries combining time-series and cross-section observations.
-3-the 10 percent level for the exports of goods and services and does not reach
this level of significance for goods alone.
Limiting attention to the values taken by the regression coefficients
which have a high level of statistical significance, we find that the
coefficients vary between 0.78 and 1.01. Since the variables have been
expressed in terms of rates of change, this means that a one percent change in
the exchange rate is associated with a fourfifth to one percent change in the
ratio of exports to output.
The coefficients for the real exchange rate variable are uniformly
higher for the Sub-Saharan African countries than for all developing
countries, for wtdch estimates are presented in Balassa, 1988. For the
1974-82 subperiod and for the antire 1965-82 period, respectively, the differences
between the two sets of estimates are 0.13 and 0.24 percentage points for
merchandise exports and 0.20 and 0.40 percentage points for the exports of
goods and services.
The results conflict with popular notions, according to which changes
in the real exchange rate would have less o! an effect on the exports of
Sub-Saharan African countries than in countries at higher levels of development.
But, they are consistent with the observation that African countries, which
let their exchange rate become greatly overvalued, experienced considerable
losses in export market shares (Sections IV and V).
In contradistinction with the case of all developing countries,
however, the level of significance of the foreign income variable is very low;
it reaches 5 percent only in the case of merchandise exports in the 1965-73
period. This result may be explained by the high share in Sub-Saharan exports
4
-developed countries. Also, coffee exports, accounting for a large proportion
of the exports of severai Sub-Saharan African countries, are determined by
quotas under the International Coffee Agreement, which bear little
relationship to changes in incomes in the developed countries.
Comparable estimates have been made for agriculture. The results
again show the responsiveness of exports to changes in the real exchange
rate. The regression coefficients for the export-output ratio range between
1.08 and 1.35; they are statistically significant at the 1 percent level for
the 1974-82 subperiod and the entire 1965-82 period and at the 10 percent
level for the 1965-73 subperiod.
As in the case of merchandise exports, the regression coefficients of
the real exchange rate variable for agricultural exports are uniformly higher
for the Sub-Saharan African countries than for all developing countries. /
In fact, the differences are larger in the present case, ranging from one-half
for the 1974-82 subperiod to a near doubling in the 1965-73 subperiod and the
entire 1965-82 period.
At the same time, for the c3untries of Sub-Saharan Africa, the
regression coefficients for agriculture are substantially higher than for
merchandise or for goods and services. This result again conflicts with
conventional wisdom, which holdn that agricultural exports are less responsive
to prices than industrial exports.
Table 2
Reoresslon Equatlons for Agricultural Exports In Sub-Saharan African Countries
Constant Real Exchange Rate Foreign Income N F R2
xport-Output Ratio 1. 1965-73 0.04 1.08 0.43 128 1.75 0.012 (0.22) (1.87)' (0.13) 11. 1974-82 -0.02 .l1S 2.52 128 10.24 0.127 (-0.36) (4*00) (1058) 111. 1965-82 0.04 1.35 0.68 272 14.79 0.092 (0.85) (5.26) (0.61)
S. Net Exports - Output Ratio
1. 1966-73 1.65 -4.73 -42.65 128 0.42 -0.009 (0.61) (-0.52) (-0.77) 11. 1974-82 0.12 16.43 6.62 128 6.57 0.081 (0.15) (3.55) (0.26) 111. 1965-82 0.07 11.47 -7.72 272 4.39 0.024 (0.11) (2.96) (-0.46)
-6-In turn,
the
statistical
significance
of the foreign
income
variable
does not even reach the 10 percent
level
for the countries
of Sub-Saharan
Africa. This result may be explained
by reference
to the low income
elasticity
of demand
for
foodstuffs
and,
in particular,
for
tropical
beverages
as noted
above
in conjunction
with
merchandise
exports.
The coefficient
of determination
is lower for agricultural
exports
than
for merchandise
exports
or for the exports
of goods
end services.
The
differences
in the
results
may
be explained
by non-price
factors
which
affect
agricultural
production.
1/ Nevertheless,
apart
from
the
1965-73
period,
the
F-statistics
are
high.
The adjusted
R
as
and the F-statistics
are substantially
lower
in
the
equation
utilizing
the
net export
ratio
as the
dependent
variable.
This
result
may be explained
in part
by the
fact
that
errors
in the
export
and
the
import
data
are
amplified
when
one
takes
the
difference
between
the
two
and
in
part
by the
effects
on imports
of changes
in foreign
exchange
receipts
and
in
the
availability
of food
aid.
In the net export equation,
the real exchange
rate variable
is
statistically
significant
at the 1 percent
level
in the second
subperiod
as
well
as in the
entire
period. It takes
values
of 16.4
in 1974-82
and
11.5
in
1965-82.
The results
again
provide
evidence
of the
effects
of changes
in the
real
exchange
rate
on trade
in agricultural
products.
II. Alternative
Policies
and Export
Performance
In this section
of the paper,
we analyze
the effects
of policy
choices
on export performance
in the case of merchandise
exports and
-7-agricultural exports. In so doing, alternative classification schems have
been used in regard to the policies applied by the countries of Sub-Saharan
Africa.
Distinction has first been made between market-oriented and
interventionist countries on the basis of available information on the extent
of public interventions in capital, labor, and foreign exchange markets. The
first group includes Botswana, Cameroon, Ivory Coast, Kenya, Malawi,
Mauritius, Niger, Togo, and Upper Volta while the second comprises Benin,
Ethiopia, Ghana, Madagaacar, Mali, Senegal, Sudan, Tanzania, Zaire, and
Zambia. A three-fold classification scheme has also been utilized, with
Botswana, Cameroon, Ivory Coast and Mauritius included in the group of private
market economies, Benin, Ethiopia, Ghana, Madagascar, Mali, Tanzania and
Zambia in the group of Atatist countries, and Kenya, Malawi, Niger, Senegal,
Sudang Togo, Upper Volta, and Zaire in an intermediate group.
The policies applied greatly affected export performance in the
countries under consideration. This is evidenced by changes in export market
shares for each country's merchandise exports as well as for its agricultural
exports. The results reported in Table 3 show the ratio of average export market shares in the 1974-78 period to the average for the 1971-73 base period.
The range of increases in average export shares was between 9 to 81
percent in market economies, except for Cameroon, Niger, and Togo that
experienced declines of 4 to 22 percent. In turn, interventionist countries
gsnerally lost export market shares, with the losses exceeding one-fourth in
Benin, Ethiopia, Ghana, and Tanzania, where policy-induced distortions -- in
Table 3
Changes in Export Market Shares in Sub-Saharan African Crautries
Merchandise Exports Traditional Agricultural Exports
Country -
1974-78
1974-78 Botswana 181.2 120.7 Cameroon 96.0 107.7 Ivory Coast 118.9 134.9 Maritius 108.1 89.1 Kenya 109.0 123.8 Malawi 152.3 150.1 Niger 77.8 47.1 Togo 91.4 61.6 Upper Volta 121.9 102.0 Senega. 103.2 119.3Sudan
83.6 90.3 Zaire 76.9 63.1 Benin 41.8 35.8Ethiopit
60.2 60.2 Ghana 72.8 79.7 Madagascar 82.4 88.9Mali
106.6 891
Tanzania
71.4 994
Zambia 87.4-Source: World Bank data tapes.
Note: The results show the ratio of a country's export market share in
1974-78 to its share in 1971-73.
The average ratio for merchandise exports has been derived as the weighted
average of the ratios calculated for traditional primary exports, defined as
accounting for more than 1.5 percent in total exports in 1971-73, taken
individually for nontraditional primary exports, for fuel exports, and for
manufactured exports. For traditional agricultural exports, the average
-9-pronounced. among the interventionist
countries,
only Mali and Senegal
experienced
small
gains
(13
to 7 percent)
in export
market
shares.
The effects
of the policies
applied
on export
performance
are also
apparent
in weighted
averages
calculated
for the various
groups. Thus,
market-oriented
countries
had
an average
gain
of 5 percent
and interventionist
countries
an average
loss of 19 percent
in export
market
sharea
during
the
1974-78
period. Using
a three-fold
classification
scheme,
and
distinguishing
among private
market economies,
intermediate,
and 6tatist
countries,
the
corresponding
figures
are
+15,
-10,
and
-24
percent
(Balassa,
i984).
Table
3 further
provides
information
on the
performance
of individual
countries
in regard
to traditional
agricultural
exports,
defined
as accounting
for
at least
1.5
percent
of expo.t
value
in 1971-73.
The
results
confirm
the
findings
pertaining
to total
merchandise
exports.
Apart
from
Mauritius,
Niger,
and Togo,
private
market
economies
in
Sub-Saharan
Africa
increased
their
market
shares
of traditional
agricultural
exports;
the largest
gains
were observed
in Malawi
(50 percent),
the Ivory
Coast
(35
percent),
Kenya
(25
percent),
and Botswana
(21
percent).
Tn turn,
apart
from
Senegal,
all interventionist
countries
lost
export
market
shares,
with a nearly
two-thirds
loss in the case of Benin
and over one-third
in
Ethiopia
and Zaire. As shown
in Table 3, the differences
are even more
pronounced
if private
market
economies
and
6tatist
countries
are
compared.
All i- all, market-oriented
countries generally
gained, and
interventionist
economies
lost, export market shares during the 1973-78
period,
when the former
group
of countries
did not appreciably
discriminate
against
exports
and adopted
realistic
exchange
rates
thile the latter
group
- 10
-exchange rate appreciate in real terms. The differences in policies, and in
export performance, are even greater if comparisons are made between private
market economies and etatist countries in a three-fold classification scheme
that puts some countries in an intermediate group.
-These results are supported by the findings of a World Bank study on
agricultural exports in Eastern and Southern Africa. According to the study,
industrial protection and overvalued exchange rates adversely affected
agricultural exports in this region during the 1965-83 period (Gulhati, Bose,
and Atukorala, 1985).
Another Bank study found that, in Sub-Saharan Africa, countries with
a high degree of price discrimination against agriculture had an average
agricultural growth rate of 0.8 percent in the 1970-81 period while the
corresponding growth rates were 1.8 percent and 2.9 percent in countries with
medium andv low price discrimination against agriculture (Cleave.-, 1985). This
result was confirmed by an econometric analysis of the relationship between
the extent of price distortions and agricultural output growth in these
countries (Ibid) although the small number of observations limits the validity
of the results.
The same author examined the implications of overvalued exchange
rates for the growth of agricultural production in Sub-Saharan Africa. He
found that, on the average, agricultural growth rates were higher in countries
whose currency depreciated, than in countries whose currency appreciated, in
real terms. In the 1970-81 period, the average annual growth rate of
1/ For a detailed discussion of the classification scheme utilized and the
-
11
-agricultural production was 2.6 percent in the first group and 1.5 percent in
the second (Ibid).
III. Changing Export Market Shares: The Experiences of Four
Sub-Saharan African Countries
Table 4 reports estimates on changes in export market shares for
Tanzania, Kenya, Ghana, and the Ivory Coast for the 1974-78 and the 1979-81
periods. Changes in market shares have been expressed as the ratio of actual
exports to hypothetical exports, calculated on the assumption that the country
maintained its share in world markets in the 1971-73 and 1976-78 base periods,
respectively.
Table 4 provides information on the traditional agricultural exports
of the four countries, defined as accounting for at least 1.5 percent of their
total merchandise exports in the base period. The table also shows weighted
averages for these exports, the weights being each country's base period
export values. Information is further provided on nontraditional primary
exports, defined as primary products that individually accounted for less than
1.5 percent of total exports in the base period, which in their great bulk are
agricultural commodities. Finally, the average for total merchandise expotts
has been calculated from data for traditional agricultural and nonagricultural
primary exports, I/ nontraditional primary exports, fuel exports, aud
manufactured exports.
The data show a 1 percent average decrease in Tanzania's market
shares in its traditional agricultural exports in 1974-78, followed by a 19
percent decline in 1979-81. This contrasts with increases of 24 percent and
19 percent in Kenya in the two periods, respectively.
1/ Tanzania and Kenya did not have any traditional nonagricultural exports;
this category includes sawn and veneer logs in the Ivory Coast and Ghana,
- 12
-Table 4
Changing Export Market Shares: Tanzania, Kenya. the Ivory Coast. and Ghana
Tanzania Kenya Ivory Coast Ghana 1974-78 1979-81 1974-78 1979-81 1974-78 1979-81 1974-78
Merchandiso Exports 71.4 59.8 109.0 101.2 118.9 125.4 72.8 Nontraditional Primary Exports 56.4 60.0 96.0 108.0 116.1 214.8 76.2 Traditional Agricultural Exports 99.4 81.1 123.8 118.7 134.9 132.4 79.9
Coffee 104.9 94.6 130.5 121.2 140.1 109.1 Teo 119.1 128.1 123.2 143.5 Cotton 82.7 57.7 125.2 203.3 Sisal 101.2 95.0 215.7 204.1 Oilseed Cake 57.7 33.7 Toabcco 146.6 101.3 Meat, prepared 92.0 23.9 Melze 53.3 24.4 Cocoa Brans 139.4 205.1 81.1 Cocoa Paste 87.1 39.7 Cocoa Butter 127.7 126.5 66,9 Bananas 89.6 72,9 Palo Oil 141.2 63.3
Source: World Bank data base.
Note: The results show the ratio of a country's export market share In the period undor
consideration to Its share In the base period. For 1974-78 the baso period in 1971-73; for 1979-81, It Is 1976-78. On the method of calculating changes In market shares for merchandise exports, see Table 2.
- 13
-Losses
in market
shares
in Tanzania
were
much
larger
for
annual
crops
than for tree crops (coffee
and tea). The only major annual
crop where
Tanzania
made
gains
in export
market
shares,
tobacco,
reached
only
one-half
of
its production
target,
despite
large injections
of capital. Among minor
exports,
cashew
nuts and pyrethreum
experienced
a decline
by two-thirds
from
peak levels
(Ellis,
1985). In the
exportation
of cez'ee
and tea,
as well
as
in that of agava
fiber,
where
the two countries
are in competition,
Kenya's
export
performance
was much superior
to that
of Tanzania. The differences
between
the
two
countries
are
even
greater
in regard
to nontraditional
primary
exports.
While
in Kenya
average
losses
of 4 percent
in 1974-78
gave
place
to
a
gain
of 8 percent
in 1979-81,
Tanzania
experienced
losses
of 44 percent
in
the
first
and
40 percent
in the
second
period.
Tanzania
also did less well than Kenya in the exportation
of
manufactured
goods. As a result, Tanzania's
average market share in
merchandise
exports
fell
by 29 percent
in 1974-78,
followed
by a decline
of 60
percent
in 1979-81. Average
gains for Kenya were 9 percent
in the first
period
and 1 percent
in the second,
when it lost manufactured
exports
due
largely
to the
closing
of tLe
Tanzanian
border.
Among its traditional
agricultural
exports,
data
for 1974-78
period
show
average
losses
in export
market
shares
of 19 percent
in cocoa
beans
and
33 percent
in cocoa
butter
for
Ghana Ghana
experienced
even
larger
losses
in
its
market
shares
in traditional
nonagricultural
exports
and in nontraditional
primary exports,
bringing
the decline in its average market share in
merchandise
exports
to 27 percent.
While
there
are
no comparable
data
for
the
1978-81
period,
available
information
points
to the continuation
of these
- 14
-By contrast, the Ivory Coast increased its export market shares in
cocoa butter and cocoa paste by 39 percent and 27 percent, respectively, in
the 1974-78 period. And, while the two countries have similar climatic
conditions, the Ivory Coast diversified its agricultural exports during the
1960s and made gains in the subsequent period in cotton and palm oil, although
not in bananas.
Taken together, the Ivory Coast had an average gain of 35 percent in
its traditional agricultural exports in 1974-78, compared with a loss of 20
percent for Ghana. The Ivory Coast also increased its market shares in
nontraditional primary exports by 16 percent, compared with a loss of 24
percent for Ghana. And, the Ivory Coast made further gains in this comodity
group in 1979-81, bringing the average gain for all merchandise exports to 25
percent, exceeding the 19 percent gain in 1974-78. In turn, Ghana experienced
a 27 percent loss in merchandise exports in 1974-78; data for 1979-81 are not
available.
IV. Agricultural Policies and Performance in Tanzania and Kenya
An important factor contributing to losses in export market shares in
Tanzania was the increasing overvaluation of the real exchange rate. Thus,
Kenneth Meyers has estimated that the ratio of exports to agricultural value
added in Tanzania would have been 18 percent higher in 1982 if the exchange
rate remained at its 1973 level in real terms. Yet, the appreciation of the
real exchange rate by 44 percent in the 1973-82 period followed an
appreciation of 32 percent between 1965 and 1973.
- 15
-Changes
in the
real
exchange
rate do not fully
reflect
the adverse
effects
of the incentive
system
on agricultural
exports,
which
contributed
to
the decline
in the ratio
of exports
to agricultural
value
added
in Tanzania
from 41 percent
in 1973
to 14 percent
in 1982. Other important
influences
were the increase
in marketing
margins
of the parastatals
that led to
reductions
in the
ratio
of producer
to border
prices,
in particular
for
coffee
and tea; increasing
shortages
of agricultural
inputs,
machinery
spares,
and
consummr
goods;
and
the
deterioration
of transport
facilities
(Lele,
1984).
Exports
were further
discouraged
as the prices of export crops
declined
by one-third,
compared
with the prices
of domestic
crops,
between
1969-70
and 1979-80
in smallholder
production.
Yet,
the
average
real
price
of
domeutic
crops,
derived
by deflating
the index
of producer
prices
by the
consumer
price index,
also decreased
by 16 percent
between
1970 and 1980
(Ellis,
1985).
The adverse changes
in the incentive
system led to a fall of
Tanzania's
agricultural
exports
by 6.5 percent
a year
between
1970
and 1981.
In turn,
among
domestic
crops,
marketed
production
declined
at an average
annual
rate
of 20.8
percent
in the
case
of rice
and 3.8
percent
for
wheat
in
the
1970-82
period. Also,
while
average
increases
were
3.6
percent
a year
for
maize,
production
in 1981 and 1982 did not reach one-half
of the peaks
attained
in 1978
and
1979.
At the
same
time,
although
it has
been
claimed
that
sales
in informal
markets
rose
rapidly
in Tanzania,
increases
in imports
indicate
that
domestic
production
was less and less able to provide for the needs of the
- 16
-thousand
tons in 1981-82,
compared
with 13 thousand
tons in 1970-71
(Lele,
1988,
p. 168).
In Kenya,
the ratio
of agricultural
exports
to value
added
was 33
percent
in 1973
and 31 percent
in 1982. The relative
constancy
of this
share
may be largely
attributed
to the constancy
of the
real
exchange
rate
and the
lack of discrimination
against
exports
in the agricultural
sector. Thus,
prices
for
export
crops
and
domestic
crops
moved
in a parallel
fashion
during
the period;
nor was there
much variation
among
domestic
crops. Also, the
averagt
real
price
of both
export
and domestic
crops
increased
by 13 percent
between
1972-73
and
1982-83
(Jabara,
1985).
The system
of incentives
applied
may
explain
that
Kenyan
agricultural
exports
rose
by 2.6 percent
a year
between
1970
and 1981. In turn,
marketed
production
increased
at average
annual
rates
of 2.3 percent
in the case of
maize,
2.1 percent
in the case
of rice,
and 1.7
percent
in the case
of wheat
(Lele
et al, 1985).
The situation
iu even more favorable
if all domestic
crops rather
than
only staple
cereals
are considered. Between
1972/73
and 1982/83,
the
production
of domestic
crops
rose by 137
percent
while
the increase
for all
crops
was 126
percent
(Jabara,
1985).
Taking
1979/80
as the
terminal
year,
comparisons
may further
be made
with
Tanzania. Between
1972/73
and 1979/80,
the production
of export
crops
rose
by 18 percent
and
that
of domestic
crops
by 104
percent
in Kenya,
with
an
average
increase
of 95 percent.
In turn,
between
1973/74
and 1979/80,
the
23
percent
decline
in the production
of export
crops in Tanzania
was barely
compensated
by the
rise
in the production
of domestic
crops,
with
an average
- 17
-V Agricultural Policies and Performance in Ghana and the Ivory Coast l/
Changes in export market shares in Ghana and the Ivory Coast
represent a continuation of trends since independence. Between 1963/64 and
1979/80, cocoa production fell from 443 to 275 thousand metric tons in Ghana
while it increased from 99 to 379 thousand metric tons in the Ivory Coast.
And, in Ghana, a further decline to 107 thousand metric tons occurred by
1983-84 (Stryker and Brandt, 1983).
The results may be explained by reference to the price policies
applied in the two countries. In 1984, Ghanaian cocoa farmers received 20
percent of the world market price while the corresponding ratio was 84 percent
in the Ivory Coast (Ibid). Although the results for Ghana represent a
deterioration of the situation from earlier periods, high taxes were levied on
cocoa from the early 1960s onwards.
Relatively high producer prices provided incentives in the Ivory
Coast for the expansion of cultivation, the upgrading of varieties through
replanting, and the careful husbanding of cocoa trees. In turn, in Ghana, a
number of existing plantations were abandoned and new high-yielding cocoa
varieties were not introduced in cases when replanting did occur.
Nor did Ghana experience a diversification of exports, so that the
decline in the exports of cocoa was not compensated by increases in other
agricultural exports. In fact, between 1970 and 1982, the ratio of exports to
agricultural value added fell from 32 to 2 percent.
High industrial protection and the increasing overvaluation of the
exchange rate contributed to these results. Thus, between 1975 and 1982, the
real exchange rate appreciated by 80 percent in Ghana.
-
18
-Import-substitution crops, in parcicular cereals, produced mainly on
large farms, were protected by quantitative import restrictions. These crops,
however, are at a comparative disadvantage in Ghana. Also, they suffered the
consequences of the deterioration of physical infrastructure, in particular
transportation facilities, and the scarcity of imported inputs, such as
fertilizers and insecticides. Thus, the production of cereals declined by 62
percent between 1970 and 1983 while the production of starch staples fell by
40 percent.
These figures indicate the adverse effects of the policies applied on
Ghanaian agriculture. While the intention had been to syphon off revenues
from cocoa production to the benefit of other sectors of the economy, foreign
exchange earnings decreased as a result, eventually leading to a decline in
other production activities that were unable to obtain the necessary inputs.
By contrast, the Ivory Coast adopted a balanced system of incentives
while encouraging the inflow of foreign capital and the immigration of labor
from neighboring countries. As a result, agricultural production continued to
rise at a rapid rate, with average increases of 3.8 percent in value added
between 1970 and 1980. Within agriculture, the production of domestic crops
and export crops grew in a parallel fashion, maintaining the share of exports
at about three-fourths of the total.
With value added in manufacturing rising by 8.2 percent a year, the
gross domestic product of the Ivory Coast increased at an average annual rate
of 6.4 percent between 1970 and 1980, following a growth rate of 8.0 percent
between 1960 and 1970. By contrast, increases of 2.2 percent a year in the
1960s gave place to an average annual decline of 0.5 percent in the 1970s in
- 19
-increased from $779 in 1960 to $1410 two decades later in the Ivory Coast
while a decline from $1009 to $762 occurred in Chana (Summers and Heston,
1984).
Policy performance deteriorated in the Ivory Coast towards the end of
the 1970s as high-cost investments were undertaken, in particular in sugar,
and the exchange rate became increasingly overvalued as domestic inflation
accelerated while the parity vis-a-vis the French franc was maintained in the
framework of the Franc area. Important policy ceforms were introduced in
subsequent years, however, which are expected to lead to the resumption of
rapid economic growth.
In Ghana, the Economic Recovery Program was launched in April 1983,
involving a devaluation of the currency bj 1900 percent, and the adoption of a
flexible exchange rate system. Also, producer prices have been raised to a
considerable extent. However, in the pursuit of self-sufficiency, the
incentive system continues to favor import-substitution crops and further
increases in cocoa prices would be necessary for the full exploitation of
Ghana's production potential.
Conclusions
This paper has provided evidence on the effects of the policies
applied on economic performance in Sub-Saharan Africa, with emphasis given to
agriculture. It has been shown that exports in general, and agricultural
exports in particular, are highly responsive to changes in the real exchange
rate. In fact, exports are more responsive to price incentives in Sub-Saharan
Africa than in developing countries in general.
It has further been shown that market-oriented countries generally
gained, and interventionist countries lost, export market shares as the
- 20
-rates and did not appreciably bias the system of incentives against exports.
The differences in policies, and in export performance, are even greater if
comparisons are made between private market economies and etatist countries in
a three-fold classification scheme that puts some countries in an intermediate
group.
Kenya and the Ivory Coast exemplify market-oriented, and Tanzania and
Ghana interventionist, countries in Sub-Saharan Africa. The paper has made
pair-wise comparisons between Kenya and Tanzania and between the Ivory Coast
and Ghana, indicating the superiority of the market-oriented approach in
- 21
-REFERENCES
Balassa, Bela, "Adjustment Policies and Development Strategies in Sub-Saharan
Africa, 1973-78," Moise Syrquin, Lance Taylor, and Larry E. Westphal,
eds., Economic Strategy and Performance, Essays in Honor of Hollis B.
Chenery, New York, Academic Press, 1984, pp. 317-40.
Balassa, Bela, "Economic Incentives and Agricultural Exports in Developing
Countries," presented at the Eighth Congress of the International Economic
Association held in New Delhi, India in December 1986. To be published in
the Proceedings of the Congress (cited as Balassa, 1988).
Cleaver, Kevin M., "The Impact of Price and Exchange Rate Policies in
Agriculture in Sub-Saharan Africa," World Bank Staff Working Paper No.
728, Washington, D.C., World Bank, 1985.
Ellis, Frank, "Agricultural Price Policy in Tanzania," World Development, May
1985.
Culhati, Ravi, Bose Swadesh, and Vimal Atukorala, "Exchange Rate Policies, in
Eastern and Southern Africa, 1965-1983," World Bank Staff Working Paper
No. 720, Washington, D.C. World Bank, 1985.
Jabara, Cathy L., "Agricultural Pricing Policy in Kenya," World Development,
May 1985, pp. 611-26.
Lele, Uma, "Tanzania: Phoenix or Icarus?" in Arnold C. Harberger, ed. World
Economic Growth, San Francisco, Institute for Contemporary Studies, 1984,
pp. 159-96.
Lele, Uma, "The Role of Price and Non-Price Factors in Explaining Sources of
Growth in East African Agriculture: Some Lessons for Governments and
Donors," Washington, D.C., World Bank, January 1988 (mimeo).
Meyers, Kenneth, "Agricultural Policy and Performance in Tanzania,"
Washington, D.C., World Bank, September 1986 (mimeo) cited as 1986a.
Meyer., Kenneth, "Agricultural Policy and Performance in Kenya," Washington,
D.C., World Bank, September 1985 (mimeo); cited as 1985b.
Sherbourne, Lynn, "Agricultural Policy and Performance in Ghana," Washington,
D.C., World Bank, September 1985 (mimeo); cited as 1985a.
Sherbourne, Lynn, "Agricultural Policy and Performance in the Ivory Coast,"
Washington, D.C., World Bank, September 1985 (mimeo); cited as 1985b.
Stryker, J. Dirck and Lewis E. Brandt, "Price Policy in Africa," Washington,
D.C. Associates for International Resources and Development, September
- 22
-Summera, Robert and Alan Heston, "Improved International Comparisons of Real
Product and Its Composition, 1950-80," Review of Income and Wealth, June
1984, pp. 207-62.
PPR Working Paper Series
Title Author Date Contact
WPS43 Tax Administratlon in Developing Countries: Strategies and Tools
of Implementation Tax Administration Division
WPS44 The Size and Growth of Government
Expenditures David L. Lindauer
WPS45- Assigned to WDR WPS60
WPS61 Student Performance and Schools Costs
in the Philippines' High Schools Emmanuel Jimenez August 1988 T. Hawkins Vicente Paqueo 33678 Ma. Lourdes de Vera
WPS62 Status of Universities in the Arab Countries of th- Middle East and
North Africa George 1. Za'rour
WPS63 Does Japan Import Less Than It Should? Kenji Takeuchi July 1988 J. Epps 33710
WPS64 Cocoa and Coffee Pricing Policies
in Cote d'lvoire Takamasa Akiyama August 1988 D. Gustafson 33714
WPS65 Interaction of Infant Mortality and Fertility and the Effectiveness of
Health and Family Planning Programs Howard Barnum July 1988 S. Ainsworth 31091
WPS66 Slowing the Stork: Better Health for
Women through Family Planning Anthony R. Measham July 1988 A. Manciano Roger W. Rochat 33226
WPS67 Price and Tax Policy for
Semi-Subsistence Agriculture in Ethiopia Robert D. Weaver August 1988 D. Gustafson Saad Ali Shire 33714
WPS68 A Comparison of Lamps for Domestic
Lighting in Developing Countries Robert van der Plas
WPS69 Does Local Financing Make Public Primary Schools More Efficient?
The Philipp ne Case Emmanual Jimenez August 1988 T. Hawkins Vicente Paqueo 33678 Ma. Lourdes de Vera
PPR Working Paper Series
Title Author Date Contact
WPS70 Vocational Education and the Economic Environment: Conflict or
Convergence? Arvil V. Adams Antoine Schwartz
WPS71 School Effects on Student Achievement
in Nigeria and Swaziland Marlaine Lockheed August 1988 T. Hawkins Andre Komenan 33678
WPS72 The Relative Efficiency of Public
Schools in Developing Countries Emmanuel Jimenez August 1988 T. Hawkins Marlaine Lockheed 33678 Vicente Paqueo
WPS73 Taxation and Output Growth: Evidence
from African Countries Jonathan Skinner
WPS74 Fiscal Stabilization and Exchange Rate Instability: A Theoretical Approach and Some Policy Conclusions Using
Mexican Data Andrew Feltenstein August 1988 A. Bhalila Stephen Morris 60359
WPS75 Welfare Dominance and the Design of
Excise Taxation in the Cote d'lvoire Shlomo Yitzhaki August 1988 A. Bhalla Wayne Thirsk 60359
WPS76 On the Shadow Price of a Tax
Inspector Shlomo Yitzhaki Yitzhak Vakneen
WPS77 Incentive Policies and Agricultural
Performance in Sub-Saharan Africa Bela Balassa August 1988 N. Campbell 33769
WPS78 Economists, Institutions and Trade
Restrictions: A Review Article J. Michael Finger
WPS79 Quantitative Appraisal of
Adjustment Lending Bela Balassa August 1988 N. Campbell 33769