IT 15 020
Examensarbete 30 hp
March 2015
Context-Aware Mobile Sensing
for Safe Driving
Georgios Fotopoulos
Institutionen för informationsteknologi
Department of Information Technology
Teknisk- naturvetenskaplig fakultet UTH-enheten Besöksadress: Ångströmlaboratoriet Lägerhyddsvägen 1 Hus 4, Plan 0 Postadress: Box 536 751 21 Uppsala Telefon: 018 – 471 30 03 Telefax: 018 – 471 30 00 Hemsida: http://www.teknat.uu.se/student
Abstract
Context-Aware Mobile Sensing for Safe Driving
Georgios Fotopoulos
Safe driving has always been an important topic since the begging of vehicle era. Over the years, vehicles have improved regarding the safety aspects. Studies showed that, most traffic accidents are caused due to human error. Statistics in Europe show that approximately 10-20% of all traffic accidents are due to diminished vigilance of drivers due to, e.g., fatigue or negative emotion.
Previous research has demonstrated that not only does listening to suitable music while driving not impair driving performance, but it could lead to an improved mood and a more relaxed body state (e.g., decreasing the high breath rates of drivers when they are fatigued), which could improve driving performance and promote safe driving significantly.
This thesis will try to explore how smartphones could help drivers by playing the correct music back to them. Nowadays, smartphones' capabilities are extremely high thus, makes them a perfect development platform. The thesis will present a mobile application that analyzes the driving based on sensor data.
Different user tests were performed to validate that the application is promoting safe driving by playing the correct music to the driver.
Tryckt av: Reprocentralen ITC IT 15 020
Examinator: Justin Pearson Ämnesgranskare: Atis Elsts Handledare: Edith Ngai
Acknowledgements
I would like to thank my supervisor Edith Ngai for giving me the chance to involve in this project and for the many advices and feedback for this Master’s Thesis. Finally, I want to thank my family for supporting and trusting me during all my studying career. Without them, I would have not reached this point.
Disclaimer
This Master thesis has been conducted in collaboration with University of British Columbia in Vancouver, Canada. Parts of the work have been already presented and published before. Thus, some of the text have been quoted verbatim.
The previous publications are [1] [2]
Contents
Acknowledgements i Disclaimer ii Contents iii List of Figures v 1 Introduction 1 1.1 Internet of Things. . . 1 1.2 Related work . . . 2 1.3 Objectives . . . 4 1.4 Thesis structure . . . 4 2 Background 6 2.1 Intro to the Android Platform . . . 62.1.1 System Architecture . . . 7
2.1.2 Application framework . . . 8
2.1.3 Application and Activity Lifecycle. . . 8
2.1.4 Android Services . . . 10
2.1.5 Android Location and Connectivity . . . 11
Android Location . . . 11
Connectivity . . . 11
Bluetooth Low Energy . . . 12
2.2 OBD . . . 12 2.2.1 J1962 Connector . . . 14 2.2.2 Signal Protocols . . . 14 3 Tools 16 3.1 ELM327 adapter . . . 16 3.1.1 ELM327 chip . . . 16 3.1.2 ELM327 communication . . . 17 3.2 OBDSim . . . 18 3.3 Polar H7 . . . 19 iii
Contents iv
3.4 Programming Tools and SDK . . . 19
4 Project Implementation 21 4.1 System Architecture . . . 21 4.2 Data Collection . . . 22 4.2.1 OBD . . . 22 4.2.1.1 Conversion Method . . . 23 Speed. . . 23 Engine RPM. . . 24 Throttle Position . . . 25 4.2.2 Heart Rate . . . 25 4.2.3 Camera . . . 26
4.2.4 GPS and traffic API . . . 27
Encountered Problems . . . 28
4.3 Data analysis & Mood Algorithm . . . 28
4.4 Facebook Integration . . . 30
5 Experiments and Evaluation 32 5.1 User Interface . . . 32
5.2 Experiment & Results . . . 33
5.3 Overhead . . . 37
6 Conclusions 39
List of Figures
1.1 Torque Pro real time data display and diagnostic trouble codes. . . 2
1.2 A screen captured from iOnRoad application . . . 3
2.1 Android architecture[16] . . . 7
2.2 Activity lifecycle[17] . . . 9
2.3 Anroid service lifecycle[17] . . . 10
2.4 J1962 female connector[21] . . . 14
3.1 The block diagram of ELM327 chip[21] . . . 17
3.2 ELM327 USB and Bluetooth. . . 17
3.3 The user interface of the OBDSim . . . 18
3.4 The Polar H7 Heart Rate Sensor . . . 20
4.1 Block Diagram of the System Architecture . . . 21
4.2 The device list activity . . . 22
4.3 OBD query sequence . . . 24
4.4 Facial Expression and Eye-lid Detector . . . 27
4.5 Structure of the data used in the driver’s mood-fatigue detector . . 29
4.6 Working flow of the mood-fatigue detector . . . 29
4.7 Facebook SDK architecture . . . 31
4.8 Social network account log in . . . 31
5.1 User Interface of SafeDj . . . 33
5.2 A map showing the test route . . . 34
5.3 Comparisons of drivers’ fatigue degree . . . 35
5.4 Comparisons of drivers’ negative mood degree . . . 35
5.5 Comparisons of drivers’ throttle position . . . 36
5.6 Comparisons of drivers’ fatigue in long trips . . . 37
5.7 CPU overhead of SafeDJ . . . 37
5.8 GPU overhead of SafeDJ . . . 38
5.9 Power overhead of SafeDJ . . . 38
Chapter 1
Introduction
According to the statistics published by the World Health Organization (WHO), 1.2 million people die and 50 million people are injured or disabled on roads every year[3]. Statistics in Europe show that approximately 10-20% of all traffic accidents are due to diminished vigilance of drivers due to, e.g., fatigue or negative emotion. Previous research has demonstrated that not only does listening to suitable music while driving not impair driving performance, but it could lead to an improved mood and a more relaxed body state (e.g., decreasing the high breath rates of drivers when they are fatigued), which could improve driving performance and promote safe driving significantly.
1.1
Internet of Things
The Internet of Things (IoT) is a scenario in which objects, animals or people are provided with unique identifiers and the ability to automatically transfer data over a network without requiring human-to-human or human-to-computer interaction. A thing in Internet of Things, can be a person with a heart monitor implant, an animal with a biochip transponder, an automobile that has built-in sensors to alert the driver when something is wrong with the vehicle or any other object that can be assigned an IP address and provided with the ability to transfer data over a network. As the development of the Internet of Things (IoT) [4], a growing number of sensors are in deployment over last decades. Typically, the IoT is expected to offer advanced connectivity of devices, systems, and services
Chapter 1. Introduction 2 that go beyond machine-to-machine communications (M2M) and cover a variety of protocols, domains, and applications. One of the top ten industries where Internet of Things evolves is the automobile industry. Internet will become common in cars, thus, the growth of smartphone applications that target cars and drivers will radically increase.
1.2
Related work
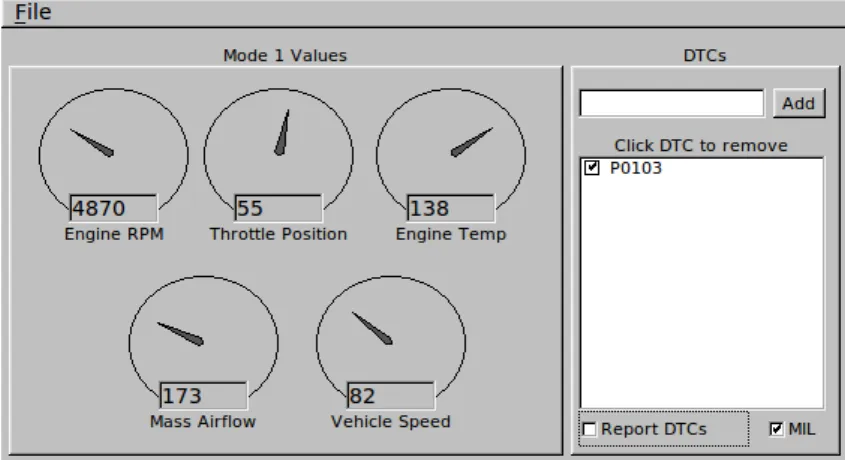
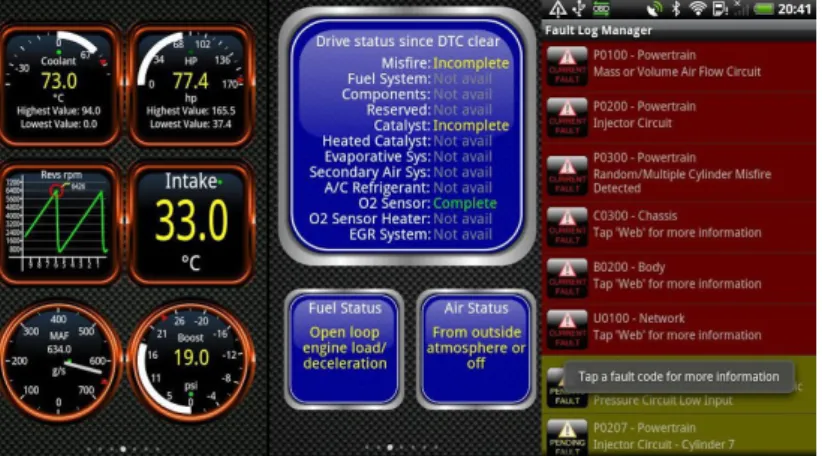
Nowadays, various vehicle oriented applications exist in the market. The most known application is the Torque [5]. This application is able to read different type of data (vehicle speed, engine speed, intake air, air temperature...) and Diagnostic Trouble Codes (DTC) from the car’s Engine Control Unit (ECU). Torque is also offering record option for the data. In figure1.1is the Torque application in action reading and displaying real time data.
Figure 1.1: Torque Pro real time data display and diagnostic trouble codes.
Currently, in-vehicle technological approaches for safe driving,such as V-Cloud[6], CrashHelp [7], and LCCA system [8], have great potential as relevant and effective tools to address fatigue. For safe driving, noninvasive techniques are at present being employed to assess a driver’s alertness level through the visual observation of his/her physical condition using a camera and state-of-the-art technologies in computer vision [9]. These works played an important part in detecting mood and fatigues, but have no incentive or solution to raise a better driving experience which makes drivers happier and less fatiguing. Moreover, there is no incentive scheme for drivers in large scale, which can stimulate their happiness and promote safe driving collaboratively with friends in a social context.
Chapter 1. Introduction 3 In [6], vehicle network and cloud computing are combined to testify the potential of those intelligent transportation system. [7] gives solution to provide emergency medical events across an end-to-end continuum of patient care. And [8] introduces a system to avoid vehicle collision with the help of vehicle sensors. Moreover, in [10] and [11] , the applications promote safe driving by utilizing the smartphone sensors such as accelerometer along with car’s sensors. In addition, applications like Foot-LITE[12] assist the driver by informing him when to change gears and by notifing him about the upcoming traffic with the use of Lane departure warning (LDW) cameras.
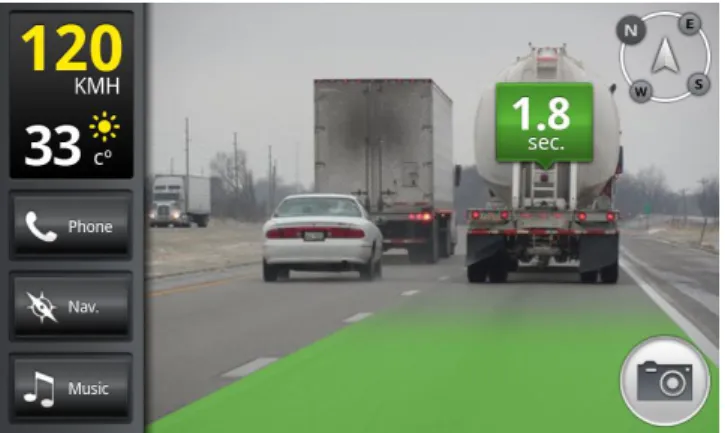
[9] suggests techniques such as using cameras and state-of-the-art technologies in computer vision to address fatigue. Fatigue and mood can be interrelated as some extreme expression of mood could be viewed as part of a fatigue. Another application called iOnRoad [13] measures the distance to the front ar by using the smartphone camera. By processing the image, it can detect risk and notifies the driver. In figure 1.2 is a screen capture of the application where the application measures the distance and computes the distance time by calculating the speed of the vehicle and the distance.
Figure 1.2: A screen captured from iOnRoad application
There are also some related works concerning with fatigue alert for safe driving and developed detection systems. [14] develops a non-intrusive system, which can detect fatigue of the driver and issue a timely warning. Till now, most techniques which detect fatigue don’t include other information such as rpm of the car, posi-tion of throttle input, car speed, heart rate of the driver, in-car temperature. As in-vehicle technological approaches are proposed for solving all kinds of prob-lems related to safety, the research and this master thesis focuses on the analysis
Chapter 1. Introduction 4 of the driver’s mood and fatigue and discusses the broaden usage of those infor-mation.
1.3
Objectives
The overall aim would be to create an application that can provide information and feedback(music) to the driver depending on the driving behavior. The appli-cation would be able to collect information from the car, driver and environment. Depending on these three factors the application should be able to make reports and store a pattern behavior for the driver and the car.
After the collection of the data, the application should be able to calculate the data and a music should be played back to the driver as feedback. For example, if the application addresses the driver as angry and/or aggressive a matching music should be played back to the user in order to promote safe driving.
The research questions that can be derived and will be answered in this thesis are:
• How to use the sensors in vehicles to monitor the driving behavior and promote the safe driving.
• Investigate ways to expand the application by using different smartphone sensors.
For my Master’s Thesis I focus on the on the communication process between the application , OBD-II device located in the car and the Heart Rate Sensor along with the data analysis.My Master’s Thesis does not focus on the implementation of the music algorithm and camera sensing.
1.4
Thesis structure
The document is structured as follows: In Chapter 2 a more detailed background is described to prepare the reader for the implementation. Then, in Chapter 3 all the tools that were used are introduced and explained. In Chapter 4 the implementation of the project is described. Afterwards, in chapter 5 we present
Chapter 1. Introduction 5 the experiments and the results that we conducted. Finally, in chapter 6 is the conclusion with the future work.
Chapter 2
Background
Since the advent of the smartphone, one can argue that everyday life has be-come much easier. Tasks such as communication and geographical location have all been changed since we allow applications to be developed and deployed on smartphones. The number of smartphones sold per year surpasses the number of the computers sold per year a couple of years ago. The continuous growth in smartphones brings a new era; changing the way of how smartphones inter-act with the humans. In recent years, the capabilities of mobile devices such as smartphones have improved substantially. These capabilities include significant computational resources (processing capability, local storage), multiple commu-nication radios (second/third/fourth generation cellular, WiFi, Bluetooth, WiFi Direct, etc.), various sensing modules (cameras, accelerometer, gravity sensors, etc.), and high level programming languages (Java in Android, Object C in iOS), which enable mobile devices to form mobile cyber-physical systems (CPS) and support many novel mobile applications in our daily lives.
2.1
Intro to the Android Platform
Android is a software-platform and an operating system for mobile devices such as smartphones, netbooks and tablets. It is developed by the Open Handset Al-liance (OHA)[15] founded by Google Inc. and 33 partner companies. Android was published as an open-source software under the Apache Software License 2.0 and therefore enables the developer to access all software and hardware components of the device. The success of Android OS is confirmed by several studies on mobile
Chapter 2. Background 7 operating system usage. For example Android’s worldwide market share in mo-bile smartphone sales in the third quarter of 2014 has been estimated to 84.4%, followed by Apple’s iOS (11.7%) and Windows phone (2.9%) .
In this chapter, a short introduction to the Android platform is given with re-spect to Android’s system architecture and framework, application life-cycle and available programming tools. A specific focus is being given to particular aspects, which are relevant for this thesis. Furthermore, this chapter provides only basic information about Android OS.
2.1.1
System Architecture
The Android architecture consists of several elements as shown in Figure2.1. The lowest layer is composed of a Linux kernel optimized for mobile devices. This makes it possible to use Android on devices of different manufactures and hard-ware. The Libraries layer contains efficient C-based libraries, like Android’s
built-Figure 2.1: Android architecture[16]
in database system SQLite and OpenGL for 3D graphics. All these libraries define a basic set of function for the upper layers. Furthermore, the Android runtime pro-vides a Virtual Machine (VM) called Dalvik[16]. Following there is the application framework which contains helper classes for implementing Android applications.
Chapter 2. Background 8 It also manages the hardware access for the application, user interface ( UI ) and the resources[17].
The top layer is called application layer. It is visible to the user and includes native application from the manufacturer, Play store or unknown developments. All the applications are written in Java programming language but the Native Development Kit ( NDK ) allows to program some parts of the application in C/C++.
2.1.2
Application framework
This section introduces the basic components available to developers in order to giver the reader a better understating about the development of the application. All the following elements are provided by the framework and are the base for every Android application:
• Activity: Activities are the application components that provide a screen with which users can interact in order to do something, such as dial the phone, take a photo, send an email, or view a map. Each activity is given a window in which to draw its user interface. The window typically fills the screen, but may be smaller than the screen and float on top of other windows.
• Service: Services run in background threads and does not provide a user in-terface. Their main role is to perform processing, even when the applications’ activities are not active or visible to the user.
• Intent: Intents are used for communication between Activities and Services.
• Broadcast Receiver: A broadcast receiver listens for particular Intents and performs specific actions when it receives one.
2.1.3
Application and Activity Lifecycle
An Android application consists of Activities and Services which are created and destroyed during the runtime of the application. The state of the application
Chapter 2. Background 9 is depending on what the user is currently doing. Most of the times, when an application is started, the first Activity is being shown. The user then can nav-igate to other Activities. In parallel with the Activities different services can be started or stopped automatically. Because of the different services and intents that are started and/or stopped the applications’ lifecycle is strongly depending on the desired functionality. Every Activity has a predefined lifecycle as show in Figure2.2.
Figure 2.2: Activity lifecycle[17]
When an Activity is being started, the onCreate() method is always called. In order for the Activity to arrive into running state the methods onStart() and onResume() are called one after the other. These three methods can be used to initialize the Activities. If the Activity looses focus, the function onPause() is called and it stays there until when the activity becomes active again the method onResume() is called. The Activity can be killed either by the user or the system e.g. If the user presses the back button the methods onStop() and onDestroy() are executed respectively.
Chapter 2. Background 10
2.1.4
Android Services
An Android service is a component similar to an activity but without a user interface. It is intended to execute long time operation in the background. Android services can be started from other application components e.g activities and also services can start activities. Services can be binded with activities in order to exchange information or interact with each other.
Like the activity, a service has its own lifecycle. In figure 2.3 is the Android service lifecycle. As it is shown, services can have two different types of lifecycles depending on the way that they are started.
Figure 2.3: Anroid service lifecycle[17]
The two ways to start a service are:
• Calling the startService()
• Calling the bindService()
If the service is started with startService(), the lifecycle is similar to an activity. The service is started, theonCreate() andonStart() methods will be called. When the service is stopped, the onDestroy() method is called.
Chapter 2. Background 11 If the service is started by calling thebindService() method, the lifecycle changes. Upon binding a service from another component, a client-server interface is created for the interaction between them. There can be multiple components bound to the same service. The first components that binds first is the one that starts the ser-vice. When this happens, theonCreate()method will be executed and respectively the onDestroy() method will be called when any components are bounded.
2.1.5
Android Location and Connectivity
Android Location
Different applications may want to know the location to the user, in order to provide smart features. For example, a weather forecasting application can of-fer the user specific forecast for the specific user location. Moreover, navigating application utilize this feature by providing point to point navigation to the user. Android devices offer two ways of locating the device. The most popular and the most accurate one is the GPS ( Global Positioning System). However, the GPS locating mechanism can only be used outdoors and it consumes a lot of energy. The second location strategy is by using the networks. The Android Network Location Provider is able to obtain an approximate user location from the cell towers and Wi-Fi signals. The accuracy of the location differs between Wi-Fi and cell towers. The advantage with this strategy is that it works indoors and provides location response faster than the GPS.
Both of the two mentioned strategies provide the location by returning geographi-cal coordinates (latitude and longitude). However, the Android provides to devel-opers different mechanism to convert these coordinates into more understandable information such as address, city or country.
Connectivity
Android devices have multiple communication interfaces and that makes them usable in vehicular environments. The smartphones can access the Internet via their mobile network access (GSM, HSPA, LTE) or Wi-Fi. Another important communication interface is Bluetooth. It is mainly used to communicate with devices that are in short range. In this project, the Bluetooth interface will be used to communicate with an OBD-II adapter and the Polar H7 heart rate sensor.
Chapter 2. Background 12 Because of the wireless communication the Bluetooth makes the best and the easiest way to communicate in a vehicular environment.
Bluetooth Low Energy Bluetooth Low Energy (smart) [18] is a wireless per-sonal area network technology aiming at novel applications in the healthcare, fit-ness, beacons, security, and home entertainment industries. Compared to Classic Bluetooth, Bluetooth Smart is intended to provide considerably reduced power consumption and cost while maintaining a similar communication range. All Blue-tooth Smart devices use the Generic Attribute Profile (GATT).
GATT has the following terminology:
• Client A device that initiates GATT commands and requests, and accepts responses, for example a computer or smartphone.
• Server A device that receives GATT commands and requests, and returns responses, for example a temperature sensor.
• Characteristic A data value transferred between client and server, for ex-ample the current battery voltage.
• Service A collection of related characteristics, which operates together to perform a particular function. For instance, the Health Thermometer service includes characteristics for a temperature measurement value, and a time interval between measurements.
• DescriptorA descriptor provides additional information about a character-istic. For instance, a temperature value characteristic may have an indication of its units (e.g. Celsius), and the maximum and minimum values which the sensor can measure. Descriptors are optional - each characteristic can have any number of descriptors.
• IdentifiersServices, characteristics, and descriptors are collectively referred to as attributes, and identified by Universally unique identifier (UUIDs)
2.2
OBD
On Board Diagnostics ( OBD ) is an automotive term referring to a vehicle’s self-diagnostic and reporting capability. It enables a user to access his vehicle’s
Chapter 2. Background 13 condition and behavior using OBD. Thus, it is widely used by mechanics to check the vehicle’s condition and access to the status of various vehicle subsystems. Different versions of the OBD have been developed since its first implementation. Early versions of OBD would simply illuminate a malfunction indicator light or ”idiot light” if a problem was detected but would not provide any information as to the nature of the problem. Modern OBD implementations use a standardized digital communications port to provide real-time data in addition to a standardized series of diagnostic trouble codes (DTC), which allow one to rapidly identify and remedy malfunctions within the vehicle[19].
The retrieval of the data is being achieved by the use of OBD-II PIDs (On-board diagnostics Parameter IDs). PIDs are codes used to request data from a vehicle, used as a diagnostic tool.The response from the OBD is in the form of; Id of the module responded and the data. So, the responses are based on the type of data requested by the ELM device. For instance, let’s consider the same RPM parameter. The response for the PID sent would be a total of 4 bytes. The first two bytes represent the response as identification to mode 1. The next two bytes contain the encoded RPM values in Hexadecimal format. So, to get the actual value, these hexadecimal values are to be converted to decimal format. The PIDs are divided in ten modes of operation. Each mode is used to request different types of data. The operational modes are the following:
• Mode 01: This mode is used to retrieve the real time data e.g. Mass airflow, vehicle speed, engine RPM, throttle possition etc.
• Mode 02: This mode is used to retrieve freeze frame data.
• Mode 03: This mode is used to retrieve the stored DTC
• Mode 04: Allows to clear the DTCs and stored freeze frame data.
• Mode 05: Test results, oxygen sensor monitoring (non CAN only)
• Mode 06: Test results, other component/system monitoring (Test results, oxygen sensor monitoring for CAN only)
• Mode 07: Show the pending DTCs (detected during current or last driving cycle)
Chapter 2. Background 14
• Mode 09: Request vehicle information, e.g. Vehicle Identification Number (VIN)
• Mode 0A: Lists the permanent diagnostic trouble codes.
OBD has been mandatory to all vehicles in the United States of America after 1996 and in Europe after 2001. After 2004, Europe made it mandatory even to vehicles using diesel fuel. Different names have been given eg. OBD-II in the United States of America and EOBD in Europe. But the regulations for both OBD-II and EOBD are the same[20].
2.2.1
J1962 Connector
Nowadays, OBD-II is a general hardware interface with a 16pin (2x8) J1962 female connector as shown in Figure 2.4. It has to be placed within half meter from the steering wheel, in order to be reach from the driver.
Figure 2.4: J1962 female connector[21]
2.2.2
Signal Protocols
There are five signaling protocols that are permitted with the OBD-II interface.[22]
• SAE J1850 PWM ( Pulse-Width Modulation ) – 41.6 kB/sec, standard of the Ford Motor Company. Uses the pin 2 (Bus +) and pin 10 (Bus -) of the J1962 connector.
• SAE J1850 VPW ( Variable Pulse Width ) — 10.4/41.6 kB/sec, standard of General Motors. Uses the pin 2 (Bus +) of the J1962 connector.
• ISO 9141-2 asynchronous serial data in 10.4 baud, similar to RS-232. Uses the pin 7 (K-line) and optionally, for wakeup, the pin 15 (L-line) of the J1962 connector.
Chapter 2. Background 15
• ISO 14230 KWP2000 ses the Keyword Protocol 2000 (KWP2000) with the same physical layer as ISO 9141-2 with a data rate between 1.2 to 10.4 kBaud. It also uses the pin 7 (K-line) and optionally the pin 15 (L-line) of the J1962 connector.
• ISO 15765 CAN controller area network bus. It can provide 250 kBit/s or 500 kBit/s. Unlike the other protocols it is widely used outside the automo-tive industry. It uses the pin 6 (CAN High) and pin 14 (CAN Low) of the J1962 connector.
Pin number Description
1 Manufacturers discretion 2 SAE J1850 Line (Bus +) 3 Manufacturers discretion 4 Chassis Ground
5 Signal Ground
6 SAE J2284 (CAN High)
7 K Line of ISO 9141-2 & ISO/DIS 4230-4 8 Manufacturers discretion
9 Manufacturers discretion 10 SAE J1850 Line (Bus -) 11 Manufacturers discretion 12 Manufacturers discretion 13 Manufacturers discretion 14 SAE J2284 (CAN Low)
15 L Line of ISO 9141-2 & ISO/DIS 4230-4 16 Unswitched Vehicle Battery Positive
Chapter 3
Tools
In this chapter, all the main tools that were used in the development of the project are presented.
3.1
ELM327 adapter
On-Board Diagnostics as explained in section 2.2 has a the drawback that not all communication protocols are compatible with computers or mobile devices. To overcome this, Elm Electronics developed the ELM327[23][21].
3.1.1
ELM327 chip
The ELM327 is ready to be connected directly to the OBD port. In the block diagram (Figure 3.1) there are two pins (RS223 RX and RS232 TX that are in charge to carry the communication to the computer or other device. Furthermore, the ELM327 has also several pins connected directly to LED, in order to indicate the transmission through the OBD and RS232 interfaces[21].
Because of RS232 interfaces are not much supported in laptops most of the ELM327 implementations include a bridge to adapt the RS232 to another interface. Most of the implementations use USB but nowadays, recent implementations support Bluetooth or Wi-Fi interfaces for wireless communication as in figure3.2
Chapter 3. Tools 17
Figure 3.1: The block diagram of ELM327 chip[21]
Figure 3.2: ELM327 USB and Bluetooth
3.1.2
ELM327 communication
The communication with the ELM327 is done by using ASCII characters. The ELM327 is able to receive configuration commands called AT Commands. The AT commands begin with characters “AT” and followed by the desired command. For example, if we want to reset the ELM327 device the command ”AT Z” must be send and the device will do a reset.
The OBD commands contain only the ASCII codes for hexadecimal digits. For example if we want to get the value of the vehicle speed, the command ”01 0D” must be send and the number in ASCII characters will be received.
All of the messages are to be terminated with a carriage return character within 20 seconds, otherwise the ELM device will abort the complete message.
Chapter 3. Tools 18
3.2
OBDSim
The OBDSim (OBD GPS Logger)[24] is an application with several tools related to the OBD. The application offers the ability to log driving trips into a database. OBD GPS Logger offers a module called OBDSim, its main function is to emulate an ELM327 device connected to the OBD interface of a vehicle. This tool is very important because it allows the development of OBD related application without the need of a vehicle. OBDSim will also prompt a terminal screen where all the communication will be logged. Information such as the connection or disconnection, the AT commands and the total queries are visible to the user through this terminal.
There are three different ways to provide emulated data with OBDSim.
• Graphical User Interface
• Random
• Logged trip
In figure 3.3 is the user interface of the OBDSim that can be used to provide specific values to the simulator. The drawback of using the user interface is that the number of the available parameters is limited.
Figure 3.3: The user interface of the OBDSim
The second way to get data is in a random way. This means that the values are changing constantly. The drawback in this scenario is that the values are not correlated with each other, so no conclusion can be made.
Chapter 3. Tools 19 The third and the most realistic way to collect data is to use a previously logged trip. The same SQL file recorded by the OBD GPS Logger application can be used by the OBDSim to provide realistic data. The application developer offers some recorded trips in the webpage[24] for this reason.
There are different ways to connect to the OBDSim such as (USB, Bluetooth and Wi-Fi).The one that we are interested in is to connect through Bluetooth from an Android smartphone. OBDSim runs in both Linus and Windows operating systems. The Bluetooth communication must run on a free channel of the com-puter’s Bluetooth so some modification must be done. First, we need to create a new channel for our Bluetooth communication. This is done by creating a new inbound COM (serial) port in the Bluetooth settings. In our case a port with the name COM3 was added.
To start the OBDSim, it needs to be done from the command line. For example, to execute the simulator using Bluetooth (channel 3) with the graphical interface, the following command must be executed:
obsim -b -g g u i _ f l t k -w COM3
After the completion of the above steps, the OBDSim is ready to accept devices and start communicating.
3.3
Polar H7
The Polar H7 Heart Rate[25] is a sensor used to measure the heart rate of the user. It is compatible with Bluetooth smart ready devices that support heart rate service. A sensor as shown in figure 3.4 used for the needs of the master thesis.
3.4
Programming Tools and SDK
Several Android development tools have been used for the development of the application. These tools are:
• Eclipse and Android Developer Tools (ADT) plug-in: Eclipse is an Integrated Development Environment (IDE). It is one of the most preferred tool for Android development. The Eclipse can be integrated with ADT.
Chapter 3. Tools 20
Figure 3.4: The Polar H7 Heart Rate Sensor
• Java Development Kit (JDK): JDK allows application to be developed in Java programming language.
• Android Software Development Kit (SDK): A software development kit which enables developers to create applications for the Android platform. The An-droid SDK includes sample projects with source code, development tools, an emulator, and required libraries to build Android applications. Different Application Programming Interface (API) levels have been released.
• Dalvik Debug Monitoring Service (DDMS): The DDMS is a debugging in-terface between the IDE and the application. It allows the developer analyze all the processes which are run on the emulator or on an Android device. Moreover, it allows debugging the source code with the use ob breakpoints.
Chapter 4
Project Implementation
In this chapter the system architecture is presented, the data collection and the data analysis is explained.
4.1
System Architecture
Figure 4.1: Block Diagram of the System Architecture
The system consists of four main components. The Android device, ELM327 device, OBD-II and the Polar H7 device. Figure 4.1 represents the system archi-tecture. The ELM327 device is connected to the car’s ECU through OBD-II as explained in section 2.4. The Android device is connected via Bluetooth to the ELM327 device and Polar H7 respectively.
Chapter 4. Implementation 22
4.2
Data Collection
4.2.1
OBD
In order to be able to communicate with the ELM327 chip, basic code must be written to handle the communication between the Android device and the ELM327 chip.
First of all, an Android activity must be created and executed when the user wants to connect his phone with the ELM327 chip. A prerequisite for the code to work is that the user needs to pair his Android smartphone with the ELM327 chip beforehand. The complete code consists of two activities, the main activity (OBDIIActivity.java) and the device list activity.
The OBDIIActivity.java starts the device list activity with the method startAc-tivityForResult(). This method allows the first activity to be on hold and when the second activity completes its execution, a result will be given back. To get the result, the device list activity utilizes the Android Bluetooth adapter. The BluetoothAdapter lets you perform fundamental Bluetooth tasks, such as initi-ate device discovery, query a list of bonded (paired) devices, instantiiniti-ate a Blue-toothDevice using a known MAC address, and create a BluetoothServerSocket to listen for connection requests from other devices. The activity starts device dis-covery with startDiscovery(). When the scan is complete, it populates a list with all the paired devices found as shown in figure 4.2
Chapter 4. Implementation 23 The selected device (result) is then returned to the first activity and the method onActivityResult() is executed. After the communication is established the follow-ing AT commands are sent to the ELM327 chip for initialization.
AT Command Description
ATD Set all to Defaults
ATZ Reset
ATE0 Echo off
ATM0 Memory off ATL0 Linefeeds off ATH0 Headers off
ATS0 printing of Spaces off ATSP0 Erase stored protocol
0100 OBD Monitor IDs supported
After the initialization sequence the ELM327 chip is ready to accept messages and parse them to the OBD. In section 2.4 was mentioned that in mode 01, we can request various type of real-time data from car’s ECU. For the needs of this thesis, the vehicle speed, the engine RPM and the absolute throttle position will be read. The sequence of the messages starting by sending first a speed query to the OBD. When the speed reply is recorded by the application the throttle query is sent, followed by its reply and finally the engine rpm query is sent. As seen in figure4.3
everytime a query is sent to the OBD, a reply must be read in order to continue the sequence of messages.
4.2.1.1 Conversion Method
As mentioned in section3.2the OBD commands contain only the ASCII codes for hexadecimal digits. Everytime a result is answered to a query, the value must be converted from Hexadecimal to Decimal format. Because of the different values are returned from the OBD, different calculation must be done in each reply separately. The response for the PID we sent would be a total of 4bytes. The first two bytes represent the response as identification to mode 1. The next two bytes contain the encoded values in Hexadecimal format. So, to get the actual value, these hexadecimal values are to be converted to decimal format.
Speed
Chapter 4. Implementation 24
Figure 4.3: OBD query sequence
value from the reply can be extracted, just by converting the hexadecimal value to decimal. The value that is returned is measured in km/h and the maximum value would be 255.
Engine RPM
For the Engine RPM the PID ”010C” must be sent respectively. The two last bytes of the value returned used in the following formula.
Engine RPM = ((A*256)+B)/4)
A and B represent the decimal equivalent of first and second bytes of data. The range of the RPM value obtained would be from a minimum of 0 to a maximum value of 16,383.75 revolutions per minute.
Chapter 4. Implementation 25
Throttle Position
”0111” would be the PID code to obtain the absolute throttle position. The re-turned number of bytes would be one. The value obtained would be in percentage % of throttle position. Assuming the returned decimal equivalent value is A, the formula would be
Throttle Position=(A*100/255)%
4.2.2
Heart Rate
Because the client has no knowledge about the attributes that might be present in a GATT server, it has to perform a series of packet exchanges to determine the amount, location, and nature of all the attributes that are available from the device. For the communication between the heart rate sensor and the smartphone two activities were needed.
The main activity (devicecontrolactivity.java) starts by getting a BluetoothAdapter initialized where an instance of Bluetoothmanager is returned. In order for the smartphone to discover a Bluetooth LE device, a version of Android 4.3 (API Level 18) and bigger is required.
1 final B l u e t o o t h M a n a g e r b l u e t o o t h M a n a g e r =
2 ( B l u e t o o t h M a n a g e r ) g e t S y s t e m S e r v i c e ( Context . B L U E T O O T H _ S E R V I C E ); 3 m B l u e t o o t h A d a p t e r = b l u e t o o t h M a n a g e r . g e t A d a p t e r ();
Listing 4.1: Initialization of the BluetoothAdapter
After the initialization, and upon user’s input the application will try to find a BLE device by using the startLeScan() method. After the heart rate device is found, the application will try to connect to the GATT server of the device. When the connection is established, the discovered services can be initiated by calling the bluetoothGatt.discoverServices() method. As the name implies, the goal of the following call is to determine what services the remote device sup-ports. A list then is populated with all the UUID the device support. Because the heart rate sensor is using the UUID of 0x2902, we need to search through the populated list to check if the heart rate we are asking is supported by the device. If the characteristic is found the notification of the BLE device is turned
Chapter 4. Implementation 26 on by using the mBluetoothGatt.setCharacteristicNotification(characteristic, en-abled); method. Everytime the Polar H7 Heart Rate sensor will send the heart rate measurement to the Android device, a callback is received in BluetoothGattCall-back.onCharacteristicChanged() and the heart rate value can be read.
1 public void o n C h a r a c t e r i s t i c C h a n g e d ( B l u e t o o t h G a t t gatt , 2 final B l u e t o o t h G a t t C h a r a c t e r i s t i c c h a r a c t e r i s t i c ) {
3 // get the HR value
4 byte [] data = c h a r a c t e r i s t i c . g e t V a l u e (); 5 }
Listing 4.2: Reading the Heart Rate Value
4.2.3
Camera
The application, to extract the facial expression and eye-lid information mainly uses the camera sensor to capture pictures of faces and processes them with OpenCV 2.4.9[26]. The emotions were divided in four classes: neutral, happy, sad and angry and define the Eye-lid as the distance from one’s upper lid to the lower lid. For the collection of the emotion, there are two procedures. The first is the Face Expression Recognizer (FER). Sensors used to collect the raw data of facial expressions, categorize them into four classes, and then train the FER using the eigenface algorithm [27] in OpenCV with these processed data. This train-ing will remove the environmental factors and build the intuitive “FER”. The eigenface algorithm is used to classify the captured photos into classifiers. The major eigenface method performs face recognition by firstly projecting all training samples into the PCA subspace, then projecting the query image into the PCA subspace and finally finding the nearest neighbor between the projected training images and the projected query image. The face alignment means unified cutting the captured faces into the same size and then using the image gray algorithm images. One of the simplest methods to gray it is to add all the RGB value of the pixels and isometric mapping to the gray value of 0-255. After these processes, the FER is finally built.
In order to detect the real-time faces and conclude the classes of them with the use of the Cascade Classifier[28] in OpenCV. Cascading is a particular case of ensemble learning based on the concatenation of several classifiers, using all information collected from the output from a given classifier as additional information for the
Chapter 4. Implementation 27 next classifier in the cascade. So that cameras continually capture the driver’s real-time facial pictures, and the algorithm based on Cascade Classifier, specifically using the file lbpcascadefrontalf ace.xml in OpenCV is used for face detection.
Then images of faces are sent to FER to decide the corresponding emotions. For example, as the red arrow shown in Figure 4.4, if the detected face is most similar to the existing ”happy” classifier, then it will be labeled as ”happy”.
Figure 4.4: Facial Expression and Eye-lid Detector
As for the collection of the Eye-lid, the eye-lid distance of the driver’s two eyes was used, to analyze the drowsy degree of the driver. The haarcascadeeye.xml and
Cascade Classifier in OpenCV used to implement the algorithm. Also as Figure4.4
shows, the detector uses two detection squares to capture the eyes and the length of side indicates the distance from one’s upper lid to the lower lid.
4.2.4
GPS and traffic API
The GPS antenna of the smartphone was used to get the location of the car. As explained in section 2.1.5 the Global Position System requires sky-view of the smartphone thus, makes it the best solution to get precise location of the car. In order to get the coordinates (longitude and latitude) a LocationListener class must be implemented in the application. The LocationListener allows to get the gps coordinates through the onLocationChanged(Location location) method. Ev-erytime the coordinates changes the above method is called automatically by the LocationListener. Then, in theonLocationChanged(Location location)method the .getlatitude() and .getlongitude methods were used to get both coordinates in de-grees.
After the collection of the coordinates, a search of public traffic API’s was con-ducted. The two APIs that were found are: Bing Traffic API and Mapquest API.
Chapter 4. Implementation 28 Both APIs can be accessed through a URL, e.g. listing 4.3, and then the answers can be returned to either in JSON or XML format.
1 http :// dev . v i r t u a l e a r t h . net /.../ I n c i d e n t s /37 , -105 ,45 , -94? key =... Listing 4.3: Traffic API url example
Encountered Problems Both of the APIs mentioned above require four coor-dinates in the url. In the listing 4.3 the four coorcoor-dinates are 37,-105,45,-94. This is because the API needs a rectangular area specified as a bounding box for the incidents. Only the incidents that are recorded in this box will be returned as result. Unfortunately, the bounding box could not be small enough e.g. size of three cars. The minimum size of the box was around 15km2, which is almost half
of Uppsala. Even if the box had not limitation for its size, another problem was that both of the APIs return only one location for the traffic. For example, if a road is 5km long, the APIs will return only one point on the road marked as ”heavy traffic”. Hence, the constantly comparison between the car’s coordinates and the coordinates of the mark is not sufficient.
4.3
Data analysis & Mood Algorithm
Based on the collected sensing data, a mood-fatigue detector has been designed that can analyze such data and infer the real-time mood-fatigue degree of the driver on a smartphone. As shown in figure4.5, to analyze the mood degree our detector analyzes: engine rpm, throttle input, speed, heart rate, in-vehicle temperature and facial expression. The fatigue analysis has four parts (Heart Rate, Eye-lid distance, In-Car Temperature and speed).
According to the statistics from the data, a mood-fatigue algorithm developed and the corresponding process is shown in figure 4.6 For mood, it can be inferred that a driver may turn aggressive with a relatively new car if the average RPM of vehicle is more than 4000 and the throttle input degree of the pedal is 100 percent. Also, it can be inferred that the patience of a driver, when co-consider the factors like in-car temperature, the road congestion situation and the speed. Therefore, the facial expression can be defined into four classes as the value 0,1,2 and 3 matching the neutral, happy, sad and angry. Finally, the mood degree feature
Chapter 4. Implementation 29
Figure 4.5: Structure of the data used in the driver’s mood-fatigue detector
Figure 4.6: Working flow of the mood-fatigue detector
is shown as a 3 dimensional representation. The first dimension represents the aggressiveness degree (0 yes, 1 no), the second dimension represents the patience degree (0 impatient, 1 pleasant) and the last dimension stands for the emotion degree (0 neutral, 1 happy, 2 sad, 3 angry). Smaller than zero, we can consider it as a fatigue factor, while the latter two influence the comfortable degree of drivers. As said above, the distance from one’s upper lid to the lower lid can also decide the driver’s normal average eyelid distance and then we can divide the data by this standard to get a relative percentage value. Moreover, the drivers may be kind of tired if the percentage is no more than 50 percent.
Chapter 4. Implementation 30
4.4
Facebook Integration
In this project we promote safe driving collaboratively with friends in a social context. That is why we integrated our Android application with Facebook. For the needs of the project we had to download the Facebook SDK for Android. To make the integration easier the android-simple-facebook SDK, a library project was downloaded.
Then a new Facebook app must be created through http://developers.facebook.com . By default the Facebook allows the developers to utilize the following permis-sions.
• public profile
• user friends
The public profile permission provides access to a person’s basic information, in-cluding first name, last name, profile picture, gender and age range. The email permissions returns the email of the Facebook user who wants to log in, and finally the user friends provides access to a person’s list of friends that also use the app. In order to be able to retrieve the above data from the user’s Facebook profile a different application must be created within Facebook. In our case, a Facebook app called SafeDJ was created and it will make the request instead of our An-droid application as shown in figure 4.7. In order for the Facebook app to accept queries from our Android application, some required information must be filled. In Facebook app we must specify the Google Play Package Name(com.safedj) and the Class Name of our Android application(com.safedj.SAfeDJ1 Activity). Finally, we must also provide the facebook with our app’s hash key. We can retrieve the hash key with the following command.
k e y t o o l - e x p o r t c e r t - alias < R E L E A S E _ K E Y _ A L I A S > - k e y s t o r e < R E L E A S E _ K E Y _ P A T H >
| op e n s s l sha1 - binary | o p en s s l base64
After the Facebook application knows our Android application’s information, we are able to make calls through the Facebook app. When the users want to share
Chapter 4. Implementation 31
Figure 4.7: Facebook SDK architecture
his context via Facebook a window is prompt for login as shown in figure 4.8 . The application checks everytime if he is logged in in order to perform the share post. If not the login window will be prompt and the user needs to accept the permissions which are asked. If the user does not accept the permissions the whole process will be aborted.
Chapter 5
Experiments and Evaluation
In this chapter the User Interface of the Android application will be explained, the experiments are mentioned with the result and finally the application’s overhead.
5.1
User Interface
As shown in Figure 6, the user interface of this mobile application are mainly composed of the followings. Figure 5.1a shows the main method and the function of the app. It displays the analysis of the driver’s mood and the fatigue degree, and then also prints them on the interface while playing recommended music accordingly. It visualizes the real-time states of the data collected by the different sensors with the use of bars (T = Temperature, RPM = Engine rpm, Sp = Speed of the vehicle, Tht = Throttle position, HR = Heart Rate and El = Eyelid distance); which are changing their size depending on the different values collected. Figure
5.1b shows that the user’s favorable music can also be saved. Figure 5.1c shows that it can check the account information (such as credit, number of music shared, or on-road friends). Figure 5.1d can be set by users to make some personalized configurations, such as whether to automatically upload the music to Facebook, and the frequency of such operation, etc. What’s more, according to different mood and fatigue shown on the main user interface, the music changed automatically. Figure5.1esuggests that when the driver clicks the share button on SAfeDJ, then the listening music could be automatically uploaded to the cloud server of SAfeDJ, and published in the user’s Facebook.
Chapter 5. Experiments and Evaluation 33
(a) Main UI (b) Favourite (c) Account
(d) Settings (e) Shared in facebook
Figure 5.1: User Interface of SafeDj
5.2
Experiment & Results
The application has been tested vigorously during the testing period. The tests took place on the same route for 5 drivers ( 3 male and two female ) with the age between 24-30. The route began at Polacksbacken, as shown in figure5.2, then to point A in the city and back to the starting point. The distance was 5 kilometers. The experiment was done in two steps. First the drivers had to drive around the route in the car without using the application’s feedback(music), but at the same time logging the data. Secondly, the same route was driven but this time with the feedback of the application ( music played to the user ). The music library was the same for all the drivers. Both steps were conducted under the same conditions
Chapter 5. Experiments and Evaluation 34 ( weather, car, tire pressure), the minimum time of the route was 10 minutes and the maximum 10 minutes and 23 seconds. Because the time for most of the drivers was close, the 10 minute and 0 seconds point was taken as measure for the plots that are following.
Figure 5.2: A map showing the test route
The data of each minute for all the drivers were summed up and divided by the number of the drivers in order for an average values to be found. The comparison results about drivers’ fatigue degree, negative mood degree and throttle position are summarized in figure 5.3, figure5.4 and figure 5.5 respectively.
In figure 5.3 is a plot of the drivers’ fatigue degree per minutes. In the Y-axis, the 0 is the 100% eyelid ( non fatigue ) and the 0.5 the 50% respectively. We can observe that the drivers’ fatigue degree is slowly increasing during driving when they do not listen to music with an average value of 0.45 (0.70 peak). In contrast, the drivers’ fatigue degree is the lowest when they listen music recommended by SAfeDJ during driving, and the related average value is only 0.23 (0.40 peak), which means it is 48.89% lower than not listening to music. The application will never adress the driver as fatigue if it does not compare the eyelide distance. If
Chapter 5. Experiments and Evaluation 35
Figure 5.3: Comparisons of drivers’ fatigue degree
we consider the human eye-blinking, the average value is approximately 10 times per minute; taking this under consideration the application may give an error estimation of minimum 16.6% and maximum 33.3% in addressing him fatigue. In both error estimations the overall result of ”non-fatigue” will not be affected.
Figure 5.4: Comparisons of drivers’ negative mood degree
The negative emotions of the drivers were measured also. In figure 5.4 the Y-axis is the percentage of the drivers’ negative emotions. In this figure only the negative facial expressions (sad, angry) and aggresiveness were measured. Each minute all the emotions were measured, then the negative emotions were calculated to find the percentage for every minute. We can understand that the drivers who did not listen to music while driving they tend to be more negative and aggressive with average value of 0.225(22%). While listening to the recommended music from
Chapter 5. Experiments and Evaluation 36 SafeDJ the average value of negative emotions was at 0.115(11%); a decrease of 48.89%. Thus, listening to the right music while driving will have a big impact on your mood and your driving behavior. In figure 5.5 we particularly measured the throttle position input in percentage. A normal drive without listening to music will bring an average throttle input of 17.90% with peak 34%. Whereas, the average number for the throttle while listening to music is 13%. A decrease of 27.37%. We have proven that drivers tend to drive smoother while listening to music; As a result driving smoother, the fuel consumption will drop, the amount of wear and tear on the car will be reduced as well as the CO2 emiisions.
Figure 5.5: Comparisons of drivers’ throttle position
Another test was conducted for two hours with one driver. Firstly, the driver drove from Uppsala to V¨aster˚as without listening to the recommended music, and the second hour he drove back to Uppsala with the recommended music from the application. Figure 5.6 shows the driver’s fatigue over the time period of the trip. While not listening to music the drivers tend to start feeling fatigue after 30 minutes of driving. The driver’s distance of eyelid is decreasing the more he drives, thus the fatigue degree is increasing. The maximum degree of fatigue while not listening to music was 0.81 in the 51st minute with an average of 0.4980. On the other hand while the driver is listening to music his fatigue degree is increasing in the 40th minute of driving, but it drops again as the application changes the music. The maximum degree of fatigue while listening to music was 0.31 in the 49th minute with an average of 0.3511. A decrease of 29.5% in fatigue degree.
Chapter 5. Experiments and Evaluation 37
Figure 5.6: Comparisons of drivers’ fatigue in long trips
5.3
Overhead
We evaluate the basic overhead of SAfeDJ running in popular smartphones in three aspects: (i). CPU/GPU usage; (ii). RAM usage; and (iii). Power consumption. We used a Google Nexus 5 to do the tests and TrepnTM Profiler, which is an
on-target power and performance profiling application for mobile devices. We conducted the test three times and the average is calculated. The results of the three tests are summarized in figures 5.7,5.8 and 5.9 respectively.
Figure 5.7: CPU overhead of SafeDJ
The CPU usage as shown in figure 5.7 is around 45.94% and 56% in peak period. We can understand that the CPU usage of the SafeDJ application are quite high but considering all the computation that is happening (Picture taking, image analysis, music analysis, Bluetooth communication, data analysis) the trade-off is fair. Because of the above computations the ram usage of the application is quite high. The application will occupy around 200MB; a total of 10% of Nexus 5 ram (2GB).
Chapter 5. Experiments and Evaluation 38
Figure 5.8: GPU overhead of SafeDJ
Figure 5.9: Power overhead of SafeDJ
The power consumption readings during the start of the application are around 3.224mW, but this number drops as the application runs, to about 1,083mW. Most of the power is consumed during the start and the initialization of the appli-cation. The initialization period time is not fixed and it depends on the number of songs the application must analyze. Thus, the most power consumed is due to song analysis. The initialization period in our experiments was 4 minutes for 10 songs. We should also keep in mind that depending on different factors (battery temperature, screen brightness) the power consumption may change. Since the smartphones could usually be charged inside vehicles, the battery consumption should not a concern for running SAfeDJ in-car inmost cases.
Chapter 6
Conclusions
The aim of this project was to create an Android application called SafeDJ; a Context-aware Mobile Sensing application for Safe Driving, which takes the ad-vantage of the development of the Internet of Things, to use sensors to get all the data needed for a systematic mobile application using the analyzing algorithm for the mood and fatigue. By using an OBD and the camera of the smartphone, SAfeDJ leverages sensing and computing capacities of smartphones to orchestrate multiple sources of sensing data with drivers’ social contexts. This system en-ables different in-car smartphones to collaboratively recommend preferable music to drivers according to their specific driving situations precisely and intelligently in real-time. Apart from music recommendation, more possibility exist for im-proving the safe driving condition like reminding a time-break during a long drive, reminding the danger, or opening the window to let the air flow. These resolutions for context improvement can all be developed based on the behavior of the data. To the best of our knowledge, SAfeDJ is the first smartphone-based interactive music recommendation system that recommends music to drivers not only based on their listening behaviors, but also their current states and driving situations. For future work, some of the computation will be moved to the cloud. For example, a big database of songs may be created, which have been analyzed already. This transition will improve the CPU usage and RAM of our application by more than 20%. Furthermore, it will fetch more features to make facial expression detection more precise. Also, adding the detection of other features such as the mouth that has the inverse tendency with the eye-lid would probably improve the algorithm. In addition, a plan to match the history and tendency of the mood’s changing with
Chapter 6. Conclusions 40 the tendency of the music rhythm, in order to let every beat match the current human mood. Lastly, the major challenge in the future is the proof that SafeDJ can help safe driving and lightening fatigue by testing it with bigger number of people by releasing it on Play Store.
Bibliography
[1] X. Hu, J.-q. Deng, W. Hu, G. Fotopoulos, E. C.-H. Ngai, Z. Sheng, M. Liang, X. Li, V. C. Leung, and S. Fels, “Poster – safedj community: Situation-aware in-car music delivery for safe driving,” in Proceedings of the 20th Annual International Conference on Mobile Computing and Networking, MobiCom ’14, (New York, NY, USA), pp. 363–366, ACM, 2014.
[2] W. Hu, X. Hu, J.-q. Deng, C. Zhu, G. Fotopoulos, E. C.-H. Ngai, and V. C. M. Leung, “Mood-fatigue analyzer: Towards context-aware mobile sensing appli-cations for safe driving,” in Proceedings of the 1st ACM Workshop on Mid-dleware for Context-Aware Applications in the IoT, M4IOT ’14, (New York, NY, USA), pp. 19–24, ACM, 2014.
[3] S. Devarakonda, P. Sevusu, H. Liu, R. Liu, L. Iftode, and B. Nath, “Real-time Air Quality Monitoring Through Mobile Sensing in Metropolitan Areas,” 2013.
[4] J. H¨oller, V. Tsiatsis, C. Mulligan, S. Karnouskos, S. Avesand, and D. Boyle, From Machine-to-Machine to the Internet of Things: Introduction to a New Age of Intelligence. Elsevier, Apr. 2014.
[5] I. Hawkins,Torque Pro, Last visited February 3, 2015. http://torque-bhp. com/.
[6] H. Abid, L. T. T. Phuong, J. Wang, S. Lee, and S. Qaisar, “V-cloud: Vehic-ular cyber-physical systems and cloud computing,” in Proceedings of the 4th International Symposium on Applied Sciences in Biomedical and Communi-cation Technologies, ISABEL ’11, (New York, NY, USA), pp. 165:1–165:5, ACM, 2011.
Bibliography 42 [7] B. Schooley, B. Hilton, Y. Lee, R. McClintock, and T. Horan, “Crashhelp: A gis tool for managing emergency medical responses to motor vehicle crashes,” Proc. ISCRAM, 2010.
[8] L.-W. Chen and P.-C. Chou, “A lane-level cooperative collision avoidance system based on vehicular sensor networks,” inProceedings of the 19th Annual International Conference on Mobile Computing & Networking, MobiCom ’13, (New York, NY, USA), pp. 131–134, ACM, 2013.
[9] L. Barr, H. Howarth, S. Popkin, and R. J. Carroll, “A review and evaluation of emerging driver fatigue detection measures and technologies,” National Transportation Systems Center, Cambridge. US Department of Transporta-tion, Washington. Dispon´ıvel em¡ http://www. ecse. rpi. edu/˜ qji/Fatigue/-fatigue report dot. pdf, 2005.
[10] M. Fazeen, B. Gozick, R. Dantu, M. Bhukhiya, and M. Gonzalez, “Safe driv-ing usdriv-ing mobile phones,” Intelligent Transportation Systems, IEEE Trans-actions on, vol. 13, pp. 1462–1468, Sept 2012.
[11] Y. Wang, J. Yang, H. Liu, Y. Chen, M. Gruteser, and R. P. Martin, “Sens-ing vehicle dynamics for determin“Sens-ing driver phone use,” in Proceeding of the 11th Annual International Conference on Mobile Systems, Applications, and Services, MobiSys ’13, pp. 41–54, 2013.
[12] S. Birrell, M. Fowkes, and P. Jennings, “Effect of using an in-vehicle smart driving aid on real-world driver performance,”Intelligent Transportation Sys-tems, IEEE Transactions on, vol. 15, pp. 1801–1810, Aug 2014.
[13] G. Play, iOnRoad Augmented Driving Pro, Last visited February 4, 2015.
http://www.ionroad.com.
[14] H. Singh, J. Bhatia, and J. Kaur, “Eye tracking based driver fatigue moni-toring and warning system,” in Power Electronics (IICPE), 2010 India In-ternational Conference on, pp. 1–6, Jan 2011.
[15] O. H. Alliance, “Android overview.”
[16] P. Brady, “Anatomy & physiology of an android,”
[17] Google, Android Developers, Last visited October 25, 2014. http://
Bibliography 43 [18] Bluetooth, Last visited October 25, 2014. http://www.bluetooth.com/
Pages/Bluetooth-Smart.aspx.
[19] A. Santini,OBD-II: Functions, Monitors and Diagnostic Techniques. Cengage Learning, 2010.
[20] G. A. Products,What is EOBD and OBDII, Last visited November 29, 2014.
http://www.gendan.co.uk/article_5.html.
[21] E. Electronics, Elm Electronics Products - OBD ICs, Last visited December 1, 2014. http://www.elmelectronics.com/obdic.html.
[22] SECONS, on-board diagnostics, Last visited November 30, 2014. http://
www.obdtester.com/obd2_protocols.
[23] E. Electronics, ELM327, Last visited November 29, 2014. http://
elmelectronics.com/obdic.html.
[24] G. C. K. Briggs, OBD GPS Logger, Last visited December 15, 2014. http:
//icculus.org/obdgpslogger/.
[25] Polar, Polar H7 Heart Rate Sensor, Last visited December 19, 2014. http:
//www.polar.com/en/support/H7_heart_rate_sensor.
[26] G.Bradski, “Dr. Dobb’s Journal of Software Tools.,” 2000.
[27] D. Zhang, S. Chen, and Z. hua Zhou, “A new face recognition method based on svd perturbation for single example image per person,”APPLIED MATH-EMATICS AND COMPUTATION, vol. 163, pp. 895–907, 2005.
[28] J. a. Gama and P. Brazdil, “Cascade generalization,” Mach. Learn., vol. 41, pp. 315–343, Dec. 2000.
![Figure 2.1: Android architecture[16]](https://thumb-us.123doks.com/thumbv2/123dok_us/664523.2580135/14.893.207.742.589.974/figure-android-architecture.webp)
![Figure 2.2: Activity lifecycle[17]](https://thumb-us.123doks.com/thumbv2/123dok_us/664523.2580135/16.893.294.658.343.824/figure-activity-lifecycle.webp)
![Figure 2.3: Anroid service lifecycle[17]](https://thumb-us.123doks.com/thumbv2/123dok_us/664523.2580135/17.893.335.613.431.810/figure-anroid-service-lifecycle.webp)
![Figure 2.4: J1962 female connector[21]](https://thumb-us.123doks.com/thumbv2/123dok_us/664523.2580135/21.893.368.582.596.686/figure-j-female-connector.webp)
![Table 2.1: Pin description for the J1962 OBD-II connector[22]](https://thumb-us.123doks.com/thumbv2/123dok_us/664523.2580135/22.893.234.707.387.756/table-pin-description-j-obd-ii-connector.webp)
![Figure 3.1: The block diagram of ELM327 chip[21]](https://thumb-us.123doks.com/thumbv2/123dok_us/664523.2580135/24.893.224.716.124.319/figure-the-block-diagram-of-elm-chip.webp)