University of Arkansas, Fayetteville
ScholarWorks@UARK
Theses and Dissertations8-2013
Parameterizing Analytical Models to Support an
Empirically Based Warehouse Design
Methodology
Lisa Thomas
University of Arkansas, Fayetteville
Follow this and additional works at:http://scholarworks.uark.edu/etd
Part of theConstruction Engineering and Management Commons, and theIndustrial Engineering Commons
This Dissertation is brought to you for free and open access by ScholarWorks@UARK. It has been accepted for inclusion in Theses and Dissertations by an authorized administrator of ScholarWorks@UARK. For more information, please [email protected], [email protected].
Recommended Citation
Thomas, Lisa, "Parameterizing Analytical Models to Support an Empirically Based Warehouse Design Methodology" (2013).Theses and Dissertations. 857.
PARAMETERIZING ANALYTICAL MODELS TO SUPPORT AN EMPIRICALLY BASED WAREHOUSE DESIGN METHODOLOGY
PARAMETERIZING ANALYTICAL MODELS TO SUPPORT AN EMPIRICALLLY BASED WAREHOUSE DESIGN METHODOLOGY
A dissertation submitted in partial fulfillment of the requirements for the degree of Doctor of Philosophy in Industrial Engineering
By
Lisa Thomas University of Arkansas
Bachelor of Science in Computer Systems Engineering, 1990 University of Arkansas
Master of Science in Industrial Engineering, 1993
August 2013 University of Arkansas
This dissertation is approved for recommendation to the Graduate Council. Dissertation Director: ——————————————————— Dr. Russell D. Meller Dissertation Committee: ——————————————————— Dr. John A. White, Jr. ——————————————————— ——————————————————— Dr. Richard E. Webb
Abstract
Research in the area of warehouse design is characterized by a myriad of analytical models that address one, typically small and isolated, area of the warehouse. These models, although important in gaining insight into one question of warehouse design, are of limited value when one considers the larger question of overall warehouse design. Thus, research in the area of overall warehouse design typically consists of procedure-driven processes based on qualitative factors and not the quantifiable results of analytical models.
In contrast, practitioners have significant empirical data related to how a design alter-native performs in an industry, a company, or a particular warehouse. However, because practitioners lack a means for comparing the performance of competing alternatives over multiple facilities, they may adopt a sub-optimal design for a given facility.
A valuable tool for depicting a design is the functional flow network, where nodes repre-sent the functional areas in the warehouse and arcs connecting the nodes define the product flow between functional areas. We propose a design methodology that employs the use of functional flow networks, as well as analytical models and empirical data for quantifying design performance. First, we develop a complete set of analytical models for a manual, case-picking warehouse, and we use the models to investigate the optimal warehouse shape. Next, we implement the design methodology using the analytical models. We then parame-terize the analytical models to create lookup tables to demonstrate the design methodology using empirical data. We use an example to show that the two methods lead to the same solutions, thus providing a proof-of-concept for using empirical data to design a warehouse. Finally, we present a preliminary search heuristic for designing a manual, case-picking ware-house. The search heuristic is based on warehouse operating characteristics and provides an initial design that can be further analyzed and optimized.
missing from existing overall warehouse design methodologies: comparing design alterna-tives through quantifiable output from analytical models and empirical observations, and therefore, considering a broad range of design alternatives.
c
2013 by Lisa Thomas All Rights Reserved
Acknowledgements
This dissertation embodies the central theme of my research endeavors over the last five years. I am especially grateful to my advisor, Dr. Russell D. Meller, for the time that he invested in me. He challenged and inspired me to become a better researcher, thinker and writer, and he provided research opportunities to prepare me for my overall career objective of obtaining a position in industry. Along with Dr. Meller, my committee members, Dr. John A. White, Jr., Dr. Richard E. Webb, and Dr. Sarah E. Root, provided me with invaluable insight and direction. I consider myself blessed to have benefited from their expertise and wisdom.
I would like to express my gratitude to the Material Handling Education Foundation in supporting me through scholarships and to the University of Arkansas Graduate School for the Doctoral Academy Fellowship. In addition, I am fortunate to have worked on research projects through the Center for Innovation in Healthcare Logistics (CIHL) and the Center for Excellence in Logistics and Distribution (CELDi). I learned a great deal about the healthcare supply chain through two research projects with CIHL. I am also grateful to CELDi and its industry partners for allowing me to work on industry-based research projects in the area of warehouse design and to the National Science Foundation in supporting CELDi.
I am also thankful for the friendships of Tish, Jen, Angelica and Barb throughout my academic journey.
I am blessed to have a wonderful family. My pursuit of a Ph.D. would not have been possible without my husband, Greg. I am eternally grateful for his love, support and dedica-tion to our children and for fulfilling many of my responsibilities as a mother so that I could pursue a dream. To my children, Daniel and Rachel, thank you for being so understanding when I had to miss family time in order to study. And, I will always cherish the lifelong friendship of my sister, Sheila. To the rest of my family, thank you for your prayers, support and encouragement.
Dedication
This is dedicated to my parents, Wayne and Sara Irwin, who have encouraged me to believe in myself and more importantly, raised me to love and fear the Lord.
Contents
1 Introduction 1
Bibliography . . . 13
2 Literature Review 14 2.1 Overall Warehouse Design . . . 14
2.2 Storage Layout . . . 18
2.3 Travel-Time Models . . . 20
2.3.1 Put-away Operation . . . 20
2.3.2 Order-Picking Operation . . . 20
2.3.3 Replenishment Operation . . . 25
2.4 Summary of Literature Review . . . 25
Bibliography . . . 27
3 Problem Statement 30 3.1 Travel-Time Models for a Manual Warehouse . . . 34
3.2 The Design Methodology Using Analytical Models . . . 35
3.3 The Design Methodology Using Discrete Empirical Data . . . 36
3.4 A Search Heuristic for a Manual, Case-Picking Warehouse . . . 36
Bibliography . . . 38
4 Contribution 1: A Paper on, “Analytical Models for Warehouse Configu-ration” 39 4.1 Warehouse Shape and Door Configuration . . . 40
4.2 Literature Review . . . 44
4.3 Optimal Warehouse Shape . . . 47
4.4 Put-Away Travel . . . 50
4.4.1 Uniform (1-Sided or 2-Sided) Doors with Random Storage . . . 50
4.4.2 Uniform (1-Sided) Doors with Class-Based Storage . . . 52
4.4.3 Uniform (2-Sided) Doors with Class-Based Storage . . . 55
4.4.4 Summary . . . 58
4.5 Order-Picking Travel . . . 58
4.5.1 Random Storage Policy . . . 59
Traversal Strategy with a Centrally Located Pickup Point and Uni-formly Distributed Dropoff Point . . . 59
4.5.2 Class-Based Storage . . . 62
Return Policy for 1-Sided Layout and a Centrally Located Pickup and Uniform Deposit Point . . . 62
Traversal Strategy for 2-Sided Layout and a Centrally Located Pickup Point and Uniform Deposit Point . . . 65
Summary . . . 69
4.6.1 Replenishment Travel for Random Storage . . . 70
4.6.2 Replenishment Travel for 1-Sided Layout with Class-Based Storage . 74 4.6.3 Replenishment Travel for 2-Sided Layout with Class-Based Storage . 76 4.6.4 Summary . . . 77
4.7 Warehouse Shape Example . . . 78
4.7.1 Optimal Warehouse Shape . . . 79
4.8 Conclusions . . . 81
Acknowledgements . . . 82
Bibliography . . . 83
Appendices . . . 85
A Proofs for Optimal r Values for the Put-Away Operation . . . 85
A.1 Result 1: 1-Sided Layout . . . 85
A.2 Result 2: 2-Sided Layout . . . 85
B Values forS and p . . . 86
C Definition of Parameterq for the Put-Away Operation with the 2-Sided Layout 86 D Equations for Across-Aisle, Order-Picking Travel for the 2-Sided Layout . . . 87
E Equations for Replenishment Travel with the 1-Sided Layout . . . 89
F Equations for Replenishment Travel with the 2-Sided Layout . . . 96
G Certification of Student Work . . . 106
5 Contribution 2: A Paper on, “Using Analytical Models to Assess Perfor-mance in Overall Warehouse Design” 107 5.1 Introduction . . . 108
5.2 Literature Review . . . 109
5.3 Design Methodology . . . 111
5.4 Example . . . 114
5.4.1 Warehouse Parameters . . . 115
5.4.2 Sizing the Pallet Rack Area . . . 116
5.4.3 Evaluation of Labor Requirements . . . 118
5.4.4 Summary of Results . . . 125
5.5 Conclusions and Future Research . . . 125
Bibliography . . . 127
Appendices . . . 129
A Certification of Student Work . . . 129
B Release from the Institute of Industrial Engineers . . . 130
6 Contribution 3: A Paper on, “Using Empirical Data to Assess Performance in Overall Warehouse Design” 131 6.1 Introduction . . . 132 6.2 Literature Review . . . 133 6.3 Design Assumptions . . . 135 6.4 Design Methodology . . . 136 6.5 Example . . . 137 6.5.1 Empirical Data . . . 138
Sizing Tables . . . 138
Labor Tables . . . 140
6.5.2 Using the Empirical Data to Determine Labor Requirements . . . 148
6.6 Results . . . 150
6.7 Conclusions and Future Research . . . 153
Bibliography . . . 155
Appendices . . . 157
A Certification of Student Work . . . 157
B Release from the Institute of Industrial Engineers . . . 158
7 Contribution 4: A Paper on, “A Search Heuristic for Designing a Case-Picking Warehouse” 159 7.1 Introduction . . . 159
7.2 Literature Review . . . 163
7.3 Problem Statement . . . 166
7.4 Methodology . . . 169
7.5 Heuristic for Designing Manual, Case-Picking Warehouses . . . 189
7.6 Conclusions . . . 195
Bibliography . . . 198
Appendices . . . 199
A Parameters for Case-Picking Warehouse Analysis . . . 199
B Tables for Forward Area Layout and Pallet Area Shape . . . 202
C Tables Listing Daily Travel Time for Different Levels of Pallet Rack . . . 209
8 Conclusions and Future Research 216 8.1 Conclusions . . . 216
8.2 Future Research . . . 217
List of Figures
1.1 Warehouse layout. . . 2
1.2 Warehouse design and operational decisions adapted from [5]. . . 3
1.3 (a) FFN with reserve storage; (b) FFN with reserve storage and pallet rack; (c) FFN with reserve storage, pallet rack, and case flow rack. . . 8
3.1 Empirically based warehouse design methodology. . . 32
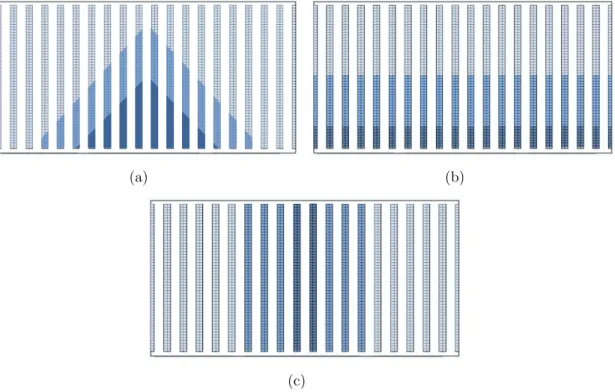
4.1 (a) Width-to-depth shape ratio 3.6, doors on two sides; (b) Width-to-depth ratio 1.2, doors on one side. . . 41
4.2 Class-based layouts: (a) Diagonal, sided dock doors; (b) Identical-aisle, 1-sided dock doors; (c) Within-aisle, 2-1-sided dock doors. . . 42
4.3 Warehouse parameters. . . 50
4.4 (a) 1-Sided, class-based storage; (b) Optimal r values. . . 53
4.5 (a) 2-Sided, class-based storage; (b) optimal r values. . . 56
4.6 Distance to a uniform dock door. . . 60
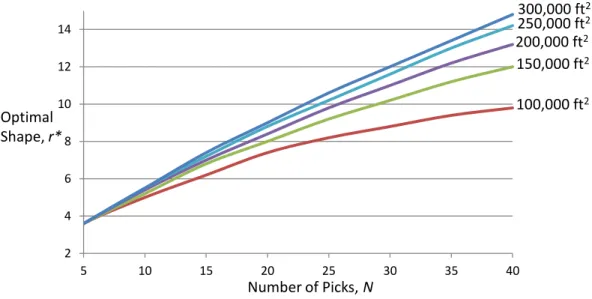
4.7 Optimalr values for the traversal strategy with random storage and a central pickup point and uniform deposit points. . . 61
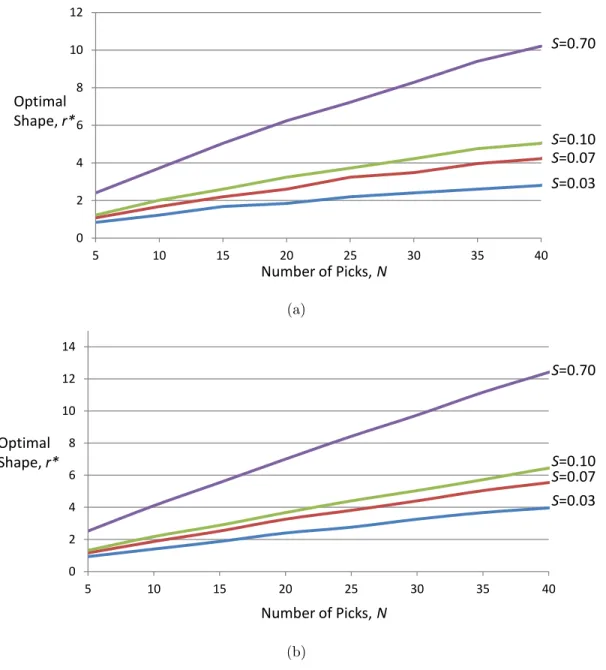
4.8 Optimalrvalues for a 1-sided layout with a return policy and a central pickup point and uniform deposit point: (a) 100,000 ft2; (b) 300,000 ft2. . . . 64
4.9 Combinations of picks for the 2-sided layout. . . 66
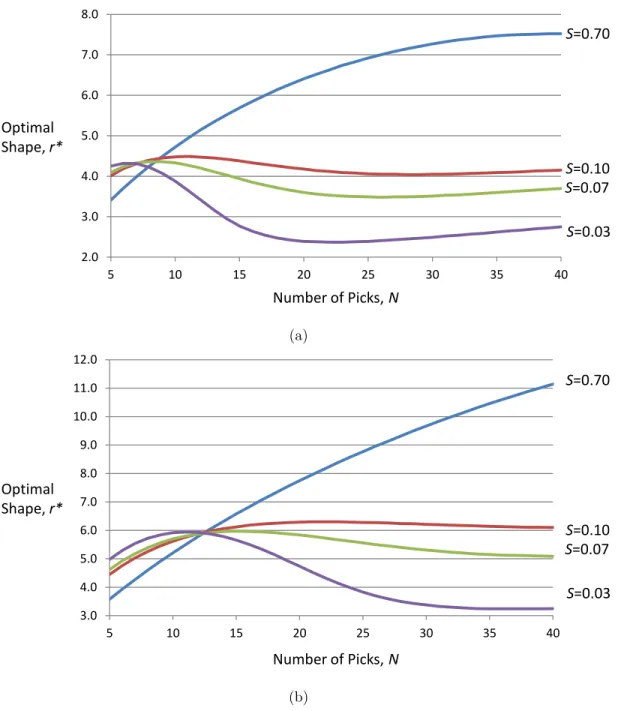
4.10 Optimal r values for a 2-sided layout with the traversal policy and a central pickup point and uniform deposit point: (a) 100,000 ft2; (b) 300,000 ft2. . . . 68
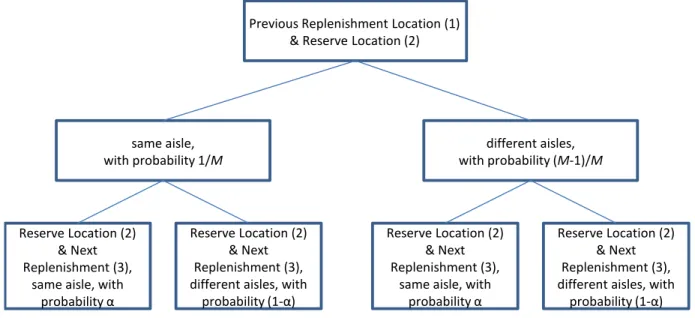
4.11 Probabilities for replenishment travel. . . 70
4.12 Three locations in the same aisle. . . 71
4.13 Possible routes with locations 1 and 2 in same aisle. . . 72
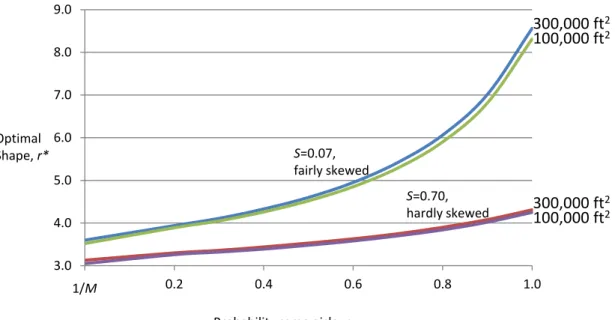
4.15 Optimal r values for replenishment with random storage (100,000 ft2 and 300,000 ft2). . . . 75 4.16 Optimal r values for replenishment with a 1-sided layout (100,000 ft2 and
300,000 ft2). . . . 76 4.17 Optimal r values for replenishment with a 2-sided ayout (100,000 ft2 and
300,000 ft2). . . . 78 4.18 Total distance traveled for shapes ranging from 0.5 to 5.0. . . 80 4.19 Reserve location uniformly distributed along L. . . 90 5.1 Functional flow networks: (a) Basic FFN with all picks from reserve storage;
(b) FFN including a co-located forward area with case picks from the forward area (bottom level), pallet and case picks from the reserve area, and with replenishments in pallet quantities from the reserve area to the forward area. 112 5.2 Class-based layouts: (a) Identical-aisle, 1-sided dock doors; (b) Within-aisle,
2-sided dock doors. . . 113 5.3 Designs considered. . . 114 5.4 Pallet rack area as the forward area grows: (a) 5 levels of rack, shape 2.0; (b)
6 levels of rack, shape 2.0. . . 118 5.5 Hours required for different pallet area shapes: (a) Put away and pallet picks;
(b) Case picks from reserve. . . 120 5.6 Hours required for different pallet area shapes using random-storage forward
areas with 20% of SKUs. . . 121 5.7 Hours required for different pallet area shapes for: (a) random storage (b)
1-sided layout; (c) 2-sided layout. . . 123 5.8 Hours required for different pallet area shapes and levels of pallet rack, with
random storage in the forward area and 20% of SKUs. . . 124 5.9 Total labor hours (designs ordered from most to least hours required). . . 124
6.1 Functional flow networks: (a) basic FFN with picks from all levels of pallet rack; (b) FFN with co-located forward area, with picking from the reserve and forward areas and with replenishments in pallet quantities to the forward area. 136 6.2 Travel distances: (a) horizontal put-away travel; (b) horizontal order-picking
travel, aisle length = 240 ft; (c) horizontal replenishment travel, α= 0.8. . . 149
6.3 Total labor, designs ordered from most to least hours with alternating results for analytical-model hours and empirical-data hours. . . 150
6.4 Comparison of random-storage forward area designs using empirical data ver-sus analytical models for designs with a pallet-area shape of 2.5 and 6 levels of pallet rack. . . 151
7.1 Example of Possible Designs to Consider. . . 162
7.2 Total labor hours (designs ordered from most to least hours). . . 162
7.3 Class-based layouts: (a) Identical-aisle, 1-sided dock dors; (b) Within-aisle, 2-sided dock doors. . . 168
7.4 Design variables considered . . . 169
7.5 Demand skewness levels. . . 182
7.6 Heuristic procedure for choosing a design. . . 191
7.8 Warehouse Parameters . . . 200
List of Tables
4.1 Daily Travel Distance by Operation . . . 80
4.2 ABC Curve Parameters . . . 86
5.1 Pick Lines and Batches for Forward and Reserve Areas . . . 116
5.2 Forward Activity for Class-Based Layouts . . . 116
5.3 Sizing Results for Example Warehouse . . . 117
5.4 Distance Requirements by Operation for Selected Designs . . . 119
6.1 Pick Lines and Batches for Forward and Reserve Areas . . . 137
6.2 Sizing Table for a Targeted Number of Bottom-Level Pallets . . . 139
6.3 Horizontal Two-Way Travel for Put Away with Random Storage∗ . . . 141
6.6 Horizontal Travel for Replenishment . . . 147
7.1 Warehouse Parameter Assumptions . . . 170
7.2 Data Sets Based on Order Data . . . 171
7.3 Correlation Coefficients of Warehouse Paramters with Forward Area Size . . . 172
7.4 Correlation Coefficients of Warehouse Paramters with Pallet Area Shape . . . 173
7.5 DS1 Labor for Varying Shapes and Layouts; α= 0.4, 6 levels . . . 175
7.6 DS2 Labor for Varying Shapes and Layouts; α= 0.4, 6 levels . . . 176
7.7 Summary of Best Shape and Forward Area Size . . . 177
7.8 Optimal SKUs in Random Forward Area . . . 179
7.9 Optimal SKUs in 1-Sided, Class-Based Forward Area . . . 180
7.10 Optimal SKUs in 2-Sided, Class-Based Forward Area . . . 181
7.11 Random Forward Area Sizes for Different Skewness Levels . . . 183
7.12 1-Sided Forward Area Sizes for Different Skewness Levels . . . 184
7.13 2-Sided Forward Area Sizes for Different Skewness Levels . . . 185
7.15 DS2 Labor Hours for an ABC Curve with Low Skewness . . . 187
7.16 DS1: Daily Travel Time for Different Levels of Pallet Rack . . . 188
7.17 DS2: Daily Travel Time for Different Levels of Pallet Rack . . . 189
7.18 Test Data Sets for Order Data . . . 194
7.19 Comparison of Best Design to Heuristic for 1-Sided Door Configuration . . . 194
7.20 Comparison of Best Design to Heuristic for 2-Sided Door Configuration . . . 195
7.21 DS3 Labor for Varying Shapes and Layouts; α= 0.4, 6 levels . . . 202
7.22 DS4 Labor for Varying Shapes and Layouts; α= 0.4, 6 levels . . . 202
7.23 DS5 Labor for Varying Shapes and Layouts; α= 0.4, 6 levels . . . 203
7.24 DS6 Labor for Varying Shapes and Layouts; α= 0.4, 6 levels . . . 203
7.25 DS7 Labor for Varying Shapes and Layouts; α= 0.4, 6 levels . . . 203
7.26 DS8 Labor for Varying Shapes and Layouts; α= 0.4, 6 levels . . . 204
7.27 DS9 Labor for Varying Shapes and Layouts; α= 0.4, 6 levels . . . 204
7.28 DS10 Labor for Varying Shapes and Layouts; α= 0.4, 6 levels . . . 204
7.29 DS11 Labor for Varying Shapes and Layouts; α= 0.4, 6 levels . . . 205
7.30 DS12 Labor for Varying Shapes and Layouts; α= 0.4, 6 levels . . . 205
7.31 DS13 Labor for Varying Shapes and Layouts; α= 0.4, 6 levels . . . 205
7.32 DS14 Labor for Varying Shapes and Layouts; α= 0.4, 6 levels . . . 206
7.33 DS15 Labor for Varying Shapes and Layouts; α= 0.4, 6 levels . . . 206
7.34 DS16 Labor for Varying Shapes and Layouts; α= 0.4, 6 levels . . . 206
7.35 DS17 Labor for Varying Shapes and Layouts; α= 0.4, 6 levels . . . 207
7.36 DS18 Labor for Varying Shapes and Layouts; α= 0.4, 6 levels . . . 207
7.37 DS19 Labor for Varying Shapes and Layouts; α= 0.4, 6 levels . . . 207
7.38 DS20 Labor for Varying Shapes and Layouts; α= 0.4, 6 levels . . . 208
7.39 DS3: Daily Travel Time for Different Levels of Pallet Rack . . . 209
7.40 DS4: Daily Travel Time for Different Levels of Pallet Rack . . . 209
7.42 DS6: Daily Travel Time for Different Levels of Pallet Rack . . . 210
7.43 DS7: Daily Travel Time for Different Levels of Pallet Rack . . . 210
7.44 DS8: Daily Travel Time for Different Levels of Pallet Rack . . . 211
7.45 DS9: Daily Travel Time for Different Levels of Pallet Rack . . . 211
7.46 DS10: Daily Travel Time for Different Levels of Pallet Rack . . . 211
7.47 DS11: Daily Travel Time for Different Levels of Pallet Rack . . . 212
7.48 DS12: Daily Travel Time for Different Levels of Pallet Rack . . . 212
7.49 DS13: Daily Travel Time for Different Levels of Pallet Rack . . . 212
7.50 DS14: Daily Travel Time for Different Levels of Pallet Rack . . . 213
7.51 DS15: Daily Travel Time for Different Levels of Pallet Rack . . . 213
7.52 DS16: Daily Travel Time for Different Levels of Pallet Rack . . . 213
7.53 DS17: Daily Travel Time for Different Levels of Pallet Rack . . . 214
7.54 DS18: Daily Travel Time for Different Levels of Pallet Rack . . . 214
7.55 DS19: Daily Travel Time for Different Levels of Pallet Rack . . . 214
List of Published Papers
Chapter 4:
Thomas, L. M., and Meller, R. D., “Analytical Models for Warehouse Configuration,”
IIE Transactions (in review) (2013).
Chapter 5:
Thomas, L. M., and Meller, R. D., “Using Analytical Models to Assess Performance in Overall Warehouse Design,” in Proceedings of the 2013 Industrial and Systems
Engi-neering Research Conference, San Juan, Puerto Rico (2013).
Chapter 6:
Thomas, L. M., and Meller, R. D., “Using Empirical Data to Assess Performance in Overall Warehouse Design,” in Proceedings of the 2013 Industrial and Systems
Chapter 1
Introduction
According to the results of the2011 Warehouse and Distribution Center Operations Survey [10], most companies are taking steps to reduce warehouse operating costs by improving processes or changing storage racks and layouts. Moreover, the design of the functional areas within the warehouse directly affects the operational costs, so a systematic approach to overall design that considers such costs is desirable. Nonetheless, overall warehouse design is a complex process with many interrelated components, and coordinating these processes makes systematic design challenging.
In general, practitioners use empirical observations when designing a warehouse [2], while academic research in this area typically focuses on analytical models for one or two design components [11]. The two approaches taken by researchers and practitioners each have their own merits, as analytical models yield quantitative results that can be used to compare design alternatives, and empirical observations provide discrete realizations that might be overlooked by using analytical models alone. Rouwenhorst et al. [11] state that to a large extent, the design phase determines the logistical costs associated with a warehouse, and the authors emphasize the need to integrate the models and methods for specific design components in order to develop a methodology for systematic warehouse design. Further, the methods and models presented in the academic literature significantly outperform the methods used in practice, yet warehouse management systems still utilize simple heuristics to solve problems [12]. The interrelationships that exist among design components make overall warehouse design a daunting task, and this is likely the reason that no design methodology has been widely adopted by industry practitioners or academicians.
The five basic considerations in overall warehouse design include: overall structure, sizing and dimensioning, departmental layout, equipment selection, and operational strategies [6].
That is, the design process must also consider the operations in the areas of receiving, storage, order picking and shipping [5]. Figure 1.1 illustrates a traditional warehouse layout with areas designated for receiving and shipping and with pallet rack for storage. The overall relationship between the design and operational components depicted by Gu et al. are illustrated in Figure 1.2 [5].
Figure 1.1: Warehouse layout.
From Figure 1.2 one can see the complexity of the overall design process and the effect of design decisions on operational performance. For example, consider the design goal of sizing and dimensioning the warehouse in order to accommodate a given number of dock doors. As the warehouse shape changes (becoming more or less elongated to achieve a given number of doors), the travel distance required for put-away, order-picking and replenishment operations changes as well. Thus, altering even a single design parameter can significantly affect the operational performance of the warehouse. The operational components of warehouse design include the following:
Receiving
Figure 1.2: Warehouse design and operational decisions adapted from [5].
assigning trucks to docks. Both of these decisions impact the utilization of material handling equipment, as well as the flow of material within the warehouse. In addition to impacting flow, the assignment of trucks to docks can affect the travel distance required for the put-away operation.
Storage
Storage-related decisions can have a huge impact on warehouse performance, as storage affects both warehouse utilization and labor. Typical storage policies include random stor-age, dedicated storage and class-based storage. Other storage decisions involve determining the amount of inventory to be stored and whether or not there will be a forward reserve or fast-pick area. Still other storage determinations include allocating products to departments
and creating zones within the departments. Order Picking
Because order picking accounts for a large part of warehouse operational costs, it is an area that has received considerable attention from the academic community. Order-picking strategies include operations such as batching, routing and sequencing, and sorting. Inher-ent in this decision is the level and type of automation, if any. Warehouses that utilize automated order-picking systems are often referred to as part-to-picker warehouses, whereas manual warehouses are referred to as picker-to-part warehouses.
Shipping
Shipping decisions are related to receiving in that there must be an assignment of out-bound trucks to docks, as well as the scheduling of trucks arriving for pickup. Again, these decisions affect the flow of material within the warehouse.
The number of available dock doors affects both shipping and receiving, and consideration should be given to the number of trucks arriving during a receiving or shipping time period. If the storage area results in too few dock doors to meet truck throughput requirements, either the warehouse will have to become larger or the facility will have to be configured with doors on two sides to accommodate additional doors. Both of these options result in added labor and building costs. In order to avoid these added costs, additional workers can be scheduled to turn trucks quickly, and coordinating the arrival of trucks may be necessary as well.
Various strategies and methodologies have been developed to improve the operational performance of warehouses. For example, because order picking is the most labor-intensive component of warehouse operations, research typically focuses on improving storage and routing policies to reduce the cost associated with order-picking labor. The random storage policy makes the most efficient use of storage because incoming products can be put away to any open storage location, as there is no specific assignment of product to location. Volume-based storage, on the other hand, places fast-moving items closest to the pickup and deposit
(P&D) location in order to minimize order-picking travel. Items are assigned to dedicated storage areas according to their level of activity. As such, incoming products can only be put away to their designated storage locations, thus requiring more storage locations as compared to random storage. Consequently, there is a tradeoff in storage space and order-picking efficiency when choosing between random and volume-based storage. This tradeoff illustrates one of the many interactions that exist among the operational components in a warehouse.
Given the large number of design decisions and operational policies requiring consider-ation in overall warehouse design, the number of possible designs can be quite large. To illustrate, consider the following design options for a new warehouse:
• Case picks from reserve storage or two possible forward areas (lower level of pallet rack or case flow rack).
• Piece picks from reserve storage or two possible forward areas (lower level of pallet rack or case flow rack).
• Dock doors located on one or both sides of the facility, implying two possible layouts for class-based storage.
• Warehouse shape ratios of 1.5, 2.0, 2.5, 3.0, or 3.5. • Four or five levels of pallet rack.
This results in 180 (3×3×2×5×2) possible warehouse designs. Further, this list is not exhaustive, and there are operational policies such as batching, zoning, and sorting that must be considered for each design because these policies affect the operational performance of the warehouse. Moreover, because of the interrelationships between design components and operational performance, comparing alternatives is not an easy task, as there are often tradeoffs that must be considered. For example, moving from random to volume-based
storage results in an increase in order-picking efficiency but a decrease in storage utilization. Thus, it is easy to see that the number of designs grows rapidly.
Valuable research contributions have been made in warehousing literature, and many analytical models are available that quantify specific warehouse functions in terms of oper-ational labor. For instance, order-picking models have been developed for various routing strategies for random storage [7, 4] and volume-based storage [3, 8]. Yet, these models have never been integrated into a holistic methodology for warehouse design. Therefore, a systematic approach to overall warehouse design that allows a quantitative comparison of alternatives would benefit practitioners.
Apple et al. [1] proposed a design methodology to expolit the benefits of both the practi-tioner’s approach (empirical observations) and the academic approach (analytical methods). The first step in their design methodology is to generate a list of relevant design factors (e.g., type of appropriate storage rack based on product characterisitcs). Then, a discrete matrix solution is constructed for each design factor to allow a quantitative comparison of design alternatives. The authors’ vision is to motivate the developement of numerical matrices related to labor, space and capital investment for each warehouse function using empirical data.
Like Apple et al. [1], the objective of our research is to provide a means by which to implement a warehouse design methodology that allows a comparison of alternatives in terms of operational labor and storage requirements. However, we propose two methods for achieving this goal: analytical models and empirical data. As stated above, analytical models have been developed by the research community and can be “parameterized” to obtain quantitative solutions in terms of labor and space requirements for various warehouse functions. When analytical models are not available, empirical data can be used to quantify labor and space requirements. Similar to McGinnis et al. [9] and Apple et al. [1], our methodology characterizes design alternatives using functional flow networks.
functional area in the warehouse. The nodes are connected with arcs that represent the flow of material from one functional area to another. Figure 1.3 illustrates three functional flow networks, from a very simple design (Figure 1.3(a)) to more complex designs (Figures 1.3(b) and 1.3(c)).
The FFN can be used to compare various warehouse designs by first sizing the nodes to accommodate a given number of storage locations and then balancing the flow of product along the arcs. From a systematic design perspective, a designer would begin with a very simple design and then move to more complex designs, evaluating the space and labor re-quirements for each. In general, moving to different designs requires a resizing of the storage areas, and the product flow must be allocated accordingly. For example, consider a simple design where 6,000 cases per day are picked from a reserve storage area with pallet rack that is five levels high and contains 10,000 pallet locations. A more complex design might include pallet rack that is six levels high with a forward area for picking 80 percent of the cases, where the forward area is 1,200 pallet locations on the bottom level of the centermost aisles of pallet rack. The pallet rack area now must be resized to six levels of pallet rack (a smaller footprint), and the forward area must be sized to accommodate 1,200 pallet locations in the centermost aisles on the bottom level. With this configuration, product flow is such that 4,800 cases are picked from the bottom-level forward area, and the remaining 1,200 cases are picked from the upper levels of pallet rack and/or the outermost aisles.
The key to supporting this design approach, and the objective of this research, is to develop a means to convert the product flow in the FFN to labor requirements. We propose two approaches to achieve this objective. The first approach parameterizes analytical models and uses product flow to quantify labor requirements. For example, an existing model for order-picking distance with random storage has input parameters for the number of aisles, number of pick lines, width of the picking area, and depth of the picking area [7]. Travel-time requirements can be determined by applying the input parameters (number of aisles and pick lines, along with the picking area width and depth) specified by a particular design
R ec eiv ing Ship p ing Full Pallets Cases on Pallets
Full Pallets Reserve Storage
(a) Forward Pallet Area R ec eiv ing Ship p ing Full Pallets Pallets Full Pallets Reserve Storage Cases on Pallets (b) Full Pallets R ec eivin g Ship p ing Case Flow Rack Full Pallets Cases
Full Pallets Reserve
Storage
Forward Pallet
Area
(c)
Figure 1.3: (a) FFN with reserve storage; (b) FFN with reserve storage and pallet rack; (c) FFN with reserve storage, pallet rack, and case flow rack.
to the order-picking model, thus “parameterizing” the model. The resulting distance is then divided by the appropriate travel speed, hours per day, etc., to determine the labor required. The second approach uses empirical data in the form of lookup tables to estimate labor requirements, thus addressing the case where analytical models are not available. Undoubt-edly, these tables cannot accommodate all possible combinations for storage size and labor rates. Accordingly, the tables contain discrete data points, and interpolation is used to determine the storage and labor requirements for values that lie between given data points. We illustrate both approaches for quantifying labor requirements through a detailed example. For the analytical model approach, our example includes the put-away, order-picking and replenishment operations in a manual warehouse. Models for the put-away and order-picking operations for a random storage warehouse can be found in existing literature. The existing models include a central point for pickup and deposit (i.e., a single, centrally located dock door), so we modify these models to include a uniform distribution of dock doors. In addition, we develop a model for replenishment, as there are no existing models for replenishment in warehousing literature. We also develop models for put-away, order-picking and replenishment operations for two class-based storage layouts. We then utilize the models in our detailed example to illustrate the design process for a manual (picker-to-part) warehouse.
For the empirical data approach, we construct data tables for sizing the pallet rack area of a case-picking warehouse. We employ a sizing algorithm that determines the aisle length and number of aisles necessary for a pallet area of a given size and shape to construct the sizing tables. In addition, we construct distance tables by parameterizing the analytical models that were developed for the put-away, order-picking and replenishment operations. We illustrate how interpolation can be used to obtain values for the storage area size and travel distances for parameters that are not explicitly listed in the tables. Further, we present a full example to demonstrate how the tables can be used to design a manual, case-picking warehouse. Then, in order to illustrate how the empirical data approach compares
to the anlaytical model approach, we provide the results of both approaches for our detailed example. The comparison provides insight into the validity of the empirical data approach as a means of quantifying storage and labor requirements for warehouse design.
This design approach supports a decision process that combines the invaluable insights of practitioners (in defining base warehouse components such as choosing the appropriate racking for various product types and choosing among design options) with a quantitative comparison of design alternatives through the use of analytical models and empirical data. We have implemented the design approach for a manual warehouse through a computer tool that includes both case- and piece-picking operations. The tool can be used to evaluate and compare various designs.
The motivation for this research stemmed from two research projects through the Center for Excellence in Logistics and Distribution (CELDi) with a member organization pertaining to warehouse design. The first project involved modeling the member organization’s forward-reserve problem. Their forward area for case picking consists of the bottom level of pallet rack (with the upper levels serving as reserve storage). A tool was developed to evaluate the effect of the size of the forward area on operational efficiency. The second project provided the member organization with a tool to determine the best shape of a facility for a given number of pallet locations while considering the number of dock doors available, the labor for storage and retrieval of product, as well as construction costs. To emphasize the relevance of the proposed research, we include a quote from the CELDi Industrial Advisory Board member representative from this organization:
The two CELDi projects referred to above have been implemented by our or-ganization with positive results. Project 1 is the CELDi project focused on determining the optimal size of our Zone 10, forward picking area. The output of this project was an Excel-based Tool that we have used in eight distribution centers so far to re-size our Zone 10, forward picking area. We are consistently trying to minimize our travel within our warehousing activities and have
im-plemented a travel time per line metric to measure our performance. Whereas the aforementioned tool was utilized, we have seen a significant drop (>10%) in travel time per line after implementation.
In addition, Project 2 is the CELDi project focused on the optimal distribution center facility shape and dock-door configuration. The output of this project (which incorporated the output of Project 1) was an Excel-based Tool that we have used to help analyze three distribution centers to date. We have not neces-sarily implemented all of the findings as the buildings were already standing, but we have been able to have discussions with our building/real estate group on the additional costs in building the facility in the non-optimal way. The Tool will be instrumental in helping to arrive at a final building configuration for future greenfield buildings, which we believe will have noteworthy savings of tens of thousands of dollars.
With these tools, we are able to make easy recommendations on forward pick zone sizing and dock usage without going through an entire project cycle. More importantly, having these two tools—we are now able to rely on empirical data versus emotional “assumptions” to drive key business decisions in facility layout design.
In the next chapter we present the literature related to overall warehouse design, as well as the literature pertaining to storage policies and routing heuristics for order picking, as our design approach utilizes order-picking models to quantify labor requirements and because order picking comprises a large portion of the operational expenses in most warehouses. In Chapter 3, we formally present the problem statement of our research, emphasizing the contributions of our research. In Chapter 4, travel-time models are presented for the put-away, order-picking, and replenishment operations in a manual warehouse. The models consider a centrally located pickup point and uniformly distributed dock doors for both
the optimal warehouse shape factor.
In Chapter 5 we present the design methodology and illustrate its use through param-eterized analytical models for the put-away, order-picking and replenishment operations in a manual, case-picking warehouse. In Chapter 6, we use the analytical models presented in Chapter 4 to generate “discretized lookup tables” to illustrate the design methodology using empirical data. We then compare the results using the lookup tables to the results obtained using analytical models to investigate the feasibility of empirical data for quantifying labor requirements in warehouse design. In Chapter 7, we use order data from six existing ware-houses, along with fourteen derived data sets, to analyze the effect of the warehouse operating environment on the optimal design that is obtained through complete enumeration. Using the results from the analysis, we present a heuristic search procedure to prune the solution space in order to provide a good design that can be further analyzed and improved. Finally, we summarize our research involving overall warehouse design and present our thoughts on future research in Chapter 8.
Bibliography
[1] Apple, J. M., Meller, R. D., and White, J. A., “Empirically-Based Warehouse Design: Can Academics Accept Such an Approach?,” inProgress in Material Handling Research: 2010, Charlotte, NC (2010).
[2] Baker, P., and Canessa, M., “Warehouse Design: A Structured Approach,” European
Journal of Operational Research, 193, 245–258 (2009).
[3] Caron, F., Marchet, G., and Perego, A., “Routing Policies and COI-Based Storage Policies in Picker-to-Part Systems,” International Journal of Production Research, 36, 713–732 (1998).
[4] Chew, E. P., and Tang, L. C., “Travel Time Analysis for General Item Location As-signment in a Rectangular Warehouse,”European Journal of Operational Research, 112, 582–597 (1999).
[5] Gu, J., Goetschalckx, M., and McGinnis, L. F., “Research on Warehouse Operation: A Comprehensive Review,” European Journal of Operational Research, 177, 1–21 (2007). [6] Gu, J., Goetschalckx, M., and McGinnis, L. F., “Research on Warehouse Design and
Performance Evaluation: A Comprehensive Review,” European Journal of Operational
Research, 203, 539–549 (2010).
[7] Hall, R. W., “Distance Approximations for Routing Manual Pickers in a Warehouse,”
IIE Transactions, 25, 4, 76–87 (1993).
[8] Le-Duc, T., and de Koster, R., “Travel Distance Estimation and Storage Zone Opti-mization in a 2-Block Class-Based Storage Strategy Warehouse,” International Journal
of Production Research, 43, 17, 3561–3581 (2005).
[9] McGinnis, L. F., Goetschalckx, M., Sharp, G., Bodner, D., and Govindaraj, T., “Re-thinking Warehouse Design Research,” inProceedings of the 2000 International Material
Handling Research Colloquium, Charlotte, NC (2000).
[10] Modern Materials Handling, “2011 Warehouse/DC Operations Survey,” http://www.
mmh.com/article/2011_warehouse_dc_operations_survey, accessed November 22,
2011 (2011).
[11] Rouwenhorst, B., Reuter, B., Stockrahm, V., van Houtum, G., Mantel, R., and Zijm, W., “Warehouse Design and Control: Framework and Literature Review,” European
Journal of Operational Research, 122, 515–533 (2000).
[12] van den Berg, J. P., “A literature survey on planning and control of warehousing systems,” IIE Transactions, 31, 751–762 (1999).
Chapter 2
Literature Review
The focus of this research is concerned with overall warehouse design. We present the methodologies that have been proposed in the academic literature in this area. One of the key objectives in warehouse design is to minimize the operational costs inherent in the design. Operational costs include receiving, put away, order picking, checking and packing, and shipping [4]. Order picking accounts for a significant portion of operational expenses, with travel time being the dominant cost factor [4]. In order to reduce travel, activity-based storage layouts have been presented in the literature that place fast-moving items in close proximity to the pickup and deposit (P&D) point. Consequently, in addition to overall warehouse design, we present the academic literature concerned with order picking and storage layout, as routing and storage policies represent key decisions in overall warehouse design.
2.1. Overall Warehouse Design
Two factors make overall warehouse design a challenging problem: the number of possible designs and the interactions among the functional components of the warehouse. In a review of warehouse design papers, Gu et al. [14] state that published research in overall warehouse design consists of qualitative models with simplifying assumptions. Further, the authors assert that a simple, validated model that provides results for guiding overall structural de-sign would be a valuable research contribution. Currently, simulation is the most common method for assessing warehouse performance in both research and industry, and more com-putational tools for warehouse design and operation may encourage a closer alignment of academic research with practical application [14].
A survey paper by Rouwenhorst et al. [30] characterizes warehouses in terms of processes, resources and organization, and the authors classify design problems at the strategic, tactical and operational levels. The authors contend that design decisions at the strategic and tactical level are often interrelated and require joint consideration. Further, the authors conclude that the majority of research papers address isolated subproblems, and they recognize the need for an integration of models and methods in order to develop a methodology for systematic warehouse design. Van den Berg et al. [31] present a hierarchy of warehousing decisions for operational planning and control, and the authors present the methods and models that have appeared in the literature for each area.
According to the survey papers by van den Berg et al. [31], Rouwenhorst et al. [30], and Gu et al. [13], research in the area of overall warehouse design is limited. Furthermore, no comprehensive synthesis of models and techniques for overall warehouse design has been developed [30, 13]. Thus, an overall warehouse design methodology should provide the following:
• a quantitative comparison of design alternatives, and
• an initial design that can be further optimized to meet specific design requirements. Research in the area of overall warehouse design generally falls into one of two categories: 1) solution procedures that provide a general, qualitative design framework, and 2) detailed models that provide a quantitative comparison of design alternatives. The papers that provide a quantitative comparison of solutions to the design problem often include models that require an extensive number of input parameters and are not general enough to apply to a broad range of warehouses. We first present the research papers that include general design frameworks and then discuss design methodologies that provide quantitative solution procedures.
Baker and Canessa [3] assert that no comprehensive, systematic methodology has been achieved for warehouse design. The authors performed a survey of research papers in the area
of overall warehouse design, grouping them as those that examine tools and techniques and those that address overall steps in the design process. The authors then compared the papers and formulated a general framework of steps in order to assist practitioners and researchers in a more comprehensive warehouse design methodology. To validate the framework, twelve warehouse design companies were interviewed and responses from seven of the contacts were used to improve the framework. The steps in the proposed framework are as follows: 1) Define system requirements, 2) Define and obtain data, 3) Analyze data, 4) Establish unit loads to be used, 5) Determine operating procedures and methods, 6) Consider possible equipment types and characteristics, 7) Calculate equipment capacities and quantities, 8) Define services and ancillary operations, 9) Prepare possible layouts, 10) Evaluate and assess, and 11) Identify the preferred design. The paper offers tools and references for each of the steps, but the authors note that there is less consensus on the tools to be used for each step. Ashayeri and Gelders [2] categorize solution procedures as analytical, simulation or heuristic and identify the research in each area. The authors suggest a two-step technique for system design that first uses analytical models to prune the decision space, and then introduces simulation to capture the dynamic aspects of the simplified analytical models. Yoon and Sharp [32] presented a systematic design procedure for order-picking systems with functional areas for order picking to assist designers in determining alternatives for order-picking configurations. The structured design procedure occurs in three stages including: analysis of order transaction data, selection of equipment types and operating strategies, and evaluation in terms of a performance analysis for each subsystem. The selection stage includes four design tasks that require joint consideration: calculation of storage capacity, equipment and operating policy specifications, physical transformations of load types, and sorting area specifications. The evaluation stage includes a performance analysis for each subsystem. No specific models are presented for throughput calculations for each subsystem, though the authors reference previous research for these calculations.
de-sign alternatives. First, Gray et al. [12] developed a model for overall dede-sign with the objective of minimizing initial incremental costs and operating costs including labor and inventory holding costs. In order to reduce the complexity of the formulation, the authors propose a hierarchical decomposition of the problem with three decision levels: facility design and technology selection, item allocation and assignment, and operating policy (number of pickers and zones, number of orders per batch, number of sorters, etc.). Analytical models were developed for a specific company for the assignment of items to zones, item facings and aisle length, assignment of items to storage types, order batch size, number of pickers and zones, and pick cycle time. The analytical models were coordinated to prune the decision space, and simulation was used to evaluate the alternative designs and to validate the an-alytical models. The solution procedure involved iteration among the three decision levels, and the authors estimated a labor savings of close to 50% with the new design. The authors acknowledge that a detailed formulation for general use is not viable because specific features would have to be considered that are not necessarily applicable to other problems.
Next, Park and Webster [22] formulated a design model for a unit-load warehouse. Ana-lytical models were developed to determine land, building, equipment, labor and operating costs. The solution procedure requires input parameters for product flow and equipment characteristics and costs. An iterative process is used to determine the maximum inventory levels, initial investment and annual costs, and storage and equipment requirements. The procedure enumerates all possible storage rules, equipment types, control procedures and equipment patterns. The authors illustrate the solution procedure through a case study that considers three alternative designs: a fully automated AS/RS, narrow-aisle lift trucks, or counter-balanced lift trucks. The design model produced three superior alternatives that all employed an AS/RS with a dual-command control procedure and with simultaneous, two-dimensional movement. The final step involved choosing among random, two-class or three-class storage rules. The authors acknowledge that obtaining cost and model parameters for individual firms would require considerable effort.
Finally, Apple et al. [1] proposed an empirically based warehouse design methodology that uses a qualitative list of factors to consider (usually in the form of checklists), as well as quantitative matrix solution guides. Pareto charts are suggested to subdivide the warehouse activities in terms of storage and activity for each handling unit, and FFNs are used to rep-resent each conceptual design. Each functional area is then sized (using available tools), and trial block layouts are developed that seek to minimize handling distances. Finally, product flows are synchronized and connecting processes, slotting, and zoning/batching procedures are developed in order to estimate material handling and labor costs. The paper also lists situations that may warrant moving from a manual to an automated warehouse. The au-thors acknowledge that in order to implement such a methodology, work in two areas must be accomplished. First, standardized definitions for process descriptions must be developed, and second, the quantitative matrix solution tables must be populated.
2.2. Storage Layout
Rosenblatt and Roll [29] introduced a twelve-step procedure to determine the optimal storage design in terms of warehouse capacity and extent of randomness in order to minimize the costs associated with shortage of space (resulting in rejection of incoming shipments), as well as costs for construction, handling, and storage policy, where the cost models are assumed to be known. The authors point out that random storage in larger zones results in better utilization of storage within the warehouse. Thus, for a class-based storage system, the storage utilization would decrease as the number of classes increases.
Frazelle et al. [10] developed a procedure to first determine the best size of the forward area and then determine which products should be included in the forward area, as well as in what quantities. A case study was used to illustrate the procedure, resulting in a 40 percent reduction in order-picking costs.
Jarvis and McDowell [18] developed a stochastic model to allocate product to storage locations based on the traversal routing strategy. Using the results from the model, the
authors developed an assignment algorithm to minimize the within-aisle travel by grouping products with the lowest demand in an aisle and the products with the next lowest demand in another aisle, until all products have been assigned to an aisle. The algorithm assigns the products with the highest demand to the centermost aisles, while the products with the lowest demand are placed in the outermost aisles, such that the aisles in the warehouse are symmetrical. The authors determined that the factors that influence the optimal product location in a warehouse include the average number of picks per order, the number of items in the warehouse, and the shape of the ABC curve. Based on their research, the shape of the ABC curve has the greatest impact on the number of aisles traversed, and as the number of picks per order increases, the optimal product layout has less of an impact on the number of aisles crossed.
As noted by Le-Duc and de Koster [20], there is no general rule for determining the storage boundaries in the diagonal layout. In the diagonal layout, each aisle contains different storage classes, and storage boundaries for each class differ across aisles. Thus, the authors developed a heuristic to determine the optimal (or near optimal) storage boundaries using a travel distance approximation for the diagonal layout, where each aisle is assigned a storage boundary for each product class. Their results indicated that for a large number of picks, the storage boundaries for each class should be the same across all aisles. This layout is known as the identical-aisle or across-aisle layout. They found that for a small number of picks, the warehouse shape plays a role in determining the optimal storage boundaries for each class. Further, their results indicated that the identical-aisle layout provided very near optimal results, regardless of the number of picks.
Heskett [16] was the first to introduce the concept of Cube-Per-Order Index (COI) that locates items based on the space required per cubic feet divided by the order frequency.
2.3. Travel-Time Models
2.3.1 Put-away Operation
Francis [9] was the first to develop a model for the expected travel in a warehouse. The distance approximation assumed a single pickup and deposit location for a single item (akin to the put-away operation). The resulting model was used to show that the optimal shape of a warehouse is one that is twice as wide as it is long.
Bassan et al. [5] developed expressions for optimal design parameters for two aisle layouts with random storage when considering the costs associated with handling, warehouse area, and building perimeter. The handling costs are based on the expected annual travel distance for the storage and retrieval of an item (a put-away operation). The authors also consider the optimal warehouse shape if random access to any door is allowed. In their analysis, they considered each door individually and found that the minimum distance is achieved from the middle of the longitudinal wall. Thus, like Francis [9], they concluded that a warehouse that is twice as wide as it is deep is optimal.
2.3.2 Order-Picking Operation
Order picking has received considerable attention in the warehousing literature because man-ual systems tend to be highly labor-intensive, while automated systems can be very capital-intensive [19]. Manual warehouses are often referred to as “picker-to-part” systems, and automated warehouses are characterized as “part-to-picker” systems. Ratliff and Rosenthal [27] developed an algorithm to determine the optimal order-picking tour in a picker-to-part warehouse; however, the optimal tour is often confusing to the order picker and difficult to implement with current warehouse management system software. Thus, heuristic strategies are primarily used in practice. However, Bartholdi and Hackman [4] point out that ad-vances in technology will eventually allow order pickers to receive precise travel instructions, allowing implementation of optimal pick paths.
Hall [15] developed analytical models for the traversal, midpoint, and largest gap strate-gies in a random storage warehouse and presented rules of thumb for choosing between these strategies. The models that Hall [15] developed indicated that the largest gap and midpoint strategies are close to optimal when the number of aisles is larger than the number of picks. Further, Hall determined that the largest gap strategy is preferred over the traversal strategy when the number of picks per aisle is less than 3.8. In terms of warehouse shape, Hall [15] found that as the number of stops per tour increases, the traversal strategy favors a wider warehouse (with a higher width-to-depth shape ratio).
Petersen [23] compared the results of four routing policies (traversal, return, largest gap, and composite) to optimal routing for a random storage warehouse with 1,000 storage locations. The parameters for warehouse shape, P&D location, and number of picks were varied to determine the effect on the performance of the routing strategy. Results from the experiment indicated that as the warehouse becomes wider (the number of aisles increases), the performance of the routing strategies becomes more consistent and similar. Further, the performance of the traversal strategy improves as the number of stops increases, while the composite, largest gap and midpoint strategies produce results that are similar to the optimal route. Petersen [23] also compared the mean route lengths for a centrally located P&D point and a corner P&D point and found that a centrally located P&D point results in a travel savings of only 0.9 percent over a corner P&D point.
Caron et al. [6] considered the optimization of a COI-based storage layout and two routing policies for a warehouse with two sections separated with a cross-aisle. The aisles are assumed to be parallel to the front of the warehouse with two sections of aisles separated by a center cross aisle and the P&D point. For the return strategy, the items with the lowest COI value were placed at the ends of the aisles nearest the centermost cross aisle; for the traversal strategy, the items with the lowest COI value were placed in the aisles nearest the front of the warehouse, leaving the back aisles for the items with the highest COI values. For the return policy, the expected number of picks in an aisle is calculated based on the
total picks divided by the number of aisles. This results in an overestimation of the expected within-aisle travel, with a maximum error for low values ofn (n <1, where n is the number of picks per aisle). The model for the traversal policy overestimates the within-aisle travel due to the return travel to the front of the warehouse (which is calculated as half of the aisle length). The results indicate that the return policy outperforms the traversal policy only when the number of picks per aisle is less than one or for highly skewed COI-based ABC curves. Also, a frequent relocation of items is necessary to maintain the strict COI storage policy with the return strategy.
Petersen and Schmenner [25] evaluated the various routing heuristics and compared them to the optimal route for volume-based storage, as well as the impact of pick list size and demand skewness on routing policies. An experimental design was conducted for a warehouse with 1,000 storage locations and 10 aisles. The factors considered in the analysis included six routing policies, eight storage layouts and P&D combinations, five pick list sizes and three levels of demand skewness. The authors found that within-aisle storage is the best overall volume-based storage policy. Based on their experimental results, the authors concluded that the perimeter and across-aisle layouts do not perform well, but they may work well for a warehouse where congestion is a problem. The results also indicated that as the demand skewness increases, there is less of a difference in performance among the routing policies. Further, the return policy works well with the diagonal and across-aisle storage layouts, and traversal routing performs the best for the within-aisle storage layout. Their research also shows that the return policy works well for a small number of picks.
Petersen and Aase [24] used a simulation model to compare class-based storage to a strict volume-based storage policy, as well as a random storage policy, for order-picking travel. Their results indicated that class-based storage saves travel as compared to random storage, and the performance approaches that of a strict volume-based storage policy as the number of storage classes increases. With two classes the results showed a 78 percent improvement over random storage, while three classes yielded a 90 percent improvement, and
four classes improved travel by 94 percent. In their experiment the authors also found that the traversal routing policy produced routes that were nine percent longer than the optimal route, and only six percent above optimal when using class-based storage and volume-based storage. The level of savings depends on the number of picks, as large pick lists have a greater probability of containing less popular items.
Hwang et al. [17] developed analytical models to determine order-picking travel based on a COI storage policy. The models included the return policy for the across-aisle layout, the traversal policy for the within-aisle layout, and the midpoint policy for the perimeter layout (where the fastest-moving items are placed in the outermost perimeter of the warehouse, and the slowest-moving items are located in the innermost storage locations). The performance of the three policies were compared by varying the number of picks, the skewness parameter for the COI-based ABC curve, and the shape ratio of the warehouse. Based on the models, the return policy performed well for a small number of picks (N=4), and the traversal policy performed the best for a large number of picks (N=64 to 80). In general, however, the midpoint policy outperformed both the traversal and return policies in terms of minimizing order-picking travel. Hwang et al. [17] also found that a highly skewed ABC curve can significantly reduce travel, regardless of the routing policy. Further, the authors concluded that the best warehouse shape is such that the length is twice as long as the width of the warehouse.
Le-Duc and de Koster [20] developed a model to estimate the travel required for an order-picking tour using the diagonal or across-aisle layout with the return policy. The model accounts for the fact that the storage boundaries for each class within an aisle may not be identical across all aisles. First, the expected number of picks within an aisle is calculated, and the expected value is then used to determine the number of picks within each class in the aisle. The model allows for a cross aisle between storage classes, where the order picker visits the farthest pick in an aisle and then returns only as far as the cross aisle. This can result in a travel reduction in aisles where there are picks for slower-moving items
but no picks for fast-moving items.
Goetschalckx and Ratliff [11] considered the side-to-side travel in an aisle where the aisles are at least twelve feet wide, and they develop an optimal-traversal algorithm that was shown to save as much as 30 percent in travel time over commonly used policies. Their optimal algorithm was found to perform well except in cases where the pick density is low and aisles are narrow. The authors found that the breakpoint for the return policy versus the traversal policy depends on the density of picks and the width of the aisle, but for most practical densities, an all-traversal policy is better than a return policy.
Parikh and Meller [21] were the first to consider the vertical travel component of order picking. They developed throughput models that consider both Tchebychev and rectilinear travel for a random storage warehouse with single-deep pallet storage. The resulting model can be used to determine the optimal system configuration in terms of the number, length, and height of the storage aisles to meet storage and throughput requirements. A simple cost-based optimization model that considers the cost of pickers, equipment and space was used to evaluate the optimal height of the storage system. The authors concluded that the optimal storage height tends to decrease for a system with a high throughput requirement but increases as the cost of storage space increases.
Roodbergen et al. [28] developed analytical models for the S-shape heuristic that mini-mizes travel for order picking by identifying a layout structure with one or more blocks of parallel aisles. A layout optimization model is presented that finds the best balance between cross-aisle and within-aisle travel such that the total travel distance is minimized. The au-thors found that if aisles are very long, an additional cross aisle will significantly reduce the within-aisle travel (while only slightly increasing the cross-aisle travel.) However, for short subaisles, the extra cross aisle still reduces the within-aisle travel, but the gain is smaller due to the increased travel in the cross aisles. The authors contend that it is always better to have a multiple-block layout (at least one center cross aisle), unless the pick density is high and the cross aisles are wide.
Chew and Tang [7] model the order-picking travel for a traversal policy with a corner P&D point. The model is based on the occupancy problem and is applicable to any item-location assignment. The occupancy problem [8] involves determining the probability of filling exactly J urns (out of M possible urns) with at least one of n balls such thatJ ≤M
(i.e., determining the number of aisles that have at least one pick). However, the model does not apply to the diagonal or identical-aisle layouts, as it assumes a single probability for visiting a given aisle. The authors then model the total order-picking system as a queueing system that includes picking time, as well as sorting time.
2.3.3 Replenishment Operation
Very little research has considered the distance required for a replenishment operation. How-ever, Pohl et al. [26] developed travel-time models for dual-command cycles in a unit-load, random-storage warehouse. The travel-between portion of the dual-command cycle is akin to the travel required for a replenishment operation. In this segment of the dual-command cycle, the worker performs a storage operation and then travels to a retrieval location be-fore returning to the P&D point. With replenishment travel, however, instead of returning to a P&D location, the worker would travel to the reserve storage location for the next replenishment.
2.4. Summary of Literature Review
The published papers in the area of overall warehouse design are limited, and the models that have been proposed tend to be more qualitative, rather than quantitative. The numerous design options and interrelationships among functional areas of the warehouse make this a difficult problem to solve. Thus, a comprehensive model that provides quantitative results is needed.
Research in the area of storage layout has shown that order-picking travel can be reduced by using a volume-based layout versus a random storage layout. This is important because
order picking is the most labor-intensive operation in most warehouses. Consequently, order picking has received considerable attention in warehousing literature. Models have been developed for various routing strategies, but most assume a random storage policy and a single P&D point. Two papers have considered travel models for COI-based storage, but this storage policy can require a frequent relocation of items if the order frequency is not consistent. Only one paper considers the travel for order picking in a class-based storage layout where each aisle can contain more than one class. The put-away operation has been modeled for a random storage warehouse with a central P&D point, but the replenishment operation has received little attention in the literature.
Bibliography
[1] Apple, J. M., Meller, R. D., and White, J. A., “Empirically-Based Warehouse Design: Can Academics Accept Such an Approach?,” inProgress in Material Handling Research: 2010, Charlotte, NC (2010).
[2] Ashayeri, J., and Gelders, L., “Warehouse Design Optimization,” European Journal of
Operational Research, 21, 285–294 (1985).
[3] Baker, P., and Canessa, M., “Warehouse Design: A Structured Approach,” European
Journal of Operational Research, 193, 245–258 (2009).
[4] Bartholdi, J. J., and Hackman, S. T., Warehouse & Distribution Science, Version 0.95 (2011).
[5] Bassan, Y., Roll, Y., and Rosenblatt, M. J., “Internal Layout Design of a Warehouse,”
IIE Transactions, 12, 4, 317–322 (1980).
[6] Caron, F., Marchet, G., and Perego, A., “Routing Policies and COI-Based Storage Policies in Picker-to-Part Systems,” International Journal of Production Research, 36, 713–732 (1998).
[7] Chew, E. P., and Tang, L. C., “Travel Time Analysis for General Item Location As-signment in a Rectangular Warehouse,”European Journal of Operational Research, 112, 582–597 (1999).
[8] Feller, W.,An Introduction to Probability Theory and Its Applications: Volume I, Wiley, New York, NY (1968).
[9] Francis, R. L., “On Some Problems of Rectangular Warehouse Design and Layout,”
The Journal of Industrial Engineering, 18, 10, 595–604 (1967).
[10] Frazelle, E. H., Hackman, S. T., and Platzman, L. K., “Improving Order Picking Productivity through Intelligent Stock Assignment Planning,” in Proceedings of the
Council of Logistics Management, 353–371 (1989).
[11] Goetschalckx, M., and Ratliff, H. D., “Order Picking in an Aisle,” IIE Transactions, 20, 53–62 (1988).
[12] Gray, A. E., Karmarkar, U. S., and Seidmann, A., “Design and Operation of an Order-Consolidation Warehouse: Models and Application,” European Journal of Operational
Research, 58, 14–36 (1992).
[13] Gu, J., Goetschalckx, M., and McGinnis, L. F., “Research on Warehouse Operation: A Comprehensive Review,” European Journal of Operational Research, 177, 1–21 (2007).
![Figure 1.2: Warehouse design and operational decisions adapted from [5].](https://thumb-us.123doks.com/thumbv2/123dok_us/1785071.2754650/21.918.176.742.101.654/figure-warehouse-design-operational-decisions-adapted.webp)