Beliefs about God across Time and Countries
Tom W. Smith NORC/University of Chicago
EMBARGOED FOR RELEASE APRIL 18, 2012 12:15 AM EASTERN TIME
Report for ISSP and GESIS
Introduction
In 1966 the cover of Time magazine (April 8) asked the provocative question, “Is God Dead?” Three years later Time’s cover (December 26, 1969) raised a new query, “Is God Coming Back to Life?” Social scientists have also waivered back and forth about the global state of religion and it likely future (Gorski and Altinordu, 2008). Standard secularization theory has argued that societies become less religious as they develop with education and the rise of science undermining both religious belief and religious practices (Kay, 1997; Voas, 2009). Others, while still finding a shift to secularization with development, have modified standard secularization theory. Norris and Inglehart (2011) argue that development reduces “existential insecurity” and this in turn lessens the demand for (or need for) religion. Others have argued that religion has been undergoing and will continue to undergo a
transformation (such as a rise in spirituality alongside a weakening of organized religion, Smith, 2009), but not a clear decline. Still others see little secularizing trends (Greeley, 2003). The so-‐called supply-‐side school emphasizes the enduring demand for religion (Stark, 1999; Stark and Finke, 2000).
This paper focuses on one central, but relatively neglected, aspect of secularization and religious change, belief in God (Kay, 1997; Norris and Inglehart, 2012; Smith, 2009; Ziebertz, 2002). The
international Social Survey Program (ISSP) has asked three questions focusing on belief in God (Appendix 1). The first covers six levels of belief which can be characterized as 1) atheists, 2) agnostics, 3) deists, 4) waivers, 5) weak believers, and 6) strong believers. The second question asks about changes in belief in God over the life course and consists of consistent atheists, current atheists – but former believers, current believers – but former atheists, and consistent believers. The third question is an agree/disagree item asking about belief in a personal God (i.e. “a God who concerns himself with every human being personally”).
The ISSP Religion studies covered 18 countries in 1991 (counting East and West Germany and Northern Ireland and Great Britain separately), 33 countries in 1998, and 42 countries in 2008. This paper analysis the 30 countries that were in at least two of the three ISSP rounds and appear in the 1991-‐2008 merged ISSP Religion file created by GESIS.
Cross-‐National Rakings of Belief in God
Table 1 shows the rank in 2008 on atheism (listed from high to low) and strong belief in God (listed from low to high). Atheism ranges from 52% in the former East Germany to less than 1% in the Philippines. Strong belief shows largely the reverse pattern falling from 84% in the Philippines to 4% in Japan (and second lowest at 8% in East Germany). Countries with high atheism (and low strong belief) tend to be ex-‐Socialist states and countries in northwest Europe. Countries with low atheism and high strong belief tend to be Catholic societies, especially in the developing world, plus the United States, Israel, and Orthodox Cyprus. In the case of Poland, it appears that its strong Catholicism trumps the secularizing influence of Socialism. There is also evidence that religious competition and/or religious conflict may stimulate higher belief. Belief is high In Israel which of course has a sharp conflict between Judaism and Islam, in Cyprus which in divided along religious and ethnic lines into Greek/Orthodox and Turkish/Muslim entities, and in Northern Ireland which is split between Protestant and Catholic
communities and shows much higher belief levels than the rest of the United Kingdom. In the United States there is relatively little overt religious conflict, but intense religious competition across both major religions and denominations within Christianity. The one country that shows a low association between the level of atheism and strong belief is Japan. Japan ranked lowest on strong belief, but also in the lower half on atheism (a difference of 18 positions across the two rankings when the average
difference in positions was only 2.7 places). Japan is distinctive among countries in having the largest number of people (32%) in the middle categories of believing sometimes and the agnostic, not knowing response. This pattern is consistent with a general Japanese response pattern of avoiding strong, extreme response options (Smith, 2004).
Table 2 shows belief in 2008 about changes in belief in God over time. The first column shows consistent atheists and runs from a high of 59% in East Germany down to 2% in Poland. The second column shows consistent believers ranging from 13% in East Germany to 94% in the Philippines. The reversed rankings are quite similar across almost all countries and closely match the pattern shown about belief in God in Table 1.
Table 3 shows that the percent believing in a personal God (“who concerns himself with every human being personally”) rises from 8% in East Germany to 92% in the Philippines. Once again the rankings closely follow those in Tables 1 and 2.
Tables 4 and 5 combine the three measures of beliefs about God in one index. Table 4 shows strong, traditionalist believers on all three questions -‐ those certain that God exist s who have always believed in God and who strongly agree that there is a personal God. Table 5 shows the opposite group, strong atheists -‐ those who don’t believe in God who have never believed in God and who strongly disagree that there is a personal God. Strong believers range from 60% in the Philippines down to 2.5% in East Germany, while strong atheists run from almost none (0.1%) in the Philippines to 46% in East Germany.
Changes in Belief in God over Time
Changes in belief in God have generally been modest in magnitude, but belief has tended to diminish over time. As Table 6A shows, the % saying they were atheists increased in 15 of 18 countries from 1991 to 2008 with an average increase of 1.7 percentage points. For 1998 to 2008, atheists grew in 23 of 30 countries for an average gain of 2.3 points. Conversely, as Table 6B indicates, certain belief in God declined in 14 of 18 countries from 1991 to 2008 with an average decrease of 2.4 points and from 1998 to 2008 loses occurred in 24 of 30 countries for a similar average decline of 2.4 points. Likewise, Table 6C shows that never believing in God rose in 14 of 17 countries from 1991 to 2008 for an average increase of 1.6 points and increased in 20 of 29 countries from 1998 to 2008 by an average gain of 2.2 points. As Table 6D indicates, the decline in belief in a personal God was somewhat weaker. From 1991 to 2008 it fell in 10 of 18 countries for an average drop of 0.8 points. For 1998 to 2008 belief in a personal God declined in 20 of 30 countries by an average of 2.0 points.
personal God). Five countries had a mixed pattern with some measures moving towards and some away from belief (West Germany, Hungary, Italy, the Philippines, and the United States). Ten countries showed consistent decline in belief (Australia, Austria, East Germany, Great Britain, Ireland, the Netherlands, New Zealand, Northern Ireland, Norway, and Poland). For 1998 to 2008 five countries (West Germany, Israel, Japan, Russia, and Slovenia) showed consistent growth in belief. Nine countries (Denmark, East Germany, Hungary, the Philippines, Poland, Slovakia, Spain, Switzerland, and the United States) had a mixed pattern with movement (mostly small) in opposite directions. Sixteen countries showed decreases in belief on all measures.
While Russia and Slovenia showed consistent movement towards greater belief, counter to some other evidence of a general religious “revival” among ex-‐Socialist states (Norris and Inglehart, 2011; Smith, 2009), there is no general increase in belief in the former Soviet bloc. Across the four measures of change and eight countries, 12 showed movement in the religious direction and 20 away from belief. Most of the changes in either direction were small.
For Israel the religious shift may reflect the growing size of the orthodox Jewish and right-‐wing population and the relative decline of the more secular and leftist segment in Israeli society (Rebhun and Waxman, 2004). The original Zionist movement that re-‐established Israel was of course “religious” since it was a “Jewish” movement, but the movement had a strong secular and Socialist component to it. That orientation seems to have diminished in recent decades and been supplanted by a more overtly religious perspective.
Another way of looking at change over time is to look at the item on consistency in beliefs about God over one’s lifetime. Table 7 compares those shifting towards faith (“I believe in God now, but I didn’t use to.”) with those moving away from belief (“I don’t believe in God now, but I used to.”). In 2008 there was a net gain in belief across the life course in 12 countries and a decline in 17 countries. The gains averaged 4.1 points and the losses -‐7.0 points for an overall change of -‐2.4 points.
Cross-‐National Differences across Age Groups
Table 8A shows that in 2008 in 29 of 30 countries certain belief in God increased with age. The average increase from those 27 and younger to those 68+ was 20.0 points. Similarly, Table 8B indicates that in 2008 in 27 of 30 countries never believing in God fell with age. The average decrease was 13.7 points. Likewise, agreeing that there is a personal God increased with age in 2008 in 28 of 30 countries by an average of 15.8 points. Overall, belief increased with age in 83 of 89 comparisons (93%) and averaged +16.5 across the three measures. Only one country, Israel, showed a consistent reversed pattern with belief declining with age by an average of -‐13.1 points. The Philippines, Russia, and Japan each had a single negative association with age, but across all three measured showed increased belief with age.
Looking at the differences across adjoining age groups shows that the largest increases were most often between the 58-‐67 year olds and those 68+ (Having biggest difference Lt 28 to 28-‐37 18.5%; 28-‐37 to 38-‐47 9.0%; 38-‐47 to 58-‐67 20.2%, and 57-‐68 to 68+ 42.7%). This suggests that belief in God is
especially likely to increase among the oldest groups, perhaps in response to the increasing anticipation of mortality occurring.
A comparison was also carried out of changes across time with cohort. It showed little clear indication overall of either aging or cohort effects. Across the five cohorts that could be tracked from 1998 to 2008 certain belief in God decreased in 64 instances and increased in 86 cases. Decreases and increases were exactly balanced (50% each) for the three cohorts under age 48 in 1998. Increases then grew to 63% for the 48-‐57 cohort in 1998, to 73% for the 58-‐67 cohort in 1998. This interaction further supports the idea that there is an aging effect in which belief increases as the anticipation of morality rises. But there is also some evidence of a cohort effect. Comparison of the entering cohorts (less than 28) in 1998 and 2008 indicates lower belief in 2008 than in 1998 in 77% of the countries; an average decline of 2.5 points. This suggests that new cohorts are starting adulthood with lower belief than earlier entering cohorts, perhaps due to growing secularization over time.
It is noteworthy that of the only three countries that had increases in overall belief on all three measures (Israel, Russia, and Slovenia), they were also the only countries that had increases in belief across all cohorts.
Conclusion
Belief in God has decreased in most countries, but the declines are quite modest especially when calculated on a per annum basis. It is only the repetition of the modest declines across measures and countries that makes the case for a general diminution in belief in God. This is further illustrated by the situation in the United States. Belief in God remains high, but has slowly eroded from the 1950s to the present (Chaves, 2011; Smith, 2009 & 2012). If the modest, general trend away from belief in God continues uninterrupted, it will accumulate to larger proportions and the atheism that is now prominent mainly in northwest Europe and some ex-‐Socialist states may spread more widely. But it is also possible that the pro-‐belief “exceptions” (Russia, Slovenia, and Israel) may become more widespread and belief may make more of a general rebound perhaps in response to a growth in “existential insecurity,” from a nationalistic, in-‐group growth in religious identity (e.g. Arab, Islamic movements, Hindu nationalism, etc.), or from some other societal impetus.
While the age-‐group differences suggest the possibility of changes across cohorts that represent larger, more widespread, and longer-‐term declines in belief in God, these figures confound cohort and aging effects and the analysis suggests that a substantial component of the age-‐group differences results from aging effects rather than from changes across cohorts. This is supported by earlier analysis of church attendance and religious identification that indicates aging/life-‐cycle effects (Smith, 2009).
While there is a modest, general shift away from belief in God, there is enormous variation across countries in the level of believers, atheists, and intermediate groups. Certitude that God exists ranges from 84% in the Philippines to 4% in Japan and conversely atheism rises from less that 1% in the Philippines to 52% in the East Germany. Similarly, strong believers run from 60% in the Philippines down to 2.5% in East Germany, while strong atheists rise from nearly zero in the Philippines to 46% in East
Germany. Even within the former Socialist states, the range is enormous with East Germany of course anchoring the secular pole and Poland near the top for believers .
Thus, while there is a drift towards lesser belief in god consistent with secularization theory the changes are modest in magnitude and mixed in scope. Countries have shown and are likely to continue to show huge differences in levels and trends about belief in God and a homogenization of belief (or disbelief) is unlikely to occur in the foreseeable future.
Table 1
Countries Ranked on Atheism and Strong Belief in God (2008)
Country % I don’t believe Country % I know God in God. really exists and
I have no doubts
about it.
Germany (East) 52.1 Japan 4.3
Czech Republic 39.9 Germany (East) 7.8
France 23.3 Sweden 10.2
The Netherlands 19.7 Czech Republic 11.1
Sweden 19.3 Denmark 13.0
Latvia 18.3 Norway 14.8
Great Britain 18.0 France 15.5
Denmark 17.9 Great Britain 16.8
Norway 17.4 The Netherlands 21.2
Australia 15.9 Austria 21.4
Hungary 15.2 Latvia 21.7
Slovenia 13.2 Hungary 23.5
New Zealand 12.6 Slovenia 23.6
Slovakia 11.7 Australia 24.9
Germany (West) 10.3 Switzerland 25.0
Spain 9.7 New Zealand 26.4
Switzerland 9.3 Germany (West) 26.7
Austria 9.2 Russia 30.5
Japan 8.7 Spain 38.4
Russia 6.8 Slovakia 39.2
Northern Ireland 6.6 Italy 41.0
Israel 6.0 Ireland 43.2
Italy 5.9 Northern Ireland 45.6
Portugal 5.1 Portugal 50.9
Ireland 5.0 Cyprus 59.0
Poland 3.3 United States 60.6
United States 3.0 Poland 62.0
Chile 1.9 Israel 65.5
Cyprus 1.9 Chile 79.4
The Philippines 0.7 The Philippines 83.6
Table 2
Belief in God Over Time (2008)
Country I don’t believe in Country I believe in God
God and I never now and I always
have. have.
Germany (East) 59.4 Germany (East) 13.2
Czech Republic 51.2 Czech Republic 19.7
Sweden 32.0 Japan 25.0
Latvia 29.5 Sweden 25.5
Japan 27.2 France 28.9
Norway 25.5 Norway 35.6
The Netherlands 24.7 Latvia 36.1
Denmark 24.3 Denmark 36.5
France 24.3 Great Britain 36.7
Hungary 23.1 Russia 37.3
New Zealand 21.1 New Zealand 37.9
Australia 20.6 Hungary 39.0
Great Britain 20.0 Australia 39.1
Slovenia 19.1 The Netherlands 39.8
Slovakia 14.2 Switzerland 47.8
Switzerland 12.4 Slovenia 47.9
Russia 10.9 Slovakia 51.4
Germany (West) 9.2 Germany (West) 54.2
Israel 8.6 Spain 67.4
Spain 8.4 Ireland 70.6
Italy 7.4 Northern Ireland 71.4
Portugal 5.5 Italy 72.1
Northern Ireland 4.6 Israel 73.2
United States 4.4 Cyprus 76.5
Ireland 3.3 Portugal 78.9
Cyprus 2.4 Poland 80.2
The Philippines 2.1 United States 80.8
Chile 2.0 Chile 87.9
Poland 1.9 The Philippines 93.5
Table 3
Believing in a Personal God (2008) % Agreeing Germany (East) 8.2 Czech Republic 16.1 France 18.7 Sweden 19.1 Japan 24.0 The Netherlands 24.4 Norway 25.7 Great Britain 26.9 Slovenia 26.9 Austria 27.4 Denmark 28.2 Australia 28.5 Hungary 30.9 Germany (West) 32.0 New Zealand 34.2 Latvia 38.1 Spain 39.1 Russia 40.8 Switzerland 45.0 Slovakia 51.0 Italy 54.0 Cyprus 55.8 Portugal 58.1 Northern Ireland 59.5 Poland 59.6 Ireland 64.1 Israel 66.5 United States 67.5 Chile 71.8 The Philippines 91.9
Table 4
Strong Believers in God, 2008a
The Philippines 60.2 Israel 38.0 United States 35.0 Cyprus 30.5 Chile 29.0 Slovakia 28.4 Northern Ireland 25.8 Poland 23.6 Portugal 18.9 Ireland 17.8 Italy 16.7 New Zealand 16.7 Russia 16.4 Australia 15.9 Spain 13.2 Denmark 12.7 Norway 11.2 Switzerland 11.2 The Netherlands 11.0 Germany, West 10.9 Great Britain 10.3 France 9.9 Hungary 9.6 Slovenia 7.9 Sweden 7.1 Latvia 6.9 Czech Republic 5.8 Japan 3.3 Germany, East 2.5
a=% Certain God exists; Always believed in God; and Strongly agree there is a personal God
Table 5 Strong Atheists, 2008a Germany, East 46.1 Czech Republic 26.2 France 19.3 Sweden 18.4 Denmark 16.7 Norway 15.9 The Netherlands 15.3 Hungary 12.6 Great Britain 11.2 Slovenia 10.5 Australia 9.7 Slovakia 8.6 New Zealand 8.5 Latvia 8.2 Japan 7.6 Russia 6.4 Germany, West 4.9 Spain 3.6 Switzerland 3.6 Israel 3.3 Northern Ireland 2.6 Portugal 2.5 Ireland 1.9 Italy 1.7 United States 1.2 Cyprus 1.1 Chile 0.6 Poland 0.5 The Philippines 0.1
a% Don’t believe in God; Never believed in God; and Strongly disagree there is a personal God
Table 6
Changes in Belief in God over Time A. % Atheist 1991-‐2008 1998-‐2008 Australia + 7.3 + 6.4 Austria + 5.1 + 2.0 Chile -‐-‐-‐-‐ + 0.1 Cyprus -‐-‐-‐-‐ + 0.3 Czech Republic -‐-‐-‐-‐ +18.4 Denmark -‐-‐-‐-‐ + 3.4 France -‐-‐-‐-‐ + 5.6 Germany (East) + 3.4 -‐ 1.7 Germany (West) + 0.1 -‐ 1.9 Great Britain + 7.8 + 8.1 Hungary + 2.9 + 1.0 Ireland + 3.0 + 2.4 Israel -‐ 9.6 -‐ 1.8 Italy + 3.2 + 1.7 Japan -‐-‐-‐-‐ -‐ 1.8 Latvia -‐-‐-‐-‐ + 9.1 The Netherlands + 3.7 + 2.6 New Zealand + 4.9 + 4.8 Northern Ireland + 5.1 + 3.0 Norway + 7.9 + 5.8 The Philippines + 0.3 + 0.1 Poland + 1.3 + 1.0 Portugal -‐-‐-‐-‐ + 2.7 Russia -‐ 11.7 -‐ 11.7 Slovakia -‐-‐-‐-‐ + 0.7 Slovenia -‐ 5.2 -‐ 0.3 Spain -‐-‐-‐-‐ + 1.2 Sweden -‐-‐-‐-‐ + 2.6 Switzerland -‐-‐-‐-‐ + 5.2 United States + 0.7 -‐ 0.1
Table 6 (continued)
B. % Certain that God Exists 1991-‐2008 1998-‐2008 Australia -‐ 5.1 -‐ 1.6 Austria -‐ 6.5 -‐10.6 Chile -‐-‐-‐-‐ -‐ 1.0 Cyprus -‐-‐-‐-‐ -‐ 6.0 Czech Republic -‐-‐-‐-‐ -‐ 6.8 Denmark -‐-‐-‐-‐ -‐ 0.4 France -‐-‐-‐-‐ -‐ 5.8 Germany (East) -‐ 1.4 -‐ 1.5 Germany (West) + 0.6 + 3.3 Great Britain -‐ 6.4 -‐ 4.7 Hungary -‐ 7.0 -‐ 2.9 Ireland -‐ 15.4 -‐ 0.7 Israel +23.0 + 6.7 Italy -‐ 10.5 -‐ 6.7 Japan -‐-‐-‐-‐ + 0.4 Latvia -‐-‐-‐-‐ -‐ 1.1 The Netherlands -‐ 3.3 -‐ 5.0 New Zealand -‐ 2.5 -‐ 4.0 Northern Ireland -‐ 15.2 -‐ 4.9 Norway -‐ 4.7 -‐ 3.5 The Philippines -‐ 2.2 + 5.5 Poland -‐ 5.0 -‐ 5.5 Portugal -‐-‐-‐-‐ -‐ 9.4 Russia +17.3 + 6.9 Slovakia -‐-‐-‐-‐ -‐ 1.3 Slovenia + 2.7 -‐ 1.7 Spain -‐-‐-‐-‐ -‐ 7.0 Sweden -‐-‐-‐-‐ -‐ 2.0 Switzerland -‐-‐-‐-‐ -‐ 1.6 United States -‐ 0.8 + 0.2
Table 6 (continued)
C. % Never Believed in God 1991-‐2008 1998-‐2008 Australia +10.3 + 8.9 Austria -‐-‐-‐-‐ -‐-‐-‐-‐ Chile -‐-‐-‐-‐ + 0.0 Cyprus -‐-‐-‐-‐ + 1.5 Czech Republic -‐-‐-‐-‐ + 18.6 Denmark -‐-‐-‐-‐ -‐ 1.6 France -‐-‐-‐-‐ + 3.3 Germany (East) + 9.9 + 3.1 Germany (West) + 0.1 -‐ 3.5 Great Britain + 8.4 + 6.8 Hungary + 2.7 + 1.4 Ireland + 2.7 + 2.1 Israel -‐ 9.7 -‐ 3.8 Italy + 3.5 + 3.5 Japan -‐-‐-‐-‐ -‐ 1.5 Latvia -‐-‐-‐-‐ +10.6 The Netherlands + 4.2 + 3.8 New Zealand + 8.8 + 8.5 Northern Ireland + 3.3 + 0.6 Norway + 8.3 + 5.9 The Philippines + 0.2 -‐ 0.8 Poland + 1.1 + 0.4 Portugal -‐-‐-‐-‐ + 2.0 Russia -‐ 25.5 -‐ 16.7 Slovakia -‐-‐-‐-‐ -‐ 0.1 Slovenia -‐ 3.1 -‐ 0.7 Spain -‐-‐-‐-‐ -‐ 0.1 Sweden -‐-‐-‐-‐ + 4.2 Switzerland -‐-‐-‐-‐ + 4.9 United States + 2.6 + 1.8
Table 6 (continued)
D. Agrees That God Personally Concerned with People 1991-‐2008 1998-‐2008 Australia -‐ 9.1 -‐ 7.7 Austria -‐ 9.3 -‐ 4.7 Chile -‐-‐-‐-‐ -‐ 1.6 Cyprus -‐-‐-‐-‐ -‐11.5 Czech Republic -‐-‐-‐-‐ -‐ 5.0 Denmark -‐-‐-‐-‐ -‐ 8.3 France -‐-‐-‐-‐ -‐ 7.8 Germany (East) -‐ 2.6 -‐ 4.0 Germany (West) + 0.7 + 0.9 Great Britain -‐ 5.5 -‐ 2.2 Hungary + 3.7 + 4.0 Ireland -‐ 7.4 -‐ 7.7 Israel +20.4 + 2.8 Italy + 0.8 -‐ 1.3 Japan -‐-‐-‐-‐ + 2.7 Latvia -‐-‐-‐-‐ -‐ 2.7 The Netherlands -‐ 3.4 -‐ 4.4 New Zealand -‐ 4.1 -‐ 2.5 Northern Ireland -‐ 14.2 -‐ 2.1 Norway -‐ 5.8 -‐ 1.1 The Philippines + 2.9 + 3.7 Poland -‐ 3.7 + 0.5 Portugal -‐-‐-‐-‐ -‐ 16.2 Russia +19.1 + 9.3 Slovakia -‐-‐-‐-‐ + 0.1 Slovenia + 3.6 + 3.0 Spain -‐-‐-‐-‐ -‐ 0.7 Sweden -‐-‐-‐-‐ -‐ 1.3 Switzerland -‐-‐-‐-‐ + 8.0 United States + 0.6 -‐ 1.4
Table 7
Changes in Belief in God (2008)
“I believe in God now, but I didn’t use to.” Minus “I don’t believe in God now, but I used to.” Australia -‐ 12.0 Chile + 0.1 Cyprus + 0.2 Czech Republic -‐ 5.5 Denmark -‐ 6.1 France -‐ 11.3 Germany (East) -‐ 6.9 Germany (West) -‐ 5.4 Great Britain -‐ 10.1 Hungary + 1.0 Ireland -‐ 0.9 Israel + 2.6 Italy -‐ 2.7 Japan -‐ 1.5 Latvia + 11.9 The Netherlands -‐ 14.0 New Zealand -‐ 4.0 Northern Ireland + 1.0 Norway -‐ 11.0 The Philippines + 0.8 Poland -‐ 1.8 Portugal + 0.6 Russia + 16.0 Slovakia + 5.6 Slovenia + 8.5 Spain -‐ 12.4 Sweden -‐ 5.5 Switzerland -‐ 8.2 United States + 1.4
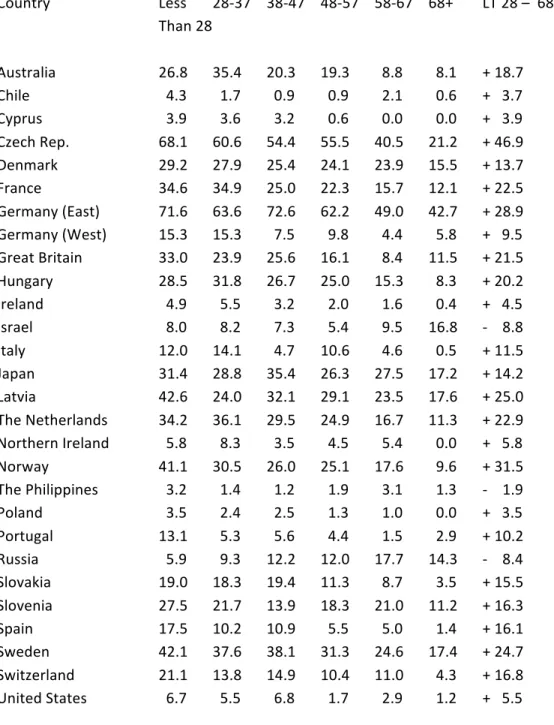
Table 8
Differences by Age by Country in 2008
A. % Certain God Exists Country Less 28-‐37 38-‐47 48-‐57 58-‐67 68+ 68+ -‐ LT 28 Than 28 Australia 14.7 21.1 27.9 23.0 29.7 36.7 + 22.0 Austria 7.7 22.8 16.4 22.2 33.3 31.9 + 24.2 Chile 66.1 77.6 80.7 85.7 85.3 92.8 + 26.7 Cyprus 47.8 47.8 58.2 69.0 74.3 89.4 + 41.6 Czech Rep. 6.0 6.5 7.2 11.4 12.7 26.4 + 20.4 Denmark 8.1 11.1 10.7 11.5 14.6 22.3 + 14.2 France 7.9 12.2 12.4 14.7 19.8 25.7 + 17.8 Germany (East) 0.0 6.8 6.8 8.9 8.3 12.7 + 12.7 Germany (West) 17.8 25.2 29.2 27.0 26.2 36.4 + 18.6 Great Britain 9.2 19.5 16.7 14.5 17.9 22.3 + 13.1 Hungary 15.9 17.2 16.3 22.4 30.7 40.4 + 24.5 Ireland 29.5 31.1 42.1 42.7 65.2 70.1 + 40.6 Israel 69.1 66.1 66.0 68.0 64.9 52.7 -‐ 16.4 Italy 35.9 36.0 37.0 42.9 48.4 66.7 + 30.8 Japan 2.0 2.7 3.2 4.8 4.1 7.8 + 5.8 Latvia 11.7 20.7 14.4 23.8 29.4 38.9 + 27.2 The Netherlands 20.8 16.4 18.2 14.8 23.0 34.3 + 13.5 New Zealand 18.8 23.3 27.7 29.9 31.6 30.2 + 11.4 Northern Ireland 35.3 33.5 40.2 41.5 57.2 70.6 + 35.3 Norway 8.5 12.6 15.9 13.3 21.1 18.3 + 9.8 The Philippines 76.4 85.8 85.0 85.1 85.2 85.9 + 9.5 Poland 48.4 58.4 62.6 66.4 66.3 79.3 + 30.9 Portugal 41.4 38.8 41.8 56.9 55.5 75.4 + 34.0 Russia 28.2 29.0 31.4 23.8 26.8 41.8 + 13.6 Slovakia 34.5 33.8 31.1 37.3 48.9 60.7 + 26.2 Slovenia 17.6 22.8 20.9 20.3 23.1 39.1 + 21.5 Spain 21.8 28.9 30.0 36.1 48.3 65.4 + 43.6 Sweden 8.4 9.3 10.0 11.5 8.2 14.9 + 6.5 Switzerland 15.6 23.3 21.1 27.4 19.9 42.2 + 26.6 United States 53.8 59.4 55.0 63.8 69.0 66.0 + 12.2
Table 8 (continued) B. % Never Believed Country Less 28-‐37 38-‐47 48-‐57 58-‐67 68+ LT 28 – 68+ Than 28 Australia 26.8 35.4 20.3 19.3 8.8 8.1 + 18.7 Chile 4.3 1.7 0.9 0.9 2.1 0.6 + 3.7 Cyprus 3.9 3.6 3.2 0.6 0.0 0.0 + 3.9 Czech Rep. 68.1 60.6 54.4 55.5 40.5 21.2 + 46.9 Denmark 29.2 27.9 25.4 24.1 23.9 15.5 + 13.7 France 34.6 34.9 25.0 22.3 15.7 12.1 + 22.5 Germany (East) 71.6 63.6 72.6 62.2 49.0 42.7 + 28.9 Germany (West) 15.3 15.3 7.5 9.8 4.4 5.8 + 9.5 Great Britain 33.0 23.9 25.6 16.1 8.4 11.5 + 21.5 Hungary 28.5 31.8 26.7 25.0 15.3 8.3 + 20.2 Ireland 4.9 5.5 3.2 2.0 1.6 0.4 + 4.5 Israel 8.0 8.2 7.3 5.4 9.5 16.8 -‐ 8.8 Italy 12.0 14.1 4.7 10.6 4.6 0.5 + 11.5 Japan 31.4 28.8 35.4 26.3 27.5 17.2 + 14.2 Latvia 42.6 24.0 32.1 29.1 23.5 17.6 + 25.0 The Netherlands 34.2 36.1 29.5 24.9 16.7 11.3 + 22.9 Northern Ireland 5.8 8.3 3.5 4.5 5.4 0.0 + 5.8 Norway 41.1 30.5 26.0 25.1 17.6 9.6 + 31.5 The Philippines 3.2 1.4 1.2 1.9 3.1 1.3 -‐ 1.9 Poland 3.5 2.4 2.5 1.3 1.0 0.0 + 3.5 Portugal 13.1 5.3 5.6 4.4 1.5 2.9 + 10.2 Russia 5.9 9.3 12.2 12.0 17.7 14.3 -‐ 8.4 Slovakia 19.0 18.3 19.4 11.3 8.7 3.5 + 15.5 Slovenia 27.5 21.7 13.9 18.3 21.0 11.2 + 16.3 Spain 17.5 10.2 10.9 5.5 5.0 1.4 + 16.1 Sweden 42.1 37.6 38.1 31.3 24.6 17.4 + 24.7 Switzerland 21.1 13.8 14.9 10.4 11.0 4.3 + 16.8 United States 6.7 5.5 6.8 1.7 2.9 1.2 + 5.5
Table 8 (continued)
C. % Agree God Personally Concerned Country Less 28-‐37 38-‐47 48-‐57 58-‐67 68+ 68+ -‐ LT 28 Than 28 Australia 22.8 25.8 28.7 28.6 30.7 35.8 + 13.0 Austria 23.1 26.1 24.4 30.6 23.8 36.3 + 13.2 Chile 59.5 71.0 76.5 72.4 79.6 81.4 + 21.9 Cyprus 48.8 48.2 51.9 60.7 70.0 83.0 + 34.2 Czech Rep. 10.4 11.0 11.2 14.0 17.4 36.6 + 26.2 Denmark 22.0 28.2 27.7 27.6 28.1 35.0 + 13.0 France 10.9 18.9 17.6 18.8 21.8 24.2 + 13.3 Germany (East) 6.0 6.8 9.4 11.1 7.3 7.3 + 1.3 Germany (West) 26.8 31.3 36.3 26.3 30.6 38.2 + 11.4 Great Britain 20.9 27.5 28.4 21.5 30.7 32.2 + 11.3 Hungary 27.8 28.6 23.5 26.8 30.1 51.7 + 23.9 Ireland 49.3 55.4 65.0 65.6 78.7 88.5 + 39.2 Israel 70.5 69.4 69.6 66.5 58.8 56.5 -‐ 14.0 Italy 50.7 38.0 56.3 42.4 62.1 72.4 + 21.7 Japan 25.5 26.1 21.7 25.3 22.5 23.8 -‐ 1.7 Latvia 26.5 35.2 29.9 37.0 48.4 63.4 + 36.9 The Netherlands 25.0 20.2 22.0 18.1 25.1 36.4 + 11.4 Northern Ireland 51.3 46.1 58.3 56.4 69.2 79.0 + 27.7 Norway 18.4 25.8 21.6 26.5 32.2 29.8 + 8.2 The Philippines 90.4 92.6 92.1 93.8 89.1 92.3 + 1.9 Poland 51.6 57.8 64.1 57.1 59.7 75.7 + 24.1 Portugal 46.7 45.5 58.2 52.6 73.0 77.8 + 31.1 Russia 39.1 37.7 45.7 35.2 42.7 48.1 + 9.0 Slovakia 45.5 47.4 44.4 48.8 58.0 71.9 + 26.4 Slovenia 21.8 27.7 23.5 27.9 29.4 32.9 + 11.1 Spain 29.4 31.8 29.8 36.5 47.0 61.2 + 31.8 Sweden 18.5 16.5 18.6 22.0 16.4 23.6 + 5.1 Switzerland 42.7 44.3 49.7 47.1 36.5 46.5 + 3.8 United States 65.6 64.6 66.4 75.2 74.3 72.5 + 6.9
References
Chaves, Mark, American Religion: Contemporary Trends. Princeton: Princeton University Press, 2011.
Gorski, Philip S. and Altinordu, Ates, “After Secularization?” Annual Review of Sociology, 34 (2008), 55-‐
85.
Greeley, Andrew M., Religion in Europe at the End of the Second Millennium: A Sociological Profile. New Brunswick, NJ: Transaction Publishers, 2003.
Kay, William K., “Belief in God in Great Britain, 1945-‐1996: Moving the Scenery Behind Classroom RE,” British Journal of Religious Education, 20 (1997), 28-‐41.
“Is God Coming Back to Life?” Time Magazine, 94 (December 26, 1969).
“Is God Dead?” Time Magazine, 87 (April 8, 1966).
Norris, Pippa and Inglehart, Ronald, Sacred and Secular: Religion and Politics Worldwide. 2ndedition.
Cambridge: Cambridge University Press, 2011.
Rebhun, Uzi, “Major Trends in the Development of Israeli Jews: A Synthesis of the Last Century,” in Jews in Israel: Contemporary Social and Cultural Patterns, edited by Uzi Rebhun and Chaim I.
Waxman. Lebanon, NH: University Press of New England, 2004.
Smith, Tom W., “Developing and Evaluating Cross-‐national Survey Instruments,” edited by Stanley Presser et al., Methods for Testing and Evaluating Survey Questionnaires. New York: John Wiley & Sons, 2004.
Smith, Tom W., “Religious Change Around the World,” GSS Cross-‐National Report No. 30. Chicago:
NORC, 2009.
Smith, Tom W., “Religious Change in the United States” Paper presented to the Nuffield College Trinity Term Sociology Seminar, Oxford University, May, 2012.
Stark, Rodney, “Secularization, RIP,” Sociology of Religion, 60 (1999), 182-‐193.
Stark, Rodney and Finke, Roger, Acts of Faith: Explaining the Human Side of Religion. Berkeley, CA: University of California Press, 2000.
Voas, David, “The Rise and Fall of Fuzzy Fidelity in Europe,” European Sociological Review, 25 (2009), 155-‐168.
Ziebertz, Hans-‐Georg, Imagining God: Empirical Explorations from an International Perspective. Berlin: LIT Verlag, 2002.
Appendix: Question Wordings
A. Please indicate which statement below comes closest to expressing what you believe about God.
I don’t believe in God.
I don’t know whether there is a God and I don’t believe there is any way to find out. I don’t believe in a personal God, but do believe in a Higher Power of some kind. I find myself believing in God some of the time, but not at others.
While I have doubts, I feel that I do believe in God.
I know that God really exists and I have no doubts about it. Can’t Choose
No Answer
B. Which best describe your beliefs about God?
I don’t believe in God now, and I never have. I don’t believe in God now, but I used to. I believe in God now, but I didn’t used to. I believe in God now and I always have. Can’t Choose
No Answer
C. Do you agree or disagree with the following…
There is a God who concerns himself with every human being personally.
Strongly Agree/Agree/Neither Agree nor Disagree/Disagree/Strongly Agree/Can’t Choose/No Answer