Pilgangoora
55Mt
in
Resources
plus
80
–
90Mt
Target
Recommendation
■
Tabba Tabba first product now November.
■
On 24 September, PLS announced an increase in
Resources, from 23.8Mt, in July, to 52.2Mt, PLUS an
increased Exploration Target from 50 – 60Mt to 80 - 90Mt.
■
The resource is the second largest hard rock spodumene
resource globally, with potential to be the largest.
■
PLS has had strong interest in off-take, so Beer & Co has
increased our estimated throughput, from 1.0Mt/yr to
3.0Mt/yr, by stages.
■
Beer & Co has increased our price estimate for
spodumene concentrate, reflecting the strong demand.
Strong
BUY;
High
Risk
Price
25.0c
Valuation
51c
Products
:
Tantalite
(tantalum)
and
Spodumene
(lithium)
Snapshot
Market Cap $175m
Shares on Issue 700.6m
Cash on hand (30 Sept 2015) $5.2m
Plus $7.3m in Con Notes ($4m), options ex’d
(795k) and placement ($2.5m) since
52 Week High 31.5c
52 Week Low 3.4c
1 month / 6 month VWAP 22.2c/12.6c
PLS Share price v. volume
$ 0 $ 400,000 $ 800,000 $ 1,200,000 $ 1,600,000 $ 2,000,000 $ 2,400,000 0 c 5 c 10 c 15 c 20 c 25 c 30 c
2‐Jan‐145‐Mar‐146‐May‐14 7‐Jul‐14 5‐Sep‐146‐Nov‐147‐Jan‐1510‐Mar‐15 11‐May‐15 10‐Jul‐1510‐Sep‐15
PLS value traded
Pilbara Minerals share price
Pilbara Minerals has 100% of the Tabba
Tabba tantalite project, which is expected
to be in production in September 2015..
In May 2014, PLS announced the
acquisition of 100% of Pilgangoora, 55km
from Tabba Tabba in the Pilbara region.
PLS is progressing a feasibility study for
Pilgangoora and is awaiting a permit to
begin production at Tabba Tabba
Author : Pieter Bruinstroop
Tabba Tabba first product delayed to November
The delays continue, but PLS is funded to cover this problem.
Increased Resource Estimate, PLUS increased Exploration Target
PLS announced an increase in its Resources Estimate, from 23.8Mt to 5.2Mt,
PLUS an increased Exploration Target, from 50 – 60Mt to 80 – 90Mt.
This makes PLS’s Pilgangoora the second largest hard rock spodumene deposit in
the world, after Greenbushes, which has 120Mt in Resources in December 2012.
PLS’s previous Resource estimate was in July The rate of increases shows that it
clearly has the potential to be the largest deposit in the world.
Strong Demand
Due to strong demand for Lithium, due to Electric Vehicles and emerging off‐grid
battery demand, coupled with supply uncertainties, PLS have signed MOUs for
than 200kt/yr of Li2O concentrate.
PLS reported, in presentations, of prices up to US$ 450/t for low Fe, 6% Li2O,
concentrate for chemical or battery grade, and higher prices for very low Fe
concentrate for industrial (glass or ceramic) applications.
Increased Throughput assumed
Our previous assumption was 1.0Mt/yr. Beer & Co believe that the production
rate will be raised. We have assumed to 3.0Mt/yr, which still leaves a very long
mine life of about 40 years.
Beer & Co valuation now 51c/share; Strong BUY
Higher prices plus higher throughput, even with a required equity raising, have
significantly raised our valuation, and our recommendation to Strong BUY.
This report was produced by Beer & Co Research, an independent research and advisory firm.
It is intended for wholesale investors ONLY.
If you do not wish to receive our research, please email to [email protected] with “unsubscribe”. If you wish to receive,
Tabba Tabba delayed further
Tabba Tabba plant about
to begin commissioning
On
site
construction
proceeding
PLS is permitted to construct and commission the plant.
However, before PLS is able to move product off‐site, it requires a final permit, which
follows a site inspection by the Department of Minerals and Energy to assure that the
development has been as permitted and is fully permitted.
It is now expected that the site inspection will be later in October, with the final permit in
November.
Strong demand for Spodumene concentrate
PLS is dominantly a prospective spodumene producer
An
almost
perfect
storm
favouring
PLS
There could not be a better time for a small company to have a significant spodumene
resources.
There
is
significant
and
growing
demand
The demand for lithium
is strong and projected
to grow at a high rate
As demand grows for Li‐
ion batters for a range of
applications
As shown in Figure 1,
there is growing battery
demand and Li‐ion
batteries are the
preferred technology,
due to energy density
and power per weight,
as well as moderating
costs.
This demand is coming
from phones, tablets,
portable consumer
electronics (eg. power
drills), as well emerging
Hybrid and Electric
Vehicle demand and off‐
grid energy storage.
Figure 1 : Growing Li‐ion battery demand
Source : Albemarle presentation, September 2015
Figure 2 shows projected Lithium demand. It shows that while batteries are the growth
Automotive use is projected to grow strongly
For Hybrid and Electric
Vehicles
And off‐grid power
storage
Figure 2 : Current and Potential Lithium Demand
Source : Albemarle presentation, September 2015
Figure 3 puts definitive quantities on the various market segments, in terms of Li2O units.
It shows that glass / ceramics, which requires a technical grade of spodumene
concentrate of low iron (maximum of 1.0% and the lower the better) is still the largest
single segment, at 46kt in 2014 of contained Li2O.
The largest consumer of
Li2O units is still glass /
ceramics
Figure 3 : market sizes
Source : Albemarle presentation, September 2015
Figure 3 also shows that while chemical or battery grade lithium can be sourced from a
variety of feedstocks, the suitable range of feedstocks for the largest use segment is
Supply is challenged Greenbushes, the world’s dominant supplier of spodumene,
will have its production
committed to its owners
from 2017
Supply
is
Challenged
(i) Greenbushes spodumene supply
The first way in which supply is challenged is the supply of spodumene from the
Greenbushes mine.
Greenbushes is owned 51% by the Chinese group, Chengdu Tianqi and 49% by the NYSE
listed chemicals company, Albemarle Corporation (ALB.N).
Tianqi presently uses its mined product in its chemicals operations.
ALB sells some of its share of spodumene production to a range of users in China.
However, ALB is building a battery plant and so from 2017 will no longer have
spodumene production for external sale.
(ii) Brines production is challenged
Orocobre Limited (ORE.ASX) is in the ramp‐up phase of its Salar de Olaroz brines project
in Argentina. In late 2013, ORE stated that it was fully funded to being commercial
production in 2014 Q2, to produce 17,500t/yr of Li2CO3 (equivalent to 7,000t/yr of Li2O).
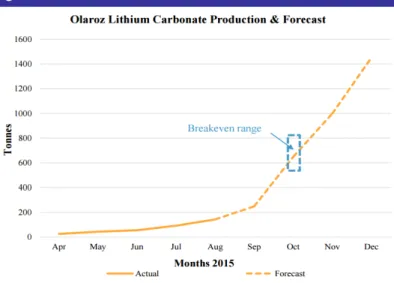
Figure 4 shows that production to date has been much less than might have been
expected. The ramp‐up of Orocobre’s Salar de
Olaroz brines project has
been slower than had
been expected
Figure 4 : Production from Salar do Olaroz
Source : ORE ASX announcement, 21 September 2015
While ORE projects to ramp up its production towards it nameplate capacity, the slow
rate to date has made consumers wary.
Glass
/
Ceramics
Figure 3 shows that the major use of lithium is in glass / ceramics manufacture. Its key
properties are :
Greatly increases the viscosity of glass and ceramic inputs such as silica and clays;
and
Virtually zero co‐efficient of expansion, so that it cycles through very hot and
Metallurgical testwork on PLS’s Pilgangoora
material produced a high
grade, low iron,
concentrate, which is in high demand
PLS has signed non‐
binding MOUs to supply
more concentrate than
would be produced from
processing 1.0Mt/yr of ore.
Prices have improved
with the strong interest
However, to achieve this, the spodumene needs to have very low iron levels.
In their ASX announcement of 25 May 2015, PLS reported the results of metallurgical
testwork on a 100kg representative bulk sample, as :
Recovery of over 90% of the Li2O to a concentrate grading 5.7% Li2O and 0.37%
Fe2O3 by flotation;
Enhancement of the concentrate to 0.11% Fe2O3 by magnetic separation to extract
iron; and
A final concentrate of 6.5% Li2O and 0.09% Fe2O3 by screening to eliminate the fines,
of under 100 (ie. 0.1mm) for a final “sand” product sized between 100 and 300.
For glass / ceramics manufacturers, the key is low iron, with maximum limits varying
from 0.09% to 0.17% across a range of manufacturers and applications. The preferred
Li2O level is 6.5%.
The product from Pilgangoora meets these strict specifications.
Strong
Demand
for
PLS’
product
Sources of lithium, such as spodumene, are an industrial mineral and prices are
negotiated between miner and processer; there is no readily market price.
However the CEO of PLS reported that, in his recent marketing trips, there was very
strong interest, as evidenced by the announcement of MOUs to supply.
In announcements of 29 July, 12 August and 2 September, PLS has announced non‐
binding MOUs for off‐take with :
2 Chinese lithium carbonate producers, for “over 70%” of the planned output of
Pilgangoora, on 29 July;
An Exclusive Distribution Agreement with Shantou Fancy Mining corporation to
supply glass and ceramics manufacturers in China, for 25% of the planned output of
Pilgangoora, on 12 August; and
A North American group to distribute Pilgangoora spodumene to glass
PLS has an agreement with Global Advanced Metals (GAM), the vendor of the
Pilgangoora tenements, to supply all the tantalite produced at Pilgangoora.
Prices
Respond
Recently, at company presentations, PLS has stated that
Concentrate for supply to battery producers has increased to US$ 450/t of 6% Li2O
product
this is US$ 7,500/t of contained Li2O, or US$3,000/t of LCE (as Li2O, is 40.5% of
the weight of Li2CO3);
given the AUD‐USD rate of 0.700, this gives AUD 643/t or $A 2.92/lb
Low iron spodumene concentrate for glass / ceramics is about US$ 650/t
given the AUD‐USD rate of 0.700, this gives AUD 923/t or $A 4.21/lb
Beer & Co had used a price of AUD 3.0/lb for PLS’s spodumene concentrate. Given that
PLS will sell into both products, its average revenue will be higher than Beer & Co had
Revised Mine Plan
Resources
PLS has a very large area
of known mineralisation
Outline
On 28 July 2014, PLS
announced that it had
completed the acquisition of
the Pilgangoora tantalum‐
lithium project from Global
Advanced Metals.
The mineralisation occurs in
pegmatites that either
outcrop or have a significant
surface expression.
Figure 5 shows the
tenements acquired by PLS
and the mapped pegmatites.
It also shows a Resource
estimate based on work done
by the vendor, which is also
shown in Figure 6.
Figure 5 shows a significant
further area of mineralisation
and suggests much more.
At the time of the acquisition,
Pilgangoora also had an
Figure 5 : Pilgangoora tenements
Source : PLS ASX announcement, 28 July 2014
Exploration target, as shown in Figure 7.
Figure 6 : PLS’s initial Resource estimate for Pilgangoora
grade contained grade contained Inferred Resource 10,400 kt 240 ppm 5,503k lb
8,600 kt 1.01 % 87 kt
Ta2O5 Li2O
Source : PLS ASX announcement, 17 June 2014
Figure 7 : PLS’s initial Exploration Target for Pilgangoora
Northern area 5 Mt ‐ 10 Mt 1.2 % ‐ 1.5 % 200 ppm ‐ 300 ppm
Central & Southern 10 Mt ‐ 15 Mt 1.2 % ‐ 1.5 % 200 ppm ‐ 300 ppm
TOTAL 15 Mt ‐ 25 Mt 1.2 % ‐ 1.5 % 200 ppm ‐ 300 ppm
Li2O grade Ta2O5 grade
Source : PLS ASX announcement, 17 June 2014
With many obvious targets, PLS engaged in an extensive but relatively low cost drilling
campaign and quickly increased the Resource estimate, with a revised Resource
announced in March 2015, as shown in Figure 8.
PLS has been able to
increase its Resources
and also its Exploration
Target
Figure 8 : PLS’s first updated Resource estimate for Pilgangoora
Resources
Category grade contained grade contained Indicated Ta2O5 5.99 Mt 235 ppm 3.1 Mlb Li2O 4.69 Mt 1.38 % 64,800 t Inferred Ta2O5 15.71 Mt 220 ppm 7.6 Mlb Li2O 11.93 Mt 1.07 % 127,500 t TOTAL Ta2O5 21.70 Mt 224 ppm 10.7 Mlb Li2O 16.62 Mt 1.16 % 192,300 t Ta2O5 Li2O
Source : PLS ASX announcement, 9 March 2015
Figure 9 : PLS’s first updated Exploration Target for Pilgangoora
Northern area 10 Mt ‐ 15 Mt 1.2 % ‐ 1.5 % 200 ppm ‐ 250 ppm Central & Southern 15 Mt ‐ 20 Mt 1.2 % ‐ 1.5 % 200 ppm ‐ 250 ppm TOTAL 25 Mt ‐ 35 Mt 1.2 % ‐ 1.5 % 200 ppm ‐ 300 ppm
Li2O grade Ta2O5 grade
Source : PLS ASX announcement, 9 March 2015
The extent of the mineralisation is shown by the increase in the size of Exploration Target
at the same time.
Only 3 months later, PLS announced a further increase in the size of the Resources
estimate, as shown in Figure 10, with a significant increase in the size of the Exploration
Target, as shown in Figure 11.
Figure 10 : PLS’s next updated Resource estimate for Pilgangoora
Resources
Category grade contained grade contained
Indicated Ta2O5 6.0 Mt 233 ppm 3.1 Mlb Li2O 4.7 Mt 1.36 % 64,300 t Inferred Ta2O5 17.8 Mt 208 ppm 8.2 Mlb Li2O 15.7 Mt 1.10 % 172,800 t TOTAL Ta2O5 23.8 Mt 214 ppm 11.3 Mlb Li2O 20.5 Mt 1.16 % 237,100 t Ta2O5 Li2O
Source : PLS ASX announcement, 2 June 2015
Figure 11 : PLS’s next updated Exploration Target for Pilgangoora
Northern area 20 Mt ‐ 25 Mt 1.2 % ‐ 1.5 % 200 ppm ‐ 250 ppm Central & Southern 30 Mt ‐ 35 Mt 1.2 % ‐ 1.5 % 150 ppm ‐ 200 ppm TOTAL 50 Mt ‐ 60 Mt 1.2 % ‐ 1.5 % 175 ppm ‐ 225 ppm
Li2O grade Ta2O5 grade
Source : PLS ASX announcement, 2 June 20154
Comparing these results shows that PLS’s drilling had been directed at demonstrating the
Just over 3 months later, PLS announced a significant increase in the resources estimate,
as shown in Figure 12, with a further increase in the size of the Exploration Target, as
shown in Figure 13.
Figure 12 : PLS’s current Resource estimate for Pilgangoora
Category grade contained grade contained
Indicated Ta2O5 10.9 Mt 229 ppm 5.5 Mlb Li2O 7.8 Mt 1.29 % 100,000 t Inferred Ta2O5 22.1 Mt 210 ppm 10.2 Mlb Li2O 44.4 Mt 1.28 % 568,000 t TOTAL Ta2O5 32.9 Mt 217 ppm 15.7 Mlb Li2O 52.2 Mt 1.28 % 668,000 t Ta2O5 Li2O
Source : PLS ASX announcement, 24 September 2015
Figure 13 : PLS’s current Exploration Target for Pilgangoora
Northern area 30 Mt ‐ 35 Mt 1.2 % ‐ 1.5 % 200 ppm ‐ 250 ppm
Central & Southern 45 Mt ‐ 55 Mt 1.2 % ‐ 1.5 % 150 ppm ‐ 200 ppm
TOTAL 75 Mt ‐ 90 Mt 1.2 % ‐ 1.5 % 175 ppm ‐ 225 ppm
Li2O grade Ta2O5 grade
Source : PLS ASX announcement, 24 September 2015
While tonnes have
increase, Ta2O5 grades
have softened while Li2O
grades have improved
This shows the different
emphasis over time
GAM, when it was the
owner, was focussed on
Ta2O5 PLS has a greater interest in Ti2O
Analysis
The continuing increase in the size of the Resource estimate, together with the
Exploration Target validates Beer & Co’s view that some value should be given to the
Exploration Target.
While the size of the Resource Estimate has increased :
The Li2O grades have risen, with the volume of resources; while
The Ta2O5 grades have fallen.
This reflects the fact that the early stage work was focused on tantalite and spodumene
was largely ignored.
Also, the Li2O and Ta2O5 grades are not necessarily associated, so differing volumes for
each commodity is due to areas where the other product might not have been assayed
for :
In the Indicated Resources, some holes were assayed only for Ta2O5 as that was what
GAM were seeking;
The Inferred resource Estimate shows that PLS has not reported the assay results for
Ta2O5 as the grades are low.
Mining
Inventory
The mineralisation at Pilgangoora is in large pods, so the grades within a pod tend to be
similar with only a minimal halo, but can differ significantly both in grade and
composition between pods.
The impact of this is that a lower tonnage, higher grade mine plan is very feasible as it
reflect a differing collection of pods rather than highly selective mining.
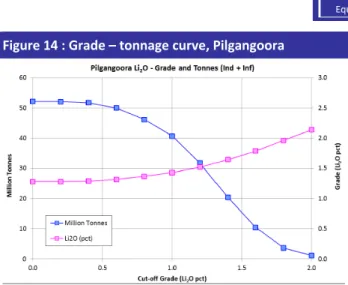
Figure 14 shows the grade – tonnage trade‐off for the Pilgangoora Resource estimate.
Figure 14 : Grade – tonnage curve, Pilgangoora
Source : PLS ASX announcement, 24 September 2015
In their 24 September announcement, PLS included a higher grade Resource estimate,
based on a 1.0% Li2O cut‐off grade, of 40.7Mt grading 1.43% Li2O.
This is consistent with a visual examination of Figure 14.
Figure 15 shows the mining inventory assumed by Beer & Co in this analysis.
Figure 15 : Beer & Co’s assumed Mining Inventory
grade contained grade contained
RESOURCES High grade 10.0 Mt 200 ppm 4.4 Mlb 1.43 % 143 kt
Medium grade 30.7 Mt 220 ppm 14.9 Mlb 1.43 % 439 kt
NORTHERN 30.0 Mt 217 ppm 14.3 Mlb 1.19 % 356 kt
SOUTHERN 37.2 Mt 167 ppm 13.7 Mlb 1.19 % 442 kt
TOTAL 107.9 Mt 199 ppm 47.3 Mlb 1.28 % 1,381 kt
Ta2O5 Li2O
Source : Beer & Co estimates
We expect PLS to
manage its grades over
time, rathe than
maximise them
Given the volume of
material, we expect PLS
to have a higher rate of
throughput
Figure 15 shows that Beer & Co has assumed that mining begins focussed on high Li2O
grade areas, with the overall grades equivalent to that of the Resources estimate, and
total material being the total resources plus some of the exploration target.
The focus on Li2O is to mitigate the potential to flood the Ta2O5 market.
PLS’s success in extending its Resources Estimate and its Exploration Target significantly,
with 3x the Ta2O5 Resource tonnes and 5x the Li2O Resource tonnes, with the Exploration
Target increasing by a factor of roughly 4x, all over a period of about 15 months,
encourages Beer & Co to assume a significant mining inventory.
Throughput
In our original analysis, we assumed a throughput of 1.0Mt/yr.
We are now raising this assumption.
We expect the current DFS to be based on an initial throughput of 1.0Mt/yr, but to be
Financial Analysis of PLS
Beer & Co is increasing
its estimated upfront
capital cost
Beer & Co expects to
start at 1.0Mt/yr and
increase to 3.0Mt/yr
over a period of 4 years
As discussed above, Beer & Co has revised our thinking on Pilgangoora. Tabba Tabba is
in final construction and we have no changes to our estimates for it.
Pilgangoora
Capital
Cost
Estimate
Initial
The earlier section, on Glass / Ceramics discussed the processing route :
Dense Media Separation to produce a coarse spodumene concentrate;
Gravity separation, by spirals, of the tantalite;
Float the fines to produce separate tantalite and spodumene concentrates.
Figure 5 shows that Altura Mining (AJM.ASX) has some of the Pilgangoora mineralisation,
with an estimated resource of 25Mt.
On 19 November 2012, AJM announced the results of a scoping study on its Pilgangoora
project. The capital cost estimate was $A 96.3m to process 830kt/yr of ore.
In public presentations, PLS advised that the expected capital cost is in the order of
$100m. As AJM estimated capital costs of $A 96m to process 830kt/yr, and costs have
since come down, Beer & Co use the estimate of $A 100m for capital costs.
As another comparison, the capital cost for Tabba Tabba to process 120kt/yr is $8m.
Pilgangoora is 8.5x the size, and has extra processing, including DMS, to produce 2
different products; $8m by 8.5 gives $68m, and adding in DMS and extra circuits suggests
a capital cost of about $90m ‐ $100m.
Expansions
Beer & Co assume :
The initial 1.0Mt/yr operation takes about 12 months to construct and fully
commission;
The plant is then run at this capacity for about 12 months before a decision is made
to expand the operations by a further 1.0Mt/yr
Beer & Co assumes that the capital cost for this extra 1.0Mt/yr capacity is a
further $A 70m;
The second tranche takes a further 12 months to construct and commission , and
then a decision is made to add a further 1.0Mt/yr in capacity, to raise total
throughput to 3.0Mt/yr
Beer & Co assumes that the capital cost for this third 1.0Mt/yr capacity is a
further $A 60m.
Beer & Co estimates
operating costs of AUD
48/t of ore processed
Pilgangoora
Operating
Cost
Estimates
When AJM announced the results of a scoping study on its Pilgangoora project, on
19 November 2012, it advised operating costs of $A 15.72/t of ore for $A 90/t of
spodumene concentrate, processing ore grading 1.23% Li2O.
Beer & Co’s estimated cash operating costs for PLS’s Pilgangoora operations is $A 48/t of
ore processed, as shown in Figure 16.
Figure 16 : Beer & Co’s projected operating costs for Pilgangoora
2017‐18 2018‐19 2019‐20 2020‐21 2021‐22 2022‐23 2023‐24 2024‐25 2025‐26 2026‐27 2027‐28 Ore mined 875 kt 1,000 kt 1,000 kt 1,428 kt 2,000 kt 2,738 kt 3,000 kt 3,000 kt 3,000 kt 3,000 kt 3,000 kt waste : ore 5 : 1 5 : 1 5 : 1 6 : 1 5 : 1 5 : 1 5 : 1 5 : 1 5 : 1 5 : 1 5 : 1 Cash Costs Waste $ 15m $ 17m $ 17m $ 26m $ 30m $ 38m $ 42m $ 43m $ 43m $ 43m $ 43m AUD /t ore $ 17/t $ 17/t $ 17/t $ 18/t $ 15/t $ 14/t $ 14/t $ 14/t $ 14/t $ 14/t $ 14/t AUD /t material $ 3.4/t $ 3.4/t $ 3.4/t $ 3.0/t $ 3.0/t $ 2.8/t $ 2.8/t $ 2.8/t $ 2.8/t $ 2.8/t $ 2.8/t Ore Mining $ 4m $ 5m $ 5m $ 6m $ 9m $ 10m $ 11m $ 11m $ 12m $ 12m $ 12m AUD /t ore $ 4.9/t $ 4.7/t $ 4.7/t $ 4.2/t $ 4.3/t $ 3.8/t $ 3.7/t $ 3.8/t $ 3.9/t $ 4.0/t $ 4.1/t Processing $ 16m $ 18m $ 18m $ 29m $ 32m $ 41m $ 44m $ 44m $ 44m $ 44m $ 44m AUD /t $ 18/t $ 18/t $ 18/t $ 17/t $ 16/t $ 15/t $ 15/t $ 15/t $ 15/t $ 15/t $ 15/t
Admin & Overhead $ 2m $ 2m $ 2m $ 5m $ 5m $ 6m $ 6m $ 6m $ 6m $ 6m $ 6m
AUD /t $ 2.8/t $ 2.5/t $ 2.5/t $ 2.8/t $ 2.5/t $ 2.4/t $ 2.2/t $ 2.2/t $ 2.2/t $ 2.2/t $ 2.2/t
Concceontrate Transport $ 10m $ 13m $ 13m $ 22m $ 25m $ 34m $ 38m $ 38m $ 38m $ 38m $ 38m
Transport and Loading $ 30/t $ 30/t $ 30/t $ 30/t $ 30/t $ 30/t $ 30/t $ 30/t $ 30/t $ 30/t $ 30/t
Shipping US$ 25/t US$ 25/t US$ 25/t US$ 25/t US$ 25/t US$ 25/t US$ 25/t US$ 25/t US$ 25/t US$ 25/t US$ 25/t
Total Cash Costs $ 47m $ 54m $ 54m $ 88m $ 101m $ 130m $ 141m $ 142m $ 143m $ 143m $ 143m
AUD /t ore $ 54/t $ 54/t $ 54/t $ 51/t $ 50/t $ 48/t $ 47/t $ 47/t $ 48/t $ 48/t $ 48/t
Source : Beer & Co estimates
Projected
Revenue
for
PLS
Production
Figure 17 shows the outcome for Ta2O5 production from Beer & Co’s modelling.
Beer & Co projects that
PLS’s revenue will be
dominated by Pilgangoora
Figure 17 : Beer & Co’s projections for PLS’s production of Ta2O5, in ‘000 pounds
0 200 400 600 800 1,000 1,200 1,400 1,600 2015‐16 2017‐18 2019‐20 2021‐22 2023‐24 2025‐26 2027‐28 2029‐30 2031‐32 2033‐34 Tabba Tabba Pilgangoora
Figure 18 shows Beer & Co’s estimated production of Li2O in spodumene concentrate. While much of PLS’s
production can be sold
for glass / ceramics,
Beer & Co projects
that PLS will sell most
its spodumene
concentrate into the
chemical, or battery,.
Segment.
Figure 18 : Beer & Co’s projections for PLS’s production of Li2O, in tonnes
0 5,000 10,000 15,000 20,000 25,000 30,000 35,000 40,000 2016‐17 2018‐19 2020‐21 2022‐23 2024‐25 2026‐27 2028‐29 2030‐31 2032‐33 2034‐35 Chemical Industrial
Source : Beer & Co estimates
Figure 18 shows that Beer & Co has projected that PLS’s production climbs rapidly to
35kt/yr of contained Li2O.
Figure 3 shows a total market in 2014 of about 125kt, growing at GDP for 75kt and at a
Compound Annual Growth rate of 16% for the sector related to batteries.
Figure 19 compares Beer & Co’s production from PLS with the market growth projected
by Albemarle. It shows that we project that PLS’s projected market share is a maximum
of about 10%.
Beer & Co estimates
that PLS will never have
a market share of more
than 10%
Figure 19 : Projected Li2O market
0 50 100 150 200 250 300 350 400 450 500 2014‐15 2016‐17 2018‐19 2020‐21 2022‐23 2024‐25 2026‐27 2028‐29
PLS Other Uses Battery
Source : Albemarle presentation, September 2015, Beer & Co
Product
Revenue
Discussion earlier was that the revenue for
Concentrate for battery production is about US$ 450/t of 6% Li2O product;
In this analysis, Beer & Co has constrained the share of PLS’s production to the glass /
ceramics market to a maximum of 30% of PLS’s production.
Also, while the current price is US$ 450/t, Beer & Co has used US$ 400/t as our base
case, with US$ 600/t to the glass / ceramics market.
Beer & Co projects that
chemical grade
spodumene will be the
largest revenue source
for PLS
PLS has stated in presentations
that the price it will receive
from GAM for tantalite is fixed
in AUD terms, with escalation
by CPI.
Figure 20 shows tantalite
prices.
Beer & Co has assumed a price
of AUD 82.5/lb for PLS’s
tantalite supply.
Figure 21 shows the total
revenue projected by Beer & Co
for PLS, by product, based on
the production volumes and
product revenues outlined, in
AUD millions.
Figure 20 : Tantalite Prices
Source : PLS presentation, September 2014
Figure 21 : Beer & Co’s projected revenue for PLS
0 100 200 300 400 500 2015‐16 2017‐18 2019‐20 2021‐22 2023‐24 2025‐26 2027‐28 2029‐30 2031‐32 2033‐34 Tabba Tabba Tantalite
Pilgangoora Tantalite
Spodumene for batteries
Spodumene for galss / ceramics
Source : Beer & Co estimates
Beer & Co projects that
PLS will need to raise
over $30m in equity to
construct the
Pilgangoora project
Projected
Cashflows
for
PLS
Figure 22 shows Beer & Co’s projected financial outcomes for PLS, incorporating al the
preceding discussion.
Figure 22 shows project capital expenditure on a project basis, rather than a financed
cashflows basis. In our analysis, Beer & Co assumes that PLS needs to raise over $30m in
equity to finance stage 1 of Pilgangoora, as shown by the increase in the number of
shares on issue, with about $65m of debt funding and the balance being cash on hand
from Tabba Tabba operations.
Figure 22 : Beer & Co’s projected financial outcomes for PLS AUD m 2015‐16 2016‐17 2017‐18 2018‐19 2019‐20 2020‐21 2021‐22 2022‐23 2023‐24 2024‐25 Ore Mined 83 kt 120 kt 1,115 kt 1,240 kt 1,240 kt 1,668 kt 2,270 kt 2,738 kt 3,360 kt 3,360 kt Ta2O5 sold 179k lb 224k lb 561k lb 622k lb 622k lb 889k lb 985k lb 1,283k lb 1,432k lb 1,246k lb Li2O sold 0t 243t 9,141t 11,440t 11,440t 19,877t 22,880t 31,317t 34,320t 34,320t Total Revenue 14.9 21.7 147.4 177.6 177.6 291.7 332.8 449.7 495.0 479.7
Cost of Goods Sold (6.0) (8.3) (59.2) (69.4) (69.6) (103.3) (117.7) (151.9) (162.9) (146.3)
Royalties 0.0 (0.2) (8.7) (10.9) (10.9) (18.9) (21.8) (29.8) (32.9) (33.1)
Corporate Costs (1.3) (1.3) (1.5) (1.5) (1.5) (1.5) (1.5) (1.5) (1.5) (1.5)
Dep'cn & Amort'sn (6.4) (4.5) (11.3) (14.2) (14.2) (16.3) (20.2) (22.0) (21.7) (20.8)
E B I T 1.3 7.4 66.8 81.6 81.4 151.7 171.6 244.6 276.0 278.0 Interest Expense 0.0 (0.8) (5.9) (4.5) (2.9) (1.5) (0.1) (0.0) (0.0) (0.0) Tax Expense (0.4) (2.0) (18.2) (23.1) (23.6) (45.1) (51.4) (73.4) (82.8) (83.4) NPAT 0.8 4.6 42.6 53.9 55.0 105.1 120.0 171.2 193.2 194.6 Feasibiilty / permitting (3) 0 0 0 0 0 0 0 0 0 Project Cap.Ex (1) (100) 0 0 (49) (21) (60) 0 0 0 Sus Cap. Ex (0) (1) (3) (3) (3) (5) (6) (7) (6) (6)
Ordinary shares ‐ yea 701.5m 989.1m 989.1m 989.1m 989.1m 989.1m 989.1m 989.1m 989.1m 989.1m
Earnings per Share 0.1 c 0.5 c 4.3 c 5.5 c 5.6 c 10.6 c 12.1 c 17.3 c 19.5 c 19.7 c
Source : Beer & Co estimates
Beer
&
Co’s
base
case
valuation
of
PLS
Figure 23 shows Beer & Co’s risked, base case valuation of PLS, based on the cashflows
described.
PLS advised, in presentations, that it is currently working on a Definitive Feasibility Study
for Pilgangoora, having done an “in‐house” scoping study, the results of which have not
been made public. Accordingly, Beer & Co’s projected cashflows have been heavily risk‐
weighted due to the degree of estimation in our cashflow projections.
Beer & Co’s risked base
case valuation of PLS is
51c/share
Figure 23 : Beer & Co’s base case valuation of PLS
6‐Oct‐15 risk : 100% Value per share
Tabba Tabba Resources 85 % $ 12m $ 11m 1.1 c 1.0 c Tabba Tabba Extensions 60 % $ 7m $ 4m 0.4 c 0.5 c Strelly 35 % $ 7m $ 2m 0.2 c 0.3 c franking credits 30 % $ 4m $ 1m 0.1 c 0.2 c Pilgangoora Indicated 55 % $ 207m $ 114m 11.3 c 12.5 c Pilgangoora Inferred 40 % $ 465m $ 186m 18.5 c 20.9 c Pilgangoora Extension 25 % $ 141m $ 35m 3.5 c 4.3 c franking credits 16 % $ 346m $ 72m 7.2 c 9.0 c Corporate 100 % ($8m) ($8m) (0.8c) (0.7c) Cash / debt 100 % $ 4m $ 4m 0.4 c 0.4 c cash raised 100 % $ 31m $ 31m 3.1 c 3.1 c TOTAL $ 1,216m $ 453m 45.0 c 51.2 c
Shares on issue 700.6m FPO shares 134.5m options 145.9m to be issued 134.5m op. ex'd
25.2m CN conversion
discount rate = 12.0 % 30‐Jun‐15
Source : Beer & Co estimates
Figure 23 shows that Beer & Co’s base case valuation has nearly doubled, from 28c to
Our valuation is higher
due to Higher product prices; and Increased volumes
We also have a much
higher capital cost
Sensitivity
Analyses
The major changes in our modelling have been :
Higher prices for PLS’s low iron spodumene concentrate reflecting the strong market
conditions, as outlined earlier;
Increased volume of Pilgangoora spodumene, reflecting the strong demand for the
product coupled with the very large volume of mineralisation that PLS has shown
can be easily turned into Resources;
An increase in the overall Li2O grade; and
A significantly greater capital expenditure for the first 1.0Mt/yr of production at
Pilgangoora, coupled with the need for an equity raising.
Figure 24 shows the impact of the
higher Li2O prices; we had
previously used $A 3.0/lb for Li2O,
while the data in Figure 24 is the
weighted average of the higher
value, lower volume glass /
Figure 24 : Revenue Impact
US$ 450/t US$ 400/t US$ 325/t US$ 250/t $A 5.4 /lb $A 4.9 /lb $A 4.1 /lb $A 3.3 /lb Source : Beer & Co estimates
ceramics sale and battery material, as shown around Figure 21.
Our valuation would be
LOWER if we assumed
1.0Mt/yr throughput
and the same prices as
previously
Figure 25 shows the impact of the
increase in volume by the impact of
the higher prices.
It shows that our previous parameters,
of 1.0Mt/yr of throughput and $A 3/lb
of 6% Li2O concentrate result is value
below the current share price, and
well down on our previous valuation.
Figure 25 : Volume v. Price
1.0 Mt/yr 2.0 Mt/yr 3.0 Mt/yr
US$ 450/t 31.8 c 48.4 c 58.6 c
US$ 400/t 27.9 c 42.4 c 51.2 c
US$ 325/t 22.1 c 33.4 c 40.2 c
US$ 250/t 16.3 c 24.4 c 29.2 c
Source : Beer & Co estimates
This demonstrates the impact of the higher capital costs and the equity raising.
Figure 25 also shows that the current prices for Li2O is reflected in the 1.0Mt/yr case,
which is close to the current share price.
This shows the real value added by the increase in throughput.
Figure 26 shows that, for
Pilgangoora, the grade is less
important than volume. Of the
three measures used, our base
case is the high grade case shown
in Figure 15, while the “average
grade” case uses the same deposit
Figure 26 : Volume v. grade
1.0 Mt/yr 2.0 Mt/yr 3.0 Mt/yr
High grade 27.9 c 42.4 c 51.2 c
Resource grade 25.2 c 37.0 c 44.4 c Average grade 25.8 c 38.3 c 46.2 c Source : Beer & Co estimates
average grade for the entire project life and our “Resource” grade case prioritises those
Conclusions
Beer & Co’s valuation is
heavily risk weighted
due to the assumptions
we have made.
Our valuation is now
about 2x the share price
Beer & Co confirms our
Strong BUY, High Risk,
recommendation
Beer & Co’s risked, base case valuation of PLS is now 51c/share, while the current share
price has climbed to 25c/share.
The major drivers of our increased valuation are :
Increased throughput due to the significant and continuing increases in the volume
of economic mineralisation at Pilgangoora; and
Higher prices.
Due to the degree of estimation made by Beer & Co, our base case valuation is heavily
risk weighted.
If PLS is able to deliver as we project, then our valuation wold be over $1.00/share.
However, there is significant uncertainty over the rate of increase in throughput as it will
depend on 2 different products, with the scenario that one (Li2O) will be in strong
demand the other (Ta2O5) will be surplus if PLS prioritises those areas with good tantalite
grades.
As our risked, base case valuation is about 2x the share price, Beer & Co restores our
Strong BUY, High Risk recommendation.
Beer& Co Research Pilbara Minerals (PLS.ASX)
Year ended June 2014‐15 2015‐16 2016‐17 2017‐18 2018‐19 2019‐20 2020‐21
Section 1 - P&L Commodity price assumptions
Sales revenue $A m 0 15 21 146 177 177 291 Year ended June 2014‐15 2015‐16 2016‐17 2017‐18 2018‐19 2019‐20
Interest revenue $A m 0 0 0 1 1 1 1 AUD/USD 0.836 0.706 0.700 0.700 0.700 0.700
Other revenue $A m 0 0 0 0 0 0 0 Tantalite $A / lb 83 83 83 83 83 83
Total Revenue $A m 0 15 22 147 178 178 292 Spodumene, Chemical grade USD /t 400 400 400 400 400
Spodumene, Industrial grade USD /t 600 600 600 600 600
Cost of Goods Sold $A m 0 (6) (8) (59) (69) (70) (103)
Royalties $A m 0 0 (0) (9) (11) (11) (19) Mine Production / Sales, contained product
Exploration Expense $A m 0 0 0 0 0 0 0 Tabba Tabba Ta2O5 ' 000 lb 0 179 217 272 260 260 Corporate Costs $A m (1) (1) (1) (2) (2) (2) (2) Pilgangoora Ta2O5 ' 000 lb 0 0 8 289 362 362 Other Operating Expenses $A m 0 0 0 0 0 0 0 Spodumene, chemical grade, tonnes 0 170 6,399 8,008 8,008
Total Operating Expenses $A m (1) (7) (10) (69) (82) (82) (124) Spodumene, industrial grade, tonnes 0 73 2,742 3,432 3,432
EBITDA $A m (1) 8 12 78 96 96 168 Resources, Reserves and assumed mining inventory
Dep'cn & Amort'sn $A m 0 (6) (4) (11) (14) (14) (16) Tabba Tabba Ore Reserves
EBIT $A m (1) 1 7 67 82 81 152 Ta2O5 grade contained Ta2O5
Interest Expense $A m 0 0 (1) (6) (5) (3) (2) Proved 32 kt 1,420 ppm 100k lb Other $A m 0 0 0 0 0 0 0 Probable 101 kt 1,249 ppm 278k lb
Pre‐Tax Profit $A m (1) 1 7 61 77 79 150 Total Reserves 133 kt 1,290 ppm 378k lb
Tax Expense $A m 0 (0) (2) (18) (23) (24) (45) Pit Design 162 kt 1,240 ppm 443k lb
NPAT $A m (1) 1 5 43 54 55 105
Reported NPAT $A m (1) 1 5 43 54 55 105 Tabba Rabba Mineral Resources
Ta2O5 grade contained Ta2O5
Section 2 - Key Data Measured 30 kt 1,610 ppm 107k lb
Ordinary shares ‐ year end m 619 701 989 989 989 989 989 Indicated 124 kt 1,260 ppm 346k lb Fully diluted shares on issue m 619 701 989 989 989 989 989 Inferred 58 kt 925 ppm 119k lb Weighted # shares m 612 701 922 989 989 989 989 TOTAL 213 kt 1,220 ppm 572k lb Earnings per Share (0.1c) 0.1 c 0.5 c 4.3 c 5.5 c 5.6 c 10.6 c
Dividends Per Share 0.0 c 0.0 c 0.0 c 1.0 c 2.6 c 2.8 c 2.3 c Beer & Co estimated mining inventory, Tabba Tabba
Ta2O5 grade contained Ta2O5
Section 3 - Balance Sheet Reserves 133 kt 1,290 ppm 378k lb
Cash $A m 3 4 16 61 69 17 68 Pit Design 29 kt 1,012 ppm 65k lb
Receivables $A m 0 3 3 21 22 22 41 Other M&I Resources 60 kt 626 ppm 83k lb
Other $A m 0 0 0 0 0 0 0 Inferred 96 kt 662 ppm 140k lb
CURRENT ASSETS $A m 3 7 18 82 91 39 109 Along strike 500 kt 600 ppm 661k lb
Strelly, high grade 500 kt 600 ppm 661k lb
Receivables $A m 0 0 0 0 0 0 0 Strelly, balance 900 kt 450 ppm 892k lb P , P & E $A m 4 2 100 97 92 136 154 TOTAL 2,217 kt 589 ppm 2,881k lb Mining Properties / Exploration $A m 6 6 4 4 4 3 3
Other $A m 0 0 0 0 0 0 0 Pilgangoora Mineral Resources
NON‐CURRENT ASSETS $A m 10 8 104 101 95 139 157
TOTAL ASSETS $A m 13 15 123 183 186 179 266 Category grade contained grade contained
Indicated Ta2O5 10.9 Mt 229 ppm 5.5 Mlb
Payables $A m 0 1 1 8 8 8 14 Li2O 7.8 Mt 1.29 % 100,000 t
Debt $A m 2 0 11 18 20 15 2 Inferred Ta2O5 22.1 Mt 210 ppm 10.2 Mlb
Other $A m 0 0 0 0 0 0 0 Li2O 44.4 Mt 1.28 % 568,000 t
CURRENT LIABILITIES $A m 2 1 12 26 28 24 16
Beer & Co estimated mining inventory, Pilgangoora
Long Term Debt $A m 0 0 55 37 17 2 0 grade grade
Deferred Tax Liability $A m 0 0 0 0 0 0 0 Indicated 10.0 Mt 200 ppm 1.43 %
Other $A m 0 0 0 0 0 0 0 Inferred 30.7 Mt 220 ppm 1.43 %
Provisions $A m 0 0 0 0 0 0 0 Northern Mineralisation 30.0 Mt 217 ppm 1.19 %
NON‐CURRENT LIABILITIES $A m 0 0 55 37 17 2 0 Southern Mineralisation 37.2 Mt 167 ppm 1.19 %
TOTAL LIABILTIES $A m 2 1 67 63 45 26 16 TOTAL 70.70 Mt 199 ppm 1.28 %
NET ASSETS $A m 11 14 56 120 141 153 250
Asset based Valuation
Accumulated Profit (Loss) $A m (13) (12) (7) 36 68 96 187
Reserves $A m 3 2 4 23 11 (4) 1 6‐Oct‐15
Contributed Equity $A m 20 23 59 61 61 61 61 risk : 100% Value per share
$A m 11 14 56 120 141 153 250 Tabba Tabba Resources 85 % $ 12m $ 11m 1.1 c 1.0 c
Minority Interest $A m 0 0 0 0 0 0 0 Tabba Tabba Extensions 60 % $ 7m $ 4m 0.4 c 0.5 c
Total Equity $A m 11 14 56 120 141 153 250 Strelly 35 % $ 7m $ 2m 0.2 c 0.3 c
franking credits 30 % $ 4m $ 1m 0.1 c 0.2 c
Section 4 - Cashflow Pilgangoora Indicated 55 % $ 207m $ 114m 11.3 c 12.5 c Net Cashflow from operations $A m (4) 3 (25) 50 50 (2) 95 Pilgangoora Inferred 40 % $ 465m $ 186m 18.5 c 20.9 c Net Interest Paid $A m 0 0 (0) (5) (4) (2) (1) Pilgangoora Extension 25 % $ 141m $ 35m 3.5 c 4.3 c Taxes Paid $A m 0 0 0 (8) (22) (23) (31) franking credits 16 % $ 346m $ 72m 7.2 c 9.0 c Change in Working Capital $A m (2) (4) (11) (71) (9) 51 (75) Corporate 100 % ($8m) ($8m) (0.8c) (0.7c)
OPERATING CASHFLOW $A m (6) (1) (36) (34) 16 24 (12) Cash / debt 100 % $ 4m $ 4m 0.4 c 0.4 c
cash raised 100 % $ 31m $ 31m 3.1 c 3.1 c
Exploration Expenditures $A m 2 3 0 0 0 0 0 TOTAL $ 1,216m $ 453m 45.0 c 51.2 c Maintenace Capex $A m 0 0 1 3 3 3 5 Shares on issue 700.6m FPO shares 134.5m options Expansion Capex $A m 2 1 100 0 0 49 21 145.9m to be issued 134.5m op. ex'd
PPE Acquisitions (Total Capex)$A m 3 4 101 3 3 52 26 25.2m CN conversion
PPE Divestments $A m 0 (3) 0 0 0 0 0 Financial Ratios
INVESTING CASHFLOW $A m 3 1 101 3 3 52 26 Year ended June 2014‐15 2015‐16 2016‐17 2017‐18 2018‐19 2019‐20
Revenue $A m 0 15 22 147 178 178
Change in Equity $A m 4 1 36 3 0 0 0 EBITDA $A m (1) (1) 8 12 78 96
Dividends Paid $A m 0 0 0 0 (21) (27) (14) EBIT $A m (1) (1) 1 7 67 82 Change in Debt $A m 0 (2) 66 (11) (18) (20) (15) NPAT (reported) $A m (1) (1) 1 5 43 54
FINANCING CASHFLOW $A m 4 (1) 102 (8) (39) (47) (29) Adjusted EPS (cps) (0.3c) (0.1c) 0.1 c 0.5 c 4.3 c 5.5 c
EPS Growth (%) 60 % 189 % 313 % 768 % 27 %
Free Cashflow $A m (3) (0) 65 (32) (3) 50 (0) DPS (c) 0.0 c 0.0 c 0.0 c 1.0 c 2.6 c 2.8 c
Net Cashflow $A m 1 (1) 166 (40) (21) 30 (16) Dividend Yield (%) 0 % 0 % 0 % 4 % 10 % 11 %
PE adj. (x) x (6) (185) 208 50 6 5
Shareholdings EV / EBITDA (x) x (7) (185) 22 25 3 2
Neil Biddle 34.438m 4.9 % EV / EBIT (x) x (7) (185) 136 40 4 3
Vaughan Blank 33.333m 4.8 % Gearing (%) 12 % 0 % 54 % 30 % 20 % 10 %
Return on Assets (6%) 9 % 6 % 36 % 44 % 46 %
Return on Equity (7%) 6 % 8 % 35 % 38 % 36 %
EBITDA Margin (%) n/a n/a 52 % 56 % 53 % 54 %
October 2015
discount rate = 12.0 % 30 June 2015
Ta2O5 Li2O
Important Information
Confidential
This document is for the confidential use of the recipients only and is not to be reproduced without the authority
of Beer & Co Pty Ltd. It has been prepared at the request of Pilbara Minerals Limited and Beer & Co Pty Ltd will
receive a fee for its preparation.
Disclaimer
The persons involved in or responsible for the preparation and publication of this report believe that the
information herein has been obtained from reliable sources and that any estimates, opinions, conclusions or
recommendations are reasonably held at the time of compilation. No warranty is made as to the accuracy of the
information in this document and, to the maximum extent permitted by law, Beer & Co Pty Ltd and its related
entities, their respective directors and officers disclaim all liability for any loss or damage which may be suffered by
any recipient through relying on anything contained or omitted from this document.
General Advice
The content is of a general nature and is based on a consideration of the securities alone, and as such is conditional
and must not be relied upon without advice from a securities adviser as to the appropriateness to you given your
individual investment objectives, financial situation and particular needs. Whilst this document is based on
information and assessments that are current at the date of publication, Beer & Co Pty Ltd has not undertaken
detailed due diligence on the information provided and has no obligation to provide revised assessments in the
event of changed circumstances.
Disclosure
Beer & Co Pty Ltd has been engaged by Pilbara Minerals Limited to prepare this research report and is being paid a
fee for its preparation. In the future, Beer & Co Pty Ltd may provide capital raising services to Pilbara Minerals
Limited on commercial terms. Directors of Beer & Co or other associate companies may own securities in Pilbara
Minerals Limited. Beer & Co Pty Ltd seeks to do work with those companies it researches. As a result, investors
should be aware that Beer & Co Pty Ltd may have a conflict of interest that could affect the objectivity of this
report.
Analyst Certification
The analyst responsible for this research report certifies that all of the views expressed reflect his personal views
about the securities and the issuer.
Report prepared by : Pieter Bruinstroop [email protected]
BEER & CO PTY LTD ABN 88 158 837 186,
AUTHORISED REPRESENTATIVE MELBOURNE VENTURE SECURITIES PTY LTD AFSL No. 224 313
Melbourne Office:
Suite 4, Level 2, Bank House 11 - 19 Bank Place,
Melbourne, Vic, Australia 3000
Telephone: Facsimile: Email: (+613) 9600 3599 (+613) 9602 2291 [email protected] Web: www.beerandco.com.au