On Measures of Racial/Ethnic Disproportionality in Special Education:
An Analysis of Selected Measures, A Joint Measures Approach,
And Significant Disproportionality
Lalit Roy
California Department of Education
Sacramento, California
On Measures of Racial/Ethnic Disproportionality in Special Education:
An Analysis of Selected Measures, A Joint Measures Approach,
And Significant Disproportionality
Lalit Roy
[This paper was prepared for the California Department of Education, Special Education Division. Any opinions expressed in the paper are those of the author and they do not reflect any opinion, position or policy of the California Department of Education and no endorsement is implied.]
On Measures of Racial/Ethnic Disproportionality in Special Education: An Analysis of
Selected Measures, A Joint Measures Approach, And
Significant Disproportionality
Executive Summary
Federal law requires each state to examine racial/ethnic disproportionality in special education in all districts within the state and for the state as a whole on an annual basis. According to the State Performance Plan (SPP), disproportionality shall be examined for seven racial/ethnic groups of students: (1) Native American, (2) Asian, (3) Pacific Islander, (4) African-American, (5) Hispanic, (6) White, and (7) Multiple racial/ethnic groups. For each of these groups, disproportionality shall be examined: (1) in the overall special education program, (2) in six major disability categories, (3) in eight special education service delivery environments, and (4) in suspension and expulsion of students in special education. Selected results from disproportionality calculations are reported to the federal Office of Special Education Programs (OSEP) through the Annual Performance Report (APR) and are also released to the public.
Seven commonly used disproportionality measures were analyzed to determine their strengths and weaknesses using enrollment of African-American students in the Intellectual Disability (ID) category in an actual district in California. The measures are: (1) Composition, (2) Relative Difference in Composition, (3)
Risk, (4) Risk Ratio, (5) Weighted Risk Ratio, (6) Alternate Risk Ratio, and (7) the E-formula. Each measure was applied to the same district data for determining overrepresentation or underrepresentation of the seven racial/ethnic groups in the ID category. The results were quite different from one measure to another. The measures were tested to determine how well they address the following situations: (1) Effect on districts with different enrollment size; (2) Effect on small enrollments and their fluctuations; (3) Exclusion of groups from disproportionality calculations due to small cell size; (4) Region of Tolerance for Disproportionality; (5) Effect on districts that are racially/ethnically “homogeneous” and “almost homogeneous”; and (6) Effect of the state incidence rate on districts. Again, the measures addressed these issues differently from each other. Finally, nine essential elements were identified to characterize a disproportionality measure. Each measure was judged against the others on the basis of how well the measures incorporate these elements. For each measure, these elements were rated on a five-point scale: five being the best and one the worst. The elements are: (1) Definition of the measure, (2) The calculation process, (3) Interpretation and usefulness of results, (4) Comparability of results among districts, (5) Effect on small enrollments and their fluctuations, (6) Exclusion of groups due to small cell size, (7) Differentiated Region of Tolerance for Disproportionality, (8) Effect on “homogeneous” and “almost homogeneous” districts, and (9) Effect of the state incidence rate on districts. Once again, the ratings of the elements were quite different from one measure to another, reflecting their relative strengths and weaknesses with regard to integrating these elements. The results of the rating process put the E-formula on top of the list with 3.4 points, followed by Alternate Risk Ratio (3.2), Risk Ratio
(2.7), and Weighted Risk Ratio (2.1).
Based on the rating results, the top two measures were applied individually to all districts in California to get an idea about the number of districts of various sizes that are likely to be disproportionate under various thresholds. The same two measures were also applied jointly to the same districts to preview the number and types of districts that are likely to be selected under various combinations of thresholds in the two measures. The results indicate that a joint measures approach, using the two top-rated measures, to determine
disproportionality has some distinct advantages over using a single measure. A joint measures approach brings together the strengths of the individual measures and compensates each other for their weaknesses. Several definitions of significant disproportionality were examined using the concepts of frequency,severity,
and persistency of disproportionality in a district. The strengths and weaknesses of these definitions were analyzed using various scenarios of disproportionality over a 15-year period. Three definitions of significant disproportionality under persistency appear to be more promising than the rest.
Table of Contents
Executive Summary Preface
Chapter Page
1. Background and Scope 1
1.1 What is Disproportionality? 2
2. Measures of Disproportionality 4
Composition 6
Relative Difference in Composition 7
Risk 8
Risk Ratio 9
Weighted Risk Ratio 10
Alternate Risk Ratio 12
The E-formula 13
Overrepresentation 14
Underrepresentation 16
2.1. Effect of the Measures on District Size 18
2.2. Effect on Small Enrollments and Their Fluctuations 21
2.3. Exclusion of Groups from Disproportionality Calculations 23
2.4. Region of Tolerance for Disproportionality 25
2.5. Effect of the Measures on Homogeneous and Almost Homogeneous Districts 27
2.6. Effect of the State Incidence Rate on Districts 30
2.7. Summary of Findings 33
Risk Ratio 33
Weighted Risk Ratio 34
Alternate Risk Ratio 34
The E-formula 35
2.8. Discussion of Results 36
3. Rating the Disproportionality Measures 39
4. Effect of the Top Two Measures on Districts 44
5. The Case for a Joint Measures Approach 50
5.1. Four Case Studies under the Joint Measures Approach 52
District A 54 District B 55 District C 55 District D 55 5.2. Recommendation 56 6. Significant Disproportionality 58
6.2. Severity 59 6.3 Persistency 60 Definition P-1 62 Definition P-2 63 Definition P-3 64 Definition P-4 66 Definition P-5 66 Definition P-6 67 Definition P-7 70 Definition P-8 71
6.4. Discussion of Results from Various Definitions 73
6.5. Recommendation 74
7. A Final Note 76
Notes 78
Appendix A. Mathematical Expression of Risk Ratio 83
B. Mathematical Expression of Weighted Risk Ratio 84
C. Mathematical Expression of Alternate Risk Ratio 85
D. Alternate Table 18 86
References 87
Attachments A. Actual data from a School District in California: General Education (GE) Enrollment = 16,115; Intellectual Disability (ID) Enrollment = 171 88
B. Hypothetical Small School District: General Education (GE) Enrollment = 1,000; Intellectual Disability (ID) Enrollment = 10 91
C. Hypothetical Medium Sized School District: General Education (GE) Enrollment = 10,000; Intellectual Disability (ID) Enrollment = 100 94
D. Hypothetical Large School District: General Education (GE) Enrollment = 50,000; Intellectual Disability (ID) Enrollment = 500 97
E. Hypothetical Small School District – Effect of One New Native American Student: General Education (GE) Enrollment = 1,001; Intellectual Disability (ID) Enrollment = 11 100 F. Hypothetical Medium Sized School District – Effect of One New Native American Student: General Education (GE) Enrollment = 10,001; Intellectual Disability (ID) Enrollment = 101 103 G. Hypothetical Medium Sized School District – Perfectly Homogeneous (100% Hispanic): General Education (GE) Enrollment = 10,000; Intellectual Disability (ID) Enrollment = 100 106 H. Hypothetical Medium Sized School District – Almost Homogeneous (90% Hispanic): General Education (GE) Enrollment = 10,000; Intellectual Disability (ID) Enrollment = 100 109 I. Hypothetical Medium Sized School District – Effect on High Incidence Rate in District: General Education (GE) Enrollment = 10,000; Intellectual Disability (ID) Enrollment = 200 112 About the Author 115
Preface
This project started out as a brief position paper on the effectiveness of various measures of racial/ethnic disproportionality in special education. As the work progressed, several related issues surfaced that needed to be addressed in order to make the outcome of the project meaningful. In the end, the results of this effort turned out to be more like an investigative report than a simple position paper. Needless to say, the project took much longer to complete than was originally planned.
The paper is intended primarily for the policy makers at the state and federal levels who often struggle with how best to define and measure racial/ethnic disproportionality in special education. The analysis of various measures in the paper would, hopefully, provide helpful information in making appropriate policy decisions in this respect. The program administrators at the local level, who will ultimately be responsible for implementing such policies, would also benefit from the analysis provided in the paper. Education professionals in the academic circles might find the analysis informative.
The paper is comprised of three components: an analysis of selected disproportionality measures is
presented in Chapters 1-3; a Joint Measures Approach to disproportionality is introduced in Chapters 4-5; and various definitions of significant disproportionality and their implications are discussed in Chapter 6.
Several colleagues at the California Department of Education helped me define the focus and scope of the project. It was Chris Drouin who brought this topic to my attention and asked me to take an in-depth look into the various disproportionality measures used by the states. Along with Chris Drouin, Ben Traverso and Bruce Little reviewed earlier drafts of the paper and made good suggestions. Bernie Yaklin and Alexa Slater assisted me with developing the graphics.
The paper benefited from input from some of my professional colleagues in other states and agencies: Sandra McQuain of West Virginia Department of Education, Inni Barone of New York Department of Education, Jean Taylor of Idaho Department of Education, and Cesar D’Agord of the Western Regional Resource Center (WRRC) at the University of Oregon were kind enough to review an earlier draft of the paper and gave me their feedback.
I am particularly grateful to Dr. Tom Munk of the Data Accountability Center (DAC) at Westat Corporation, Rockville, Maryland, for a thorough technical review of the document. He brought to my attention several errors and omissions in an earlier version of the document and made valuable suggestions clarifying a number of issues and statements in the paper. DAC (2007-2012) was funded by the U.S. Department of Education, Office of Special Education Programs (OSEP).
My special thanks are due to Anita Salvo and Lisa Stie at the California Department of Education who took the time thoroughly reviewing the document. They did an excellent job editing the document and pointing out many errors and inconsistencies that had escaped my senses completely.
I sincerely apologize to those friends and colleagues who provided feedback and assistance in various forms throughout the development of the paper, whose names I may have failed to mention here. The document reflects my synthesis of all input that I have received; any remaining errors and omissions are entirely mine. Finally, I must recognize my family for lending me their support, putting up with my preoccupation with the paper during family times, and for participating in sporadic discussions on the paper during many evenings and weekends.
Lalit Roy
On Measures of Racial/Ethnic Disproportionality in Special Education:
An Analysis of Selected Measures, A Joint Measures Approach,
1. Background and Scope
Racial/ethnic disproportionality in special education has become a national issue since the 1997 amendments of the Individuals with Disabilities Education Act (IDEA). In subsequent years, it became an indicator in the State Performance Plan (SPP), which requires the states to annually examine and monitor racial/ethnic disproportionality in special education for each district within the state as well as for the state as a whole (as a single entity). The monitoring process includes, among others, determination of racial/ethnic disproportionality and significant disproportionality in the following areas of special education:
1. Overall special education program
2. Major disability categories in special education
3. Special education service delivery environments (placement settings) 4. Suspension and expulsion of students in special education
Selected results from disproportionality calculations are reported annually to the federal Office of Special Education Programs (OSEP) at the U.S. Department of Education through the Annual Performance Report (APR) and are released to the public. If a district has significant racial/ethnic disproportionality in any of the above areas of special education, the state must direct the district to use 15 percent of its IDEA funds to address the disproportionality issues.
The magnitude of this requirement is enormous. The volume of calculations alone to determine racial/ethnic disproportionality for all districts in a state like California is incredibly large. To get an idea of the sheer size of this process, consider the following facts.
Each year, a state collects, among others, enrollment data from all school districts in the state and reports them to the U.S. Department of Education in order to comply with the federal reporting requirements and to obtain federal funds. According to the federal regulations, each district must identify and report all students in general education and special education (students who receive special education and/or related services with an Individualized Education Program or IEP) in one of the following seven racial/ethnic groups:
1. Native American (American Indian or Alaskan Native) 2. Asian
3. Pacific Islander
4. Black or African-American (not Hispanic; the term Black is used by the Office for Civil Rights and the U.S. Department of Education for all data collections and reports at the federal level; both terms, Black and African-American, are used in the text interchangeably) 5. Hispanic
6. White (not Hispanic)
7. Multiple racial/ethnic group (more than one racial/ethnic background)
For each of these racial/ethnic groups, disproportionality must be examined in the special education program as a whole (overall program) and in each of the following six major disability categories:
1. Autism (AUT)
3. Intellectual Disability (ID), previously known as Mental Retardation (MR) 4. Other Health Impairment (OHI)
5. Specific Learning Disability (SLD)
6. Speech and Language Impairment (SLI)
Again, for each of the seven racial/ethnic groups, disproportionality calculations shall be carried out in each of the following eight special education service delivery environments (also known as placement settings or placement categories):
1. Correctional Facility
2. Homebound / Hospital Program 3. Parentally Placed Private School
4. Regular Education Class, 0-39 percent of school day 5. Regular Education Class, 40-79 percent of school day 6. Regular Education Class, 80-100 percent of school day 7. Residential Facility
8. Separate School
Once again, for each of the seven racial/ethnic groups, disproportionality shall be examined for students in special education (students with an IEP), who are disciplined (suspended and/or expelled) for ten or more days during the school year.
All of the above analyses are to be conducted for all school districts in the state (there are about 1,000 school districts in California) and for the state as a whole (as a single entity).
The purpose of this paper is twofold: (1) to examine various measures of racial/ethnic
disproportionality in special education that many states currently use in order to comply with the federal requirements, review their strengths and weaknesses, and provide necessary information so the user can make the best possible decision in selecting one or more measures to determine disproportionality; and (2) to explore different ways to define significant disproportionality in special education, evaluate their effectiveness in addressing various disproportionality scenarios, and recommend one or more such definitions for possible use.
1.1. What is Disproportionality?
In general, disproportionality may be defined as a situation when two or more proportions are not the same or are not within an agreed upon range of values. If two proportions are the same or are within an agreed upon range of values, then it is implied that there is no disproportionality between the two proportions. If, on the other hand, the two proportions are not the same or are outside the agreed upon range of values, then the proportions are considered disproportionate.
There are two broad categories of definitions of racial/ethnic disproportionality in special education, commonly known as Composition and Risk. These two categories are different from each other as to how the proportion of a racial/ethnic group in special education (the statistic) is calculated and how it is compared against the proportion of the comparison group.
In Composition, the proportion of all special education students (or all students in a subcategory of special education, such as a disability category or a placement setting) in a particular racial/ethnic group in a district is compared against the proportion of all general education students in the same
racial/ethnic group in the district. The underlying assumption in this category of definitions is that the proportion of all general education students in a racial/ethnic group in the district is the benchmark, norm, standard or socially acceptable proportion.1
Under the broad category of Risk, the proportion of all general education students in a racial/ethnic group who are enrolled in special education (or in a subcategory of special education, such as a disability category or placement setting) in a district is compared against the proportion of general education students in all other racial/ethnic groups combined who are enrolled in special education (or in the same subcategory of special education) in the district.2 This definition assumes that the
proportion of the comparison group (all other racial/ethnic groups combined) is the benchmark, norm, standard or socially acceptable proportion. Since the comparison group is composed of all other racial/ethnic groups, except the racial/ethnic group in question, the composition of the comparison group is not the same for each racial/ethnic group. Therefore, the benchmark, norm, standard or social acceptability of the proportion of the comparison group is always different for each racial/ethnic group.3
2. Measures of Disproportionality
Under the two broad categories, Composition and Risk, there are several measures to determine racial/ethnic disproportionality in special education that are currently used by the states or have been used in the past. These measures are intended to produce two types of results:
overrepresentation and underrepresentation.4 These terms are defined below. Note that, unless
otherwise specified, the term “special education” in this paper includes any subpopulation in special education, such as students in a disability category or in a service delivery environment (placement setting).
As stated in the last chapter, racial/ethnic disproportionality under the broad category of
Composition is defined by the difference between the proportion of all special education (SE) students in a racial/ethnic group and the proportion of all general education (GE) students in the same racial/ethnic group. In this category of measures, overrepresentation is defined as when the proportion of the racial/ethnic group is more in special education than in general education.
Underrepresentation occurs when the proportion is less in special education than in general education. Three commonly used measures of disproportionality fall under Composition: (1) Composition, by itself, (2) Relative Difference in Composition, and (3) the E-formula.
Also stated in the last chapter, racial/ethnic disproportionality under the broad category of Risk is determined by comparing the risk of one racial/ethnic group to be in special education against the corresponding risk of all other racial/ethnic groups combined. Overrepresentation occurs when the
risk of a racial/ethnic group is higher than that of the comparison group. Underrepresentation
happens when the risk of a racial/ethnic group is lower than that of the comparison group. Four commonly used measures of disproportionality fall under Risk: (1) Risk, by itself, (2) Risk Ratio, (3) Weighted Risk Ratio, and (4) Alternate Risk Ratio. (Actually, Weighted Risk Ratio is a hybrid measure; it combines district risk with statewide composition, discussed later in the paper.) In all measures, any disproportionality or discrepancy would be considered significant when the disproportionality (overrepresentation or underrepresentation) crosses a threshold set by state policy or if it meets the definition of significant disproportionality adopted by the state, discussed later in the paper in detail.
To assist states in monitoring racial/ethnic disproportionality in special education, the OSEP and Westat Corporation (a private consulting firm under contract with OSEP) convened a task force to address this issue. The OSEP/Westat Task Force developed a document, Methods for Assessing Racial/Ethnic Disproportionality in Special Education: A Technical Assistance Guide, which lists a number of measures to calculate racial/ethnic disproportionality in special education and discusses their strengths and limitations. The document, however, does not include all disproportionality measures that are currently used by the states, such as the E-formula that has been in use in California since the 1970’s and subsequently in other states.
This paper analyzes some of the most commonly used measures of racial/ethnic disproportionality that are currently used by the states. Each measure is discussed individually, illustrated with actual data from a school district, and is followed by a discussion of its strengths and limitations. Following individual presentations, the measures are compared against each other using a set of hypothetical district data of various sizes (small, medium, and large) to examine how the measures affect
different sized districts. Next, the measures are tested for their impact on a number of situations such as, their effect on enrollment fluctuations, effect on districts that are racially/ethnically
“homogeneous” and “almost homogeneous”, and so forth. Following that, the measures are tested for their sensitivity to high or low incidence rates in the district, compared to the state incidence rates. Finally, the measures are rated on a rating scale using a set of criteria that are critical to any procedure to determine disproportionality.
The measures presented in this paper are: Composition
Relative Difference in Composition Risk
Risk Ratio
Weighted Risk Ratio Alternate Risk Ratio The E-formula
There may be other measures used by the states that are not included in the above list. One such measure that we decided not to include in this analysis was recommended by OSEP several years ago. According to this measure, which falls under the broad category of Composition, a state is allowed to set a percentage threshold above and below a district’s general education enrollment percentage of a racial/ethnic group. If the actual percentage of the same racial/ethnic group in special education or in a disability category or in a special education service delivery environment is
beyond that threshold, then the group is considered overrepresented or underrepresented, depending on the direction of the threshold. California Department of Education (CDE) used this approach in the past with a 20 percent threshold for overrepresentation and a 40 percent threshold for underrepresentation. Soonit became evident that the results of this measure were rather “flat” and they did not provide the necessary flexibility to address varying enrollments or impacts of enrollment fluctuations in different sized districts. Eventually, the measure lost its appeal to the states and its support at the federal level. Several new and more sophisticated measures emerged in recent years, although not without limitations of their own, which are currently supported by OSEP and included in this paper.5
Because of the volume of data and the large number of calculations involved in determining disproportionality in all possible combinations of racial/ethnic groups, disability categories, and special education service delivery environments, this paper will limit the analysis to only one racial/ethnic group in one disability category. The paper does not address disproportionality in special education programs as a whole (overall program) or in special education service delivery environments (placement categories) or in suspension and expulsion (discipline) in special
education. Any issues arising from disproportionality in a disability category should give the reader some idea about similar issues in the other three situations as well. The focus of the analysis is kept at the district level only; it does not address state-level disproportionality issues. Also, the reporting requirements, monitoring of district policies and procedures, and fiscal implications are beyond the scope of this paper.
To the extent appropriate, each measure is described below in the format of a question it attempts to answer. This is followed by a definition of the measure resulting in a statistic that answers the question. For the sake of simplicity and unless otherwise indicated, we have used African-American or Black students as the racial/ethnic group and Intellectual Disability (ID) as the disability category
in special education in describing each measure. However, data on all racial/ethnic groups are shown in the attachments at the end of the paper.6
Composition
Composition is a simple way to look into the racial/ethnic background of students in special education. It is the percentage distribution of all racial/ethnic groups who are enrolled in special education or identified in a disability category or who receive services in a special education service delivery environment. Composition attempts to answer a question like this:
Question: What percentage of all students in a district receiving special education and related services under the identification of the ID category is Black or African-American? Measure: [(Number of Black or African-American students in the ID category) / (Total number
of students in all racial/ethnic groups in the ID category)] * 100
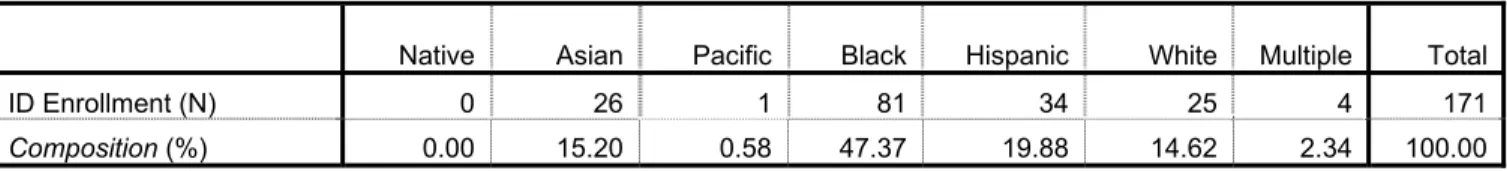
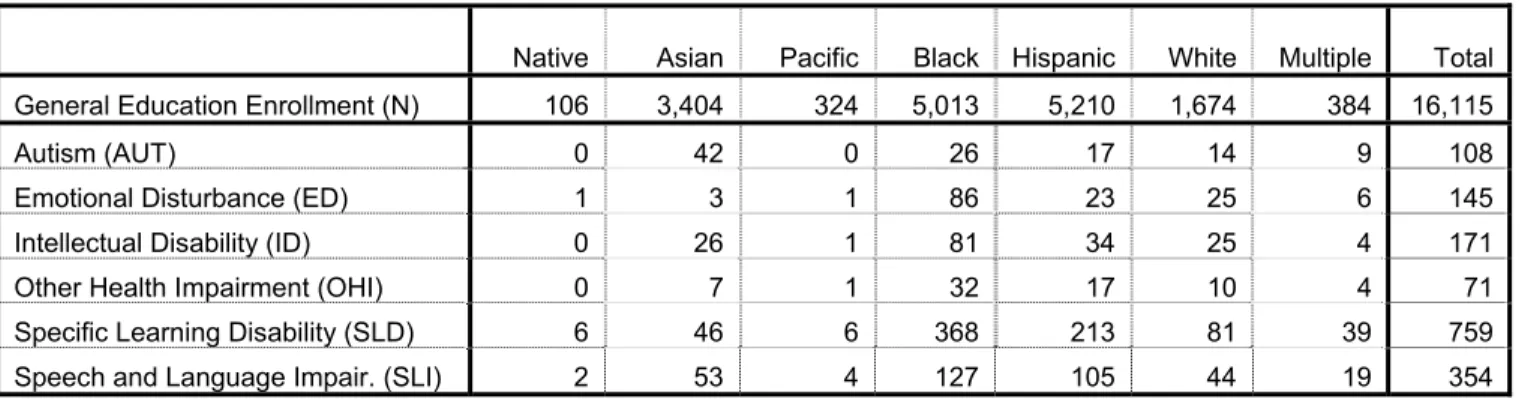
Actual data from a district are shown in Table 1, illustrating the racial/ethnic composition of students in the ID category. The detailed calculations are shown in Attachment A.
Table 1. Racial/Ethnic Composition of Enrollment in the ID Category
Native Asian Pacific Black Hispanic White Multiple Total
ID Enrollment (N) 0 26 1 81 34 25 4 171
Composition (%) 0.00 15.20 0.58 47.37 19.88 14.62 2.34 100.00
Source: Attachment A.
Table 1 shows that the Composition of Black or African-American students in the ID category is 47.37 percent and the Composition of White students, for example, is 14.62 percent. These numbers, by themselves, do not provide any information on racial/ethnic disproportionality, and therefore, are not very useful. However, when they are compared against the composition of African-American and White students in general education (GE) enrollment (or total enrollment7) in
the same district, they reveal a discrepancy (see Table 2).
Table 2. Racial/Ethnic Composition of Enrollment in General Education (GE) and in the ID Category
Native Asian Pacific Black Hispanic White Multiple Total
GE Enrollment (N) 106 3,404 324 5,013 5,210 1,674 384 16,115
GE Composition (%) 0.66 21.12 2.01 31.11 32.33 10.39 2.38 100.00
ID Enrollment (N) 0 26 1 81 34 25 4 171
ID Composition (%) 0.00 15.20 0.58 47.37 19.88 14.62 2.34 100.00
The composition of Black or African-American students in general education in the same district is 31.11 percent, compared to 47.37 percent in the ID category, which shows that there are
proportionately more African-American students identified in the ID category than are in general education in the district. If the percentage is higher in special education than in general education, then the racial/ethnic group is overrepresented and if the percentage is lower then it is
underrepresented. In this case, African-American students are overrepresented in the ID category. By comparison, the composition of white students in the ID category is 14.62 percent, compared to 10.39 percent in general education – still overrepresented, but by a smaller discrepancy (4.23 percentage points) than African-American students (16.26 percentage points).
Relative Difference in Composition
Relative Difference in Composition for a racial/ethnic group is the difference between its special education composition and general education composition, expressed as a percentage of its general education composition. This measure allows comparing disproportionality of various racial/ethnic groups against each other. This is an improvement over using Composition by itself or even the difference of compositions between special education and general education, but still not very useful, as we shall see later. Relative Difference in Composition attempts to answer a question like this:
Question: What is the difference between the compositions of African-American students in the ID category and in general education (GE) in terms of percentage of the composition of African-American students in general education?
Measure: [((Composition (%) of African-American students in the ID category) – (Composition
(%) of African-American students in general education)) / (Composition (%) of African-American students in general education)] * 100
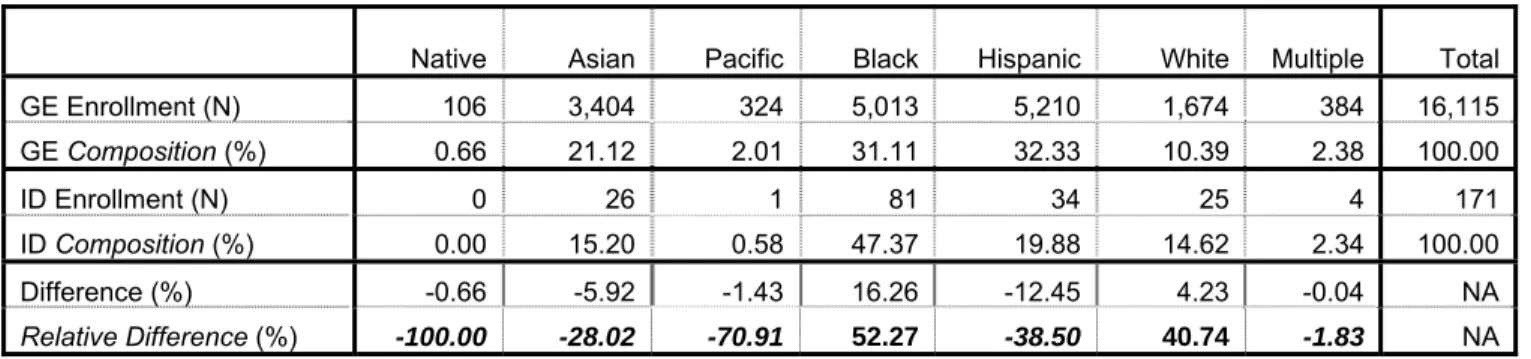
The results of the Relative Difference in Composition for various racial/ethnic groups are shown in Table 3.
Table 3. Relative Difference in Composition between General Education (GE) and the ID Category
Native Asian Pacific Black Hispanic White Multiple Total
GE Enrollment (N) 106 3,404 324 5,013 5,210 1,674 384 16,115 GE Composition (%) 0.66 21.12 2.01 31.11 32.33 10.39 2.38 100.00 ID Enrollment (N) 0 26 1 81 34 25 4 171 ID Composition (%) 0.00 15.20 0.58 47.37 19.88 14.62 2.34 100.00 Difference (%) -0.66 -5.92 -1.43 16.26 -12.45 4.23 -0.04 NA Relative Difference (%) -100.00 -28.02 -70.91 52.27 -38.50 40.74 -1.83 NA Source: Attachment A.
The Relative Difference in Composition for Black or African-American students in the ID category is 52.27 percent, which means that the composition of African-American students identified in the ID category is 52.27 percent more than the composition of African-American students in general education. By comparison, the composition of White students identified in the ID category is 40.74 percent more than the composition of White students in general education. On the other hand, the composition of Asian students identified in the ID category is 28.02 percent less than the
composition of Asian students in general education. Note that a positive Relative Difference in Composition means overrepresentation and a negative Relative Difference in Composition means
underrepresentation.
The interpretation of Relative Difference in Composition is not quite intuitive. The statistic, being the percentage of a percentage, makes it a little difficult to comprehend easily. Also, one needs to exercise caution in interpreting the statistic resulting from small numbers in the numerator, such as in Native American and Pacific Islander groups. For example, the Relative Difference in
Composition for Native American students is -100.00 percent because there are no Native
American students in the ID category at all, no matter how large the Native American enrollment in general education is in the district. Pacific Islanders have only one student identified in the ID category. One additional Native American or Pacific Islander student in the ID category could alter the statistic considerably (this is discussed in detail in a later section in the paper).
Risk
Like Composition, Risk is also a relatively simple approach to examine ethnic disproportionality in special education. As defined before, it is the percentage of students in a racial/ethnic group who are enrolled in special education or in any subcategory of special education. It is also described as the risk of a racial/ethnic group of being (or to be) in special education.8 The “relative risk” can be
determined by comparing the risk of one racial/ethnic group against that of another. In special education, Risk refers to the percentage of all general education students in a racial/ethnic group who are enrolled in special education and related services or in a disability category or in a special education service delivery environment. Risk attempts to answer a question like this:
Question: What percentage of all African-American students in a district is receiving special education and related services under the identification of the ID category?
Measure: [(Number of American students in the ID category) / (Total number of African-American students in general education)] * 100
A generalized expression of this measure is given by:
Red = (DSEed / DGEe) (100.00)
Where: Red = Risk of racial/ethnic group e in disability category d in a district
DSEed = District special education enrollment of racial/ethnic group e in disability
category d
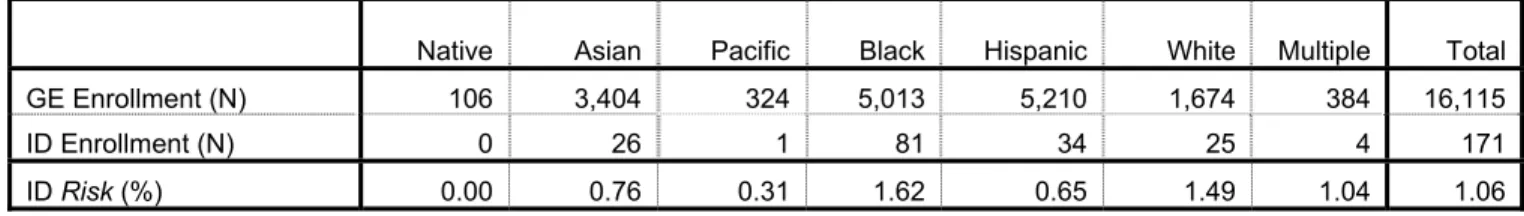
The Risk for various racial/ethnic groups to be identified in the ID category is shown in Table 4.
Table 4. Risk for Various Racial/Ethnic Groups in General Education (GE) to be in the ID Category
Native Asian Pacific Black Hispanic White Multiple Total
GE Enrollment (N) 106 3,404 324 5,013 5,210 1,674 384 16,115
ID Enrollment (N) 0 26 1 81 34 25 4 171
ID Risk(%) 0.00 0.76 0.31 1.62 0.65 1.49 1.04 1.06
Source: Attachment A.
In the district in Table 4, the Risk for Black or African-American students identified in the ID category is 1.62 percent, which is higher than 1.49 percent for White students and 1.06 percent for all
students. These values provide some idea about the “relative risk” of various racial/ethnic groups to be identified in the ID category in relation to another group.9
As stated in the last section, one needs to exercise caution in interpreting Risk as well when the numerator is small or zero. In this case, the Risk for Native American students is 0.00 percent or none. This is because the Native American enrollment in the ID category in the district is zero, no matter how large the Native American enrollment in general education is in the district.
Risk Ratio
Risk for a racial/ethnic group, by itself, does not provide sufficient information about racial/ethnic disproportionality unless it is compared against the Risk of a comparison group, when it is known as the Risk Ratio. Most often, the comparison group is comprised of all other racial/ethnic groups combined, not including the racial/ethnic group in question. Risk Ratio attempts to answer a question like this:
Question: What is the Risk for African-American students receiving special education and related services in the ID category in a district, compared to the Risk for all other students receiving special education and related services in the ID category in the same district?
Measure: [(Risk (%) of African-American students in the ID category) / (Risk (%) of all other students combined in the ID category)]
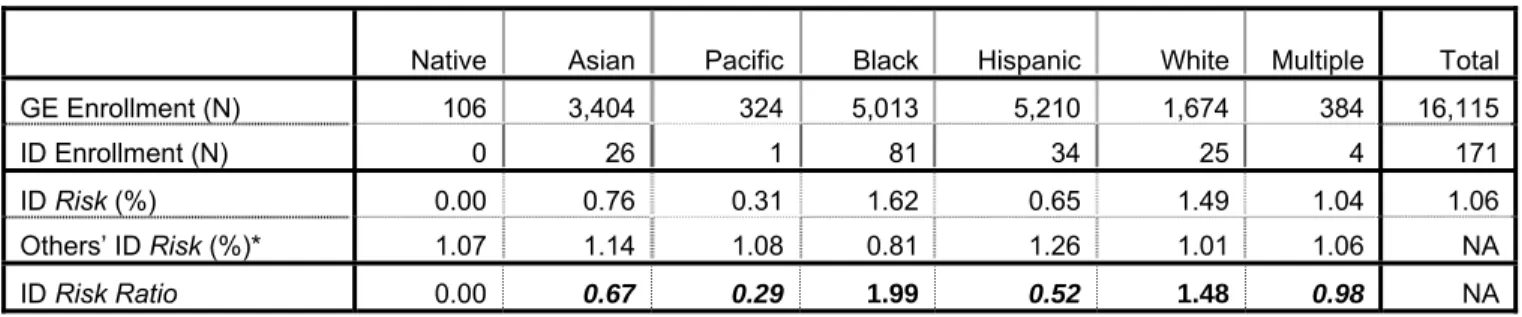
A generalized mathematical version of this definition is shown in Appendix A. The results of the Risk Ratio for various racial/ethnic groups are shown in Table 5.
The data in Table 5 show that, African-American students are 1.99 times at risk (or as likely) to be identified in the ID category as all other racial/ethnic groups combined to be identified in the ID category. Asian students are 0.67 times as likely to be identified in the ID category as all other groups combined to be identified in the ID category. The value of the Risk Ratio more than 1.00 for a racial/ethnic group means higherrisk (overrepresentation) and less than 1.00 means lowerrisk
(underrepresentation) than the comparison group. In this case, African-American and White students are overrepresented; Asian, Pacific Islander, Hispanic, and Multiple racial/ethnic groups are underrepresented in the ID category.
Table 5. Risk Ratio for Various Racial/Ethnic Groups in the ID Category
Native Asian Pacific Black Hispanic White Multiple Total
GE Enrollment (N) 106 3,404 324 5,013 5,210 1,674 384 16,115 ID Enrollment (N) 0 26 1 81 34 25 4 171 ID Risk(%) 0.00 0.76 0.31 1.62 0.65 1.49 1.04 1.06 Others’ ID Risk(%)* 1.07 1.14 1.08 0.81 1.26 1.01 1.06 NA ID Risk Ratio 0.00 0.67 0.29 1.99 0.52 1.48 0.98 NA Source: Attachment A.
GE = General Education; NA = Not Applicable; Bold = Overrepresentation; Bold and Italics = Underrepresentation * “Others’ ID Risk (%)” refers to the risk for all other racial/ethnic groups in the district combined to be in the ID category.
The interpretation of Risk Ratio is rather straight forward, and therefore, the usefulness of the results is also quite clear. Because the Risk Ratio results for a district are based on data from that district only, they can be used for making any changes in policy, program or practices in that district. For example, if the district has a procedure in place that results in inappropriate identification of a large number of African-American students in the ID category, compared to other racial/ethnic groups in the ID category, then a change in such procedure would be warranted by the Risk Ratio
results. Any such changes in policy, program or procedure can also be implemented in the district because the district board has the full authority in implementing these changes, which, hopefully, could yield desired results.
Like the preceding measures, one should exercise caution in the interpretation and use of Risk Ratio resulting from small numbers.
Weighted Risk Ratio
While Risk and Risk Ratio calculations use district level data, Weighted Risk Ratio takes into account the racial/ethnic composition of all students in the state in the calculations. Since Risk and
Risk Ratio measures for a district use data from that district only, their results are not comparable with other districts’ results. To enable the results comparable across all districts in the state, the
OSEP/Westat Task Force recommends Weighted Risk Ratio as another approach to examine racial/ethnic disproportionality. In this approach, the risk for each racial/ethnic group in a district is
weighted by the racial/ethnic composition of the state.10 The computational process of the Weighted Risk Ratio is far from simple, as described in the Task Force Report, and is stated below.
Weighted Risk Ratio attempts to answer a question like this:
Question: What is the risk for African-American students receiving special education and related services in the ID category in a district, compared to the risk for all other students in the district in the ID category when both risks (of African-American
students and of all other racial/ethnic groups combined) are weighted according to the racial/ethnic composition of the state?11
Measure: [(District-level risk for African-American students in the ID category, weighted by the
composition of all other racial/ethnic groups combined in the state) / (Sum of risks of all other racial/ethnic groups in the ID category in the district, each individually
weighted by the composition of the same racial/ethnic group in the state)]
A generalized mathematical version of this definition is shown in Appendix B. In operational terms, the measure is defined as:
[{District African-American ID Risk * (1 – State African-American Composition)} / {(District Native American ID Risk * State Native American Composition) + (District Asian ID Risk * State Asian Composition) + (District Pacific Islander ID Risk * State Pacific Islander Composition) + (District Hispanic ID Risk * State Hispanic
Composition) + (District White ID Risk * State White Composition) + (District Multiple Racial/Ethnic Group ID Risk * State Multiple Racial/Ethnic Group Composition)}] [Note: All terms (Risk and Composition) in the above measure are fractions – not percentages.]
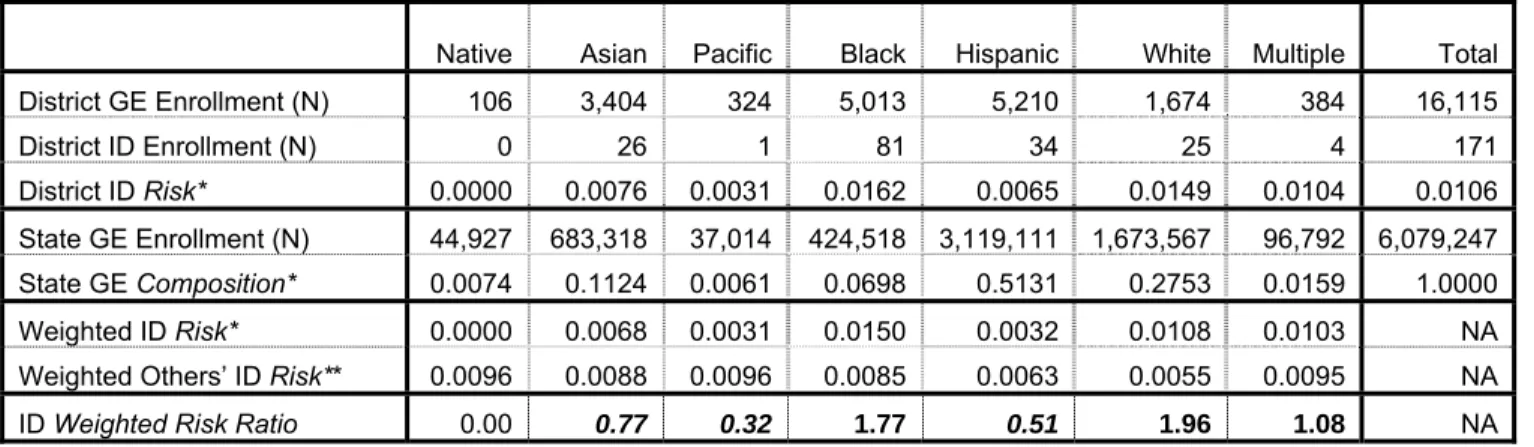
The results of the Weighted Risk Ratio for various racial/ethnic groups are shown in Table 6.
Table 6. Weighted Risk Ratio of Various Racial/Ethnic Groups in the ID Category
Native Asian Pacific Black Hispanic White Multiple Total
District GE Enrollment (N) 106 3,404 324 5,013 5,210 1,674 384 16,115 District ID Enrollment (N) 0 26 1 81 34 25 4 171 District ID Risk* 0.0000 0.0076 0.0031 0.0162 0.0065 0.0149 0.0104 0.0106 State GE Enrollment (N) 44,927 683,318 37,014 424,518 3,119,111 1,673,567 96,792 6,079,247 State GE Composition* 0.0074 0.1124 0.0061 0.0698 0.5131 0.2753 0.0159 1.0000 Weighted ID Risk* 0.0000 0.0068 0.0031 0.0150 0.0032 0.0108 0.0103 NA Weighted Others’ ID Risk** 0.0096 0.0088 0.0096 0.0085 0.0063 0.0055 0.0095 NA ID Weighted Risk Ratio 0.00 0.77 0.32 1.77 0.51 1.96 1.08 NA
Source: Attachment A.
GE = General Education; NA = Not Applicable; Bold = Overrepresentation; Bold and Italics = Underrepresentation * Risk and Composition in this table are fractions – not percentages.
** “Weighted Others’ ID Risk” refers to the sum of the risks of all other racial/ethnic groups in the district, each individually weighted by the statewide composition of the same racial/ethnic group.
The interpretation of Weighted Risk Ratio is neither intuitive nor clear. In the example in Table 6, Black or African-American students are 1.77 times as likely to be identified in the ID category (overrepresentation) as all other racial/ethnic groups combined to be identified in the ID category when both risks are weighted by the racial/ethnic composition of the state. Similarly, Asian students are 0.77 times as likely to be identified in the ID category (underrepresentation) as all other
racial/ethnic groups combined to be identified in the ID category when both risks are weighted by the racial/ethnic composition of the state. What does this mean?
The Weighted Risk Ratio imposes statewide racial/ethnic composition onto the district risk in order to make the ratios comparable across districts within the state. Although one could debate about the appropriateness of inter-district comparisons because of variations in local district policies and practices, the same reason could also be an impetus for comparing racial/ethnic disproportionality across the districts in a state.
Results from the Weighted Risk Ratio can be quite different from the Risk Ratio results. By weighing local district risk with the statewide racial/ethnic composition, the district risk is affected by the relative magnitudes of the composition of various racial/ethnic groups in the state. Because of the complexity of the Weighted Risk Ratio calculations, it is not easy to understand how and in what direction the district risk is affected by the statewide composition. In the case of African-American students, the Weighted Risk Ratio (1.77) is less than their Risk Ratio (1.99, Table 5); whereas, for White students the Weighted Risk Ratio (1.96) is higher than their Risk Ratio result (1.48, Table 5). It might be possible that a particular racial/ethnic group is overrepresented in one measure and
underrepresented in another.
Because the interpretation of Weighted Risk Ratio is not clear, it is difficult to figure out how the results from Weighted Risk Ratio can be used by a district to make any program or policy changes. Since the district results are influenced by the statewide demographics and the district does not have any authority over the other districts that comprise the state or over the state itself, the usefulness of the results of Weighted Risk Ratio is somewhat limited.
Like Risk and Risk Ratio, one should use caution in the interpretation and use of the Weighted Risk Ratio results from small numbers. Small variations in the number of students in a racial/ethnic group or the comparison group can produce dramatic changes in the Weighted Risk Ratio results as well, discussed later in the paper.
Alternate Risk Ratio
In situations when a district is racially/ethnically “homogeneous” or “almost homogeneous” and/or a comparison group is not available, Alternate Risk Ratio offers an option for examining racial/ethnic disproportionality.12 In Alternate Risk Ratio, the district risk for a racial/ethnic group is compared
against the risk for all other racial/ethnic groups in the state. This approach is similar to Weighted Risk Ratio in concept, but the calculation methodology is far simpler than the Weighted Risk Ratio
and the interpretation of the statistic is also relatively clear. Like Weighted Risk Ratio, the results of the Alternate Risk Ratio for districts can also be compared against each other within the state.
Alternate Risk Ratio attempts to answer a question like this:
Question: What is the risk for African-American students receiving special education and related services in the ID category in a district, compared to the risk for all other students receiving special education and related services in the ID category in the state?
Measure: [(District-level Risk (%) of African-American students in the ID category) / (State-level
Risk (%) of all other students combined in the ID category)]
A generalized mathematical expression of this definition is shown in Appendix C. The results of the
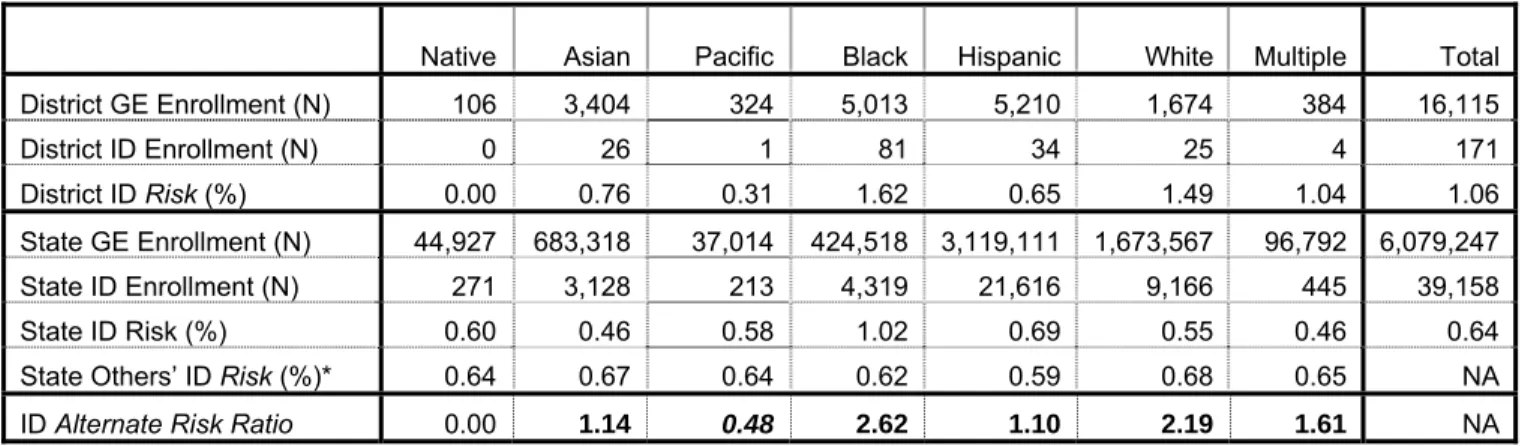
Table 7. Alternate Risk Ratio of Various Racial/Ethnic Groups in the ID Category
Native Asian Pacific Black Hispanic White Multiple Total
District GE Enrollment (N) 106 3,404 324 5,013 5,210 1,674 384 16,115 District ID Enrollment (N) 0 26 1 81 34 25 4 171 District ID Risk(%) 0.00 0.76 0.31 1.62 0.65 1.49 1.04 1.06 State GE Enrollment (N) 44,927 683,318 37,014 424,518 3,119,111 1,673,567 96,792 6,079,247 State ID Enrollment (N) 271 3,128 213 4,319 21,616 9,166 445 39,158 State ID Risk (%) 0.60 0.46 0.58 1.02 0.69 0.55 0.46 0.64
State Others’ ID Risk (%)* 0.64 0.67 0.64 0.62 0.59 0.68 0.65 NA ID Alternate Risk Ratio 0.00 1.14 0.48 2.62 1.10 2.19 1.61 NA
Source: Attachment A.
GE = General Education; NA = Not Applicable; Bold = Overrepresentation; Bold and Italics = Underrepresentation * “State Others’ ID Risk (%)” refers to the risk of all other racial/ethnic groups in the state combined to be in the ID category.
Interpretation of results of the Alternate Risk Ratio is relatively simple, compared to the Weighted Risk Ratio. Black or African-American students in this district are 2.62 times as likely to be identified in the ID category (overrepresentation) as all other students in the state combined to be identified in the ID category. By contrast, Pacific Islander students are 0.48 times as likely to be identified in the ID category (underrepresentation) as all other students in the state combined to be identified in the ID category.
Although both Weighted Risk Ratio and Alternate Risk Ratio use statewide demographics in the comparison groups, the methodological differences in the two measures are evident in the
differences in their results. In the same district, Asian and Hispanic students are underrepresented
in Risk Ratio (0.67 and 0.52, Table 5) and in Weighted Risk Ratio (0.77 and 0.51, Table 6), but are
overrepresented in Alternate Risk Ratio (1.14 and 1.10, Table 7).
The interpretation of Alternate Risk Ratio is relatively simple. However, it does not hold promise that any changes made in district policies and procedures, based on the results of the Alternate Risk Ratio, without making the necessary changes in the rest of the districts in the state would produce the desired outcome; any such effort can produce, at best, only partial results. Therefore, the usefulness of the results of Alternate Risk Ratio, like the Weighted Risk Ratio, is also somewhat limited.
Alternate Risk Ratio is also subject to the properties and limitations of small numbers, as mentioned in the previous risk measures.
The E-formula
The E-formula first appeared in 1974 in a court order resulting from a class action lawsuit (Diana, et al. v. State Board of Education, et al.) in the U.S. District Court in Northern California. The plaintiffs in the case successfully argued that there were proportionately more Chicano students in EMR (Educable Mentally Retarded) classes than in general education in the districts in a county in Northern California. After listening to lengthy hearings, arguments, and counter-arguments from both parties and opinions from experts in the field, the presiding judge ordered the state (California
Department of Education) to monitor districts showing “significant variance” between the percentage of Chicano children in EMR classes and the percentage of Chicano children in the school population by “one standard deviation,” which subsequently became known as the “E-formula.”
The E-formula also became the measure to determine disproportionate placement of Black children in EMR classes in the settlement agreement under the Larry P. vs. Riles lawsuit in California, which started in the 1970’s and continued through the 1980’s and early 1990’s. Similar to the Diana
lawsuit, the plaintiffs in the Larry P. case also alleged, among others, that the number of young African-American students identified as Educable Mentally Retarded (EMR) and placed in Special Day Class (SDC) setting for special education services was disproportionately higher than in the general education program in the district.
As part of the settlement agreement of the Larry P. lawsuit, the same presiding judge ordered the California Department of Education (CDE) to monitor disproportionate placement of African-American students identified as EMR in SDC placement setting, using the E-formula.13 Following that order, California Department of Education has monitored for many years overrepresentation of African-American students who were identified as EMR and placed in an SDC setting.
Overrepresentation
Neither the EMR disability category nor the SDC placement setting exists today in California. However, the E-formula has been found to be an effective measure to determine racial/ethnic disproportionality in special education. This is because the underlying statistical properties of the E-formula make the measure robust, allowing flexibility for different sized districts. The intent of the original E-formula was to determine overrepresentation only.
The E-formula is defined as:
E = A + √ ((A (100-A)) / N)
Where: E = Maximum percentage of the total special education enrollment (or special education enrollment in a disability category or service delivery environment) in a district allowed for a specific racial/ethnic group
A = Percentage of the same racial/ethnic group in general education in the district
N = The total special education enrollment (or special education enrollment in the same disability category or service delivery environment) in the district, as defined in E.
In the E-formula, special education enrollment can be viewed as a sample drawn from a population of general education enrollment. Programmatically (and statistically), this is a valid assumption because all special education students are also general education students in the same district. In statistical terms, the second component in the E-formula, “√ ((A (100-A)) / N)”, is comparable to
standard error of the sampling distribution of the proportion of a racial/ethnic group in special
education (the estimate). The formula represents a sampling event or a draw when the proportion of a racial/ethnic group in the sample (special education) is identical to the proportion of the same group in the population (general education). The original E-formula allows or adds one standard error to the general education proportion of a racial/ethnic group as a threshold to determine
overrepresentation, which establishes an upper bound of “tolerance” or “maximum allowance”, beyond which the proportion of the racial/ethnic group in special education (or special education enrollment in a disability category or service delivery environment) is considered disproportionate (overrepresented).
Since we are no longer restricted to use the E-formula solely in its original context and/or prohibited from modifying it for use in other situations, we are introducing three variations of the E-formula by adding two, three and fourstandard errors to the general education proportion that will allow us to examine the effect of the formula with different thresholds while retaining the statistical properties of the original E-formula.14 The original E-formula and the three variations are:
The E-formula: E1 = A + 1 (√ ((A (100-A)) / N)) (one standard error) Variation: E2 = A + 2 (√ ((A (100-A)) / N)) (two standard errors) Variation: E3 = A + 3 (√ ((A (100-A)) / N)) (three standard errors)
Variation: E4 = A + 4 (√ ((A (100-A)) / N)) (four standard errors)
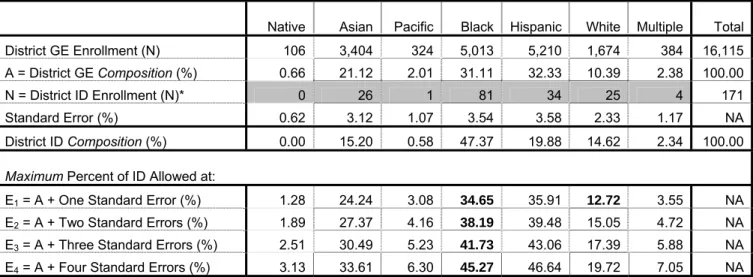
Table 8 shows the results of the original E-formula and the three variations in overrepresentation of various racial/ethnic groups identified in the ID category.
Table 8. Overrepresentation of Various Racial/Ethnic Groups in the ID Category under the E-formula
Native Asian Pacific Black Hispanic White Multiple Total District GE Enrollment (N) 106 3,404 324 5,013 5,210 1,674 384 16,115 A = District GE Composition (%) 0.66 21.12 2.01 31.11 32.33 10.39 2.38 100.00
N = District ID Enrollment (N)* 0 26 1 81 34 25 4 171
Standard Error (%) 0.62 3.12 1.07 3.54 3.58 2.33 1.17 NA
District ID Composition (%) 0.00 15.20 0.58 47.37 19.88 14.62 2.34 100.00
Maximum Percent of ID Allowed at:
E1 = A + One Standard Error (%) 1.28 24.24 3.08 34.65 35.91 12.72 3.55 NA E2 = A + Two Standard Errors (%) 1.89 27.37 4.16 38.19 39.48 15.05 4.72 NA E3 = A + Three Standard Errors (%) 2.51 30.49 5.23 41.73 43.06 17.39 5.88 NA E4 = A + Four Standard Errors (%) 3.13 33.61 6.30 45.27 46.64 19.72 7.05 NA Source: Attachment A.
GE = General Education; NA = Not Applicable; Bold = Overrepresentation
* The E-formula calculations use the total district enrollment in the ID category - not the enrollments in the individual racial/ethnic groups in the ID category, which are shaded for differentiation.
In this example, African-American students constitute 31.11 percent of general education enrollment in the district but 47.37 percent in the ID category. Under the original E-formula (at one standard error threshold) the allowed maximum for them not to be overrepresented in the ID category is 34.65 percent. Since the actual percentage of African-American students identified in the ID category is 47.37 percent, which is higher than the allowed maximum, they are overrepresented.
They are also overrepresented at the two, three, and four standard errors thresholds. However, they are not overrepresented at five standard errors and beyond, because the threshold at five standard errors is 48.81 percent, which is higher than the actual percentage of African-American students in the ID category in the district (data not shown in table but can be derived from Attachment A). By comparison, White students are also overrepresented at the one standard error threshold because the actual percentage of White students identified in the ID category (14.62) is higher than the maximum percentage allowed (12.72). But unlike African-American students, White students are not overrepresented at two standard errors or higher thresholds.
Asian students, on the other hand, at 15.20 percent of the total number of students identified in the ID category in the district, are well below their threshold of overrepresentation under the original E-formula (24.24 percent maximum), and therefore, are not overrepresented. In fact, none of the other ethnic groups, except African-American and White, are overrepresented at any of the four
thresholds. Note that lack of overrepresentation does not imply underrepresentation.
The interpretation of E-formula results for a district is relatively simple and the results can be used to make program or policy changes in that district. Any such changes can also be implemented in the district because the district board has the full authority in implementing these changes, which, hopefully, could yield desired results.
Underrepresentation
The mathematical expression for underrepresentation in the E-formula is quite similar to the original formula for overrepresentation, except that the connector between the first and the second
component is a minus (-) sign, instead of a plus (+) sign. This establishes a lower bound of “tolerance” or “minimum needs” from the percentage of a racial/ethnic group in general education below which the proportion of the racial/ethnic group in special education (or special education enrollment in a disability category or service delivery environment) is considered disproportionate (underrepresented).
The E-formula for underrepresentation can be shown as:
E = A - √ ((A (100-A)) / N)
Where: E = Minimum percentage of the total special education enrollment (or special education enrollment in a disability category or service delivery environment) in a district needed for a specific racial/ethnic group
A = Percentage of the same racial/ethnic group in general education in the district
N = The total special education enrollment (or special education enrollment in the same disability category or service delivery environment) in the district, as defined in E.
Like overrepresentation, we are also introducing three variations in the E-formula by adding two,
three and fourstandard errors to the general education proportion to examine the effects of various thresholds for underrepresentation. Because the original E-formula was intended for
overrepresentation only, all versions of the E-formula for underrepresentation are considered variations of the original E-formula. The variations in underrepresentation are:
Variation: E1 = A - 1 (√ ((A (100-A)) / N)) (one standard error)
Variation: E2 = A - 2 (√ ((A (100-A)) / N)) (two standard errors)
Variation: E3 = A - 3 (√ ((A (100-A)) / N)) (three standard errors) Variation: E4 = A - 4 (√ ((A (100-A)) / N)) (four standard errors)
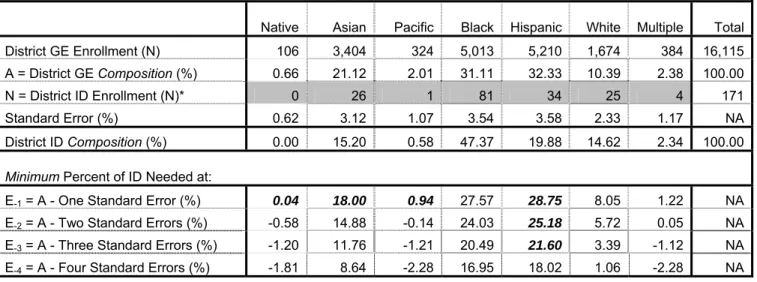
Table 9 shows the results of the E-formula variations for underrepresentation of various racial/ethnic groups in the ID category.
Table 9. Underrepresentation of Various Racial/Ethnic Groups in the ID Category Under the E-formula
Native Asian Pacific Black Hispanic White Multiple Total District GE Enrollment (N) 106 3,404 324 5,013 5,210 1,674 384 16,115 A = District GE Composition (%) 0.66 21.12 2.01 31.11 32.33 10.39 2.38 100.00
N = District ID Enrollment (N)* 0 26 1 81 34 25 4 171
Standard Error (%) 0.62 3.12 1.07 3.54 3.58 2.33 1.17 NA
District ID Composition (%) 0.00 15.20 0.58 47.37 19.88 14.62 2.34 100.00
Minimum Percent of ID Needed at:
E-1 = A - One Standard Error (%) 0.04 18.00 0.94 27.57 28.75 8.05 1.22 NA E-2 = A - Two Standard Errors (%) -0.58 14.88 -0.14 24.03 25.18 5.72 0.05 NA E-3 = A - Three Standard Errors (%) -1.20 11.76 -1.21 20.49 21.60 3.39 -1.12 NA E-4 = A - Four Standard Errors (%) -1.81 8.64 -2.28 16.95 18.02 1.06 -2.28 NA Source: Attachment A.
GE = General Education; NA = Not Applicable; Bold and Italics = Underrepresentation
* The E-formula calculations use the total district enrollment in the ID category - not the enrollments in the individual racial/ethnic groups in the ID category, which are shaded for differentiation.
The table shows that Asian students constitute 21.12 percent of general education enrollment in the district but 15.20 percent in the ID category. At one standard error threshold the needed minimum for Asian students not to be underrepresented in the ID category is 18.00 percent. Since the actual percentage of Asian students in the ID category is 15.20, which is less than the needed minimum, they are underrepresented. However, the Asian students are not underrepresented at two standard errors or higher thresholds.
Black or African-American students, on the other hand, at 47.37 percent of the total number of students identified in the ID category in the district, are well above the threshold for
underrepresentation at one standard error (27.57 percent minimum), and therefore, are not underrepresented.
Except for African-American, White, and the Multiple racial/ethnic group, all other racial/ethnic groups are underrepresented at the one standard error threshold. As the threshold increases to higher standard errors, these groups gradually move away from the underrepresentation domain in
varying degrees, depending on their enrollment size. Note that lack of underrepresentation does not
imply overrepresentation.
Unlike the risk measures, the E-formula and its variations do not appear to be affected by small numbers, at least not to the same degree. For Native American students, whose enrollment in the ID category is zero in the district, all E-formula values in Table 8 and Table 9, including the negative values15 in Table 9, show reasonable limits for overrepresentation and underrepresentation. Effects
of small numbers in all measures are discussed later in the paper in further details.
2.1. Effect of the Measures on District Size
Having an understanding of how each disproportionality measure works, we would like to examine how the measures affect districts of different enrollment sizes. To investigate this, we have created three hypothetical districts with general education enrollments of 1,000 (small), 10,000 (medium), and 50,000 (large), and applied all disproportionality measures to these districts. So we can
determine the effect of the measures on district size only and nothing else, all affecting variables are held constant across these districts for each racial/ethnic group. The composition of
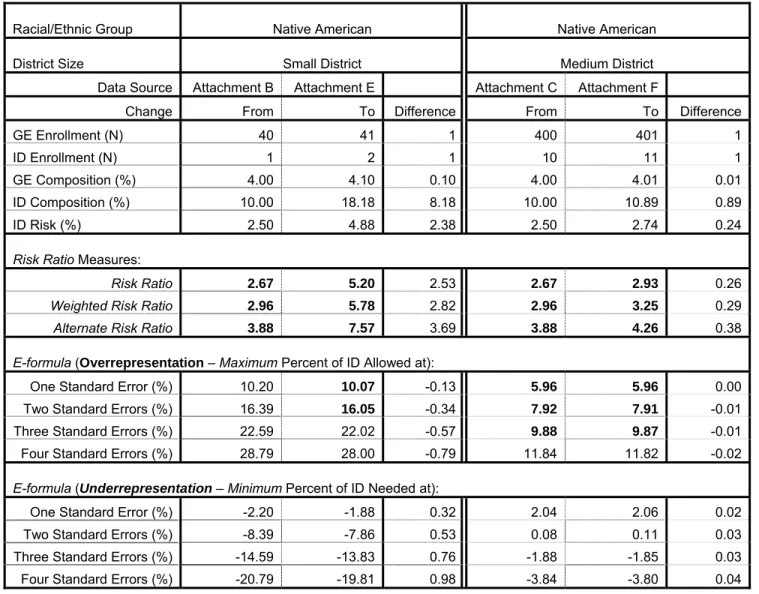
African-American students is held at 10 percent in general education (GE) and at 20.00 percent in the ID category in all three districts. The risk in the ID category is held at 1.00 percent for all students and at 2.00 percent for African-American students for each district. These constants are different for different racial/ethnic groups, but are the same for each group across the districts. The detailed calculations for this exercise are shown in Attachments B, C, and D for small, medium, and large districts, respectively. Table 10 summarizes the results of this comparison for African-American students in the ID category.
As we have seen from the discussion of individual measures in the preceding pages, three of the measures, Composition, Relative Difference in Composition, and Risk, do not provide sufficient information to determine racial/ethnic disproportionality, compared to the other four measures.16
Therefore, we will refrain from discussing these three measures any further, although the results of the comparison of all seven measures are shown in the attachments. The remaining four measures,
Risk Ratio, Weighted Risk Ratio, Alternate Risk Ratio, and the E-formula, offer sufficient promise in determining ethnic disproportionality, and they are also used by various states. The subsequent analysis in the paper will mainly focus on these four measures in comparing their effects on district size and in other situations.
To provide a comparative picture of the three hypothetical districts against an actual district, Table 10 includes the actual district data that have been used throughout the paper in describing the measures. The data for this district are drawn from Attachment A, and are logically placed in the table according to the district size and shaded for differentiation from the hypothetical districts. Table 10 shows that the results of all risk ratio measures (Risk Ratio, Weighted Risk Ratio or
Alternate Risk Ratio) are the same for all three hypothetical districts regardless of their size differences. The Risk Ratio, for example, is 2.25 for each district: small, medium, and large. This means that under any of the risk ratio measures, African-American students have the same risk of being identified in the ID category in a small district as in a medium or large district. This situation is somewhat like a “flat tax rate”, when all individuals are taxed at the same rate regardless of their levels of income. As we know, statistically as well as from our experience in the field, a small district is more vulnerable to overrepresentation or underrepresentation resulting from small enrollment fluctuations than a large district.
Table 10. Effect of Various Disproportionality Measures on Different Sized Districts
District Size Small Medium Actual District Large Data Source Attachment B Attachment C Attachment A Attachment D
Total GE Enrollment (N) 1,000 10,000 16,115 50,000 Total ID Enrollment (N) 10 100 171 500 African-American Students GE Composition (%) 10.00 10.00 31.11 10.00 ID Composition (%) 20.00 20.00 47.37 20.00 ID Risk (%) 2.00 2.00 1.62 2.00
Risk Ratio Measures:
Risk Ratio 2.25 2.25 1.99 2.25
Weighted Risk Ratio 2.60 2.60 1.77 2.60
Alternate Risk Ratio 3.25 3.25 2.62 3.25
E-formula (Overrepresentation : Maximum Percent of ID Allowed at):
One Standard Error (%) 19.49 13.00 34.65 11.34
Two Standard Errors (%) 28.97 16.00 38.19 12.68
Three Standard Errors (%) 38.46 19.00 41.73 14.02
Four Standard Errors (%) 47.95 22.00 45.27 15.37
E-formula (Underrepresentation :Minimum Percent of ID Needed at):
One Standard Error (%) 0.51 7.00 27.57 8.66
Two Standard Errors (%) -8.97 4.00 24.03 7.32
Three Standard Errors (%) -18.46 1.00 20.49 5.98
Four Standard Errors (%) -27.95 -2.00 16.95 4.63
Asian Students
GE Composition (%) 15.00 15.00 21.12 15.00
ID Composition (%) 10.00 10.00 15.20 10.00
E-formula (Underrepresentation :Minimum Percent of ID Needed at):
One Standard Error (%) 3.71 11.43 18.00 13.40
Two Standard Errors (%) -7.58 7.86 14.88 11.81
Three Standard Errors (%) -18.87 4.29 11.76 10.21
Four Standard Errors (%) -30.17 0.72 8.64 8.61
GE = General Education; ID = Intellectual Disability Category
Bold = Overrepresentation; Bold and Italics = Underrepresentation
The E-formula values, on the other hand, show a contrasting picture. The results are different for different sized districts. In the overrepresentation calculation, the E-formula value at one standard error threshold is the highest for the small district (19.49 percent), and less for the medium sized