An Evaluation of the Effects of
Web Page Color and Layout Adaptations
D. C. Brown, E. Burbano, J. Minski & I. F. Cruz
Computer Science Dept., WPI, Worcester, MA 01609, USA.
1. Introduction
An Adaptive Web Site molds itself to the user, creating a unique interaction, providing a more enjoyable experience, and increasing the success of an interaction [1]. Success can be measured in a variety of different ways, including task completion time.
This research studied the effect of web page adaptations on information finding tasks at a web site [2]. Many user interface components, such as page content and web links, can be altered to produce adaptations, but we have limited our work exclusively to the alteration of color and layout.
The hypothesis studied in our research was that these adaptations would allow users to complete tasks in a shorter time, and that this effect would occur whether the adaptations were used individually or together.
A web-based experiment was designed that required each subject to answer three questions. The answer for each could be found by searching through a web site. A local copy of a portion of IBM's Sydney 2000 web site was used for these experiments, in which one hundred and twenty eight students participated. In order to focus on the effects of adaptations we used predetermined adaptations, creating a set of “static” web sites containing all the adaptations to be studied. No dynamic adaptations were made.
Each question was associated with a different adaptation of the web site. For each question, each subject saw either no adaptation (N), a color adaptation (C), a layout adaptation (L), or a combination of both color and layout adaptations (B). In order to reduce the potential effects of learning, and to compensate for adaptation order, the experiment was kept brief and a balanced experimental design was used.
The C, L and B adaptations all reduced task completion time. Statistical analysis suggests that there is significant support from the experimental data for the hypothesis.
2. Literature Review
The Impact of Color & Layout: Researchers agree on some key color usage guidelines. For
example: use color sparingly; use color consistent with cultural and standard meanings; use colors that contrast well; and avoid saturated colors [3]. Color affects symbol legibility. Color coding can reduce visual search time on complex displays, and its advantage increases as the symbol density increases. Adding color that does not convey any meaning yields a longer search time [4].
Layout affects the efficiency of visual access. Guidelines include: following standard layout conventions; matching common eye scanning directions, such as reading direction; using left or
right justified fields and labels appropriately; good use of whitespace; using sufficiently large icons, buttons and other “targets”; and designing layouts to reduce cursor movements [5] [3].
Evaluation of Interfaces: Adaptive web systems are developed, and therefore evaluated, with
five key factors in mind: what application areas are suitable; what user features inform the adaptation (e.g., goal, interests, experience); what can be adapted (e.g., color, links, layout); what adaptation mechanism to use; and what is the goal of the adaptation (e.g., reduce errors, increase speed) [1].
Our work has focussed on evaluating the interaction between what can be adapted and the goal of the adaptation, with little attention paid to the other factors.
Comparative evaluation is typically done against a non-adaptive, static system. In our case we have used several static webpage hierarchies that represent the results of the possible adaptations, their combinations, as well as no adaptation.
3. System Design & Implementation
When an interface uses well-known content and relationships, users tend to anticipate what the site will offer, and concentrate on the experimental task. The 2000 Sydney Olympics Website appealed to us for that reason and several others:
• it was developed by an experienced group of IBM developers; • it used easy-to-understand language;
• its content was non-technical; • it uses well-known content;
• it was well-structured as a wide tree of nodes [3].
The interface for the experiment presents the user with a set of tasks to be completed. The interface design has two frames, an upper one containing a question that defines the current task, and a set of possible answers, while below, in the second frame, the subject can traverse a local partial copy of the Olympics site to locate the answer.
4. Design of the Experiment
Color adaptations are easy to implement, and important for conveying information such as order, grouping, magnitude, etc. Page layout adaptations, while not as easily implemented, can make specific information more accessible to the user. They can emphasize importance and order when dealing with large amounts of information. Layout and color adaptations have the advantage that they can be used by themselves or can easily be combined.
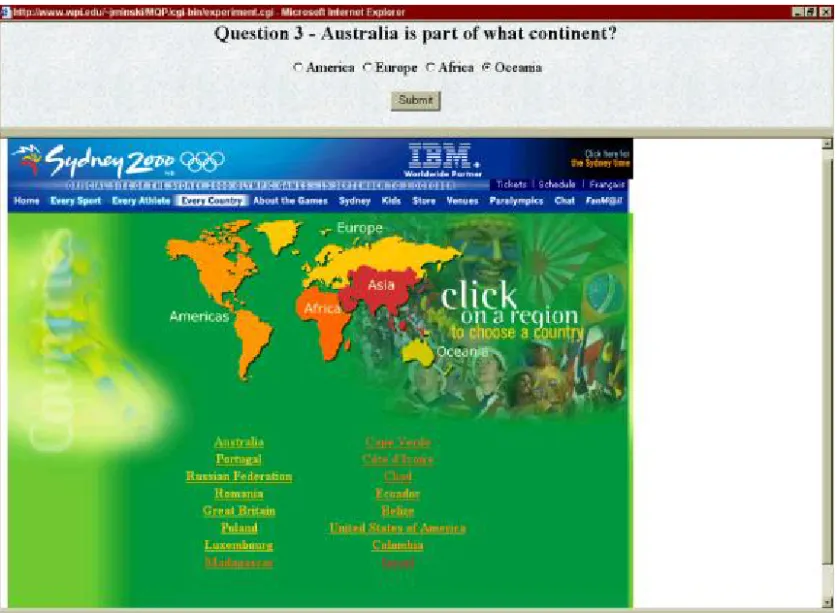
A sample web page with both adaptations is shown in Figure 1. In contrast to the page in the “N” category, the countries are sorted alphabetically (layout) and are color coded to match the continents on the map (color).
Figure 1: A sample web page with both Layout and Color Adaptations.
http://www.cs.wpi.edu/~dcb/MQPs/MinskiBurbano/mqp_files/image071.jpg
Experiments must account for variation by testing a substantial number of subjects. Our web-based approach allowed subjects to visit our experiment from anywhere and at anytime. This helped to increase the sample size, and allowed us to keep accurate records and measurements online. Web-based experiments allow large samples that can differ demographically from the usual, available subjects [6].
We reduced the effects of learning in our experiment by limiting subjects’ interaction with the system. Each subject was presented with only three tasks, keeping their completion time to about nine minutes.
The Four Stages: First, an Experiment Briefing presented overall details that subjects needed to
know before starting the experiment. This included what the site is about, and what browser was preferred.
The following Tutorial included a sample screen capture from an actual experiment with important interface elements labeled. This was intended to help speed up initial use.
Next, subjects completed a Demographics form, recording: age, major, username, citizenship, Internet experience and Olympic knowledge.
In the fourth stage, the Experiment, the subject has to search the Olympics site in the lower frame, to find the answer for each question. Every link-click was recorded, as was the time from “question-prompt” to “question-finish”.
A sample question, used for Layout adaptation and for Color adaptation, was: “In the men's marathon what was Kenya's position in relationship to that of Ethiopia?” The answer choices given were: Same, Better, In between, Worse; with “In between” being the correct answer. Once the subject finished their last task, they were thanked for their time and informed that their information had been saved. Saving the statistical information at that point, prevented recording any incomplete data for a user.
The Web Site: The 2000 Sydney Olympics Web site that we used had to be modified to reduce
its complexity. We aimed for a broad, shallow tree to reduce the chance of users becoming lost or disoriented, and to ensure better productivity [3].
In order to reduce user learning effects, tasks were selected such that the answer to each question was located in a distinctly different area of the Web site. In addition, tasks had to be challenging for the users and require them to actually browse in order to answer correctly. It was also very important to select tasks such that finding the answers could be enhanced by some adaptation.
The Form of the Experiment: The dependent variables were the mean overall task time and the
mean number of mouse clicks, while the independent variable was adaptation. There are four possible adaptations: none (N), color (C), layout (L), and both (B). Each subject was exposed to one of four paths between N and B: i.e., BCN, BLN, NCB, NLB. Subjects were randomly assigned, dynamically at the time of browser use, into one of the four groups that corresponds to these four paths. This “counterbalancing” approach provides compensation for the potential effects of presentation order [7].
5. Results
One hundred and twenty eight subjects participated in the experiment. From the Demographics forms completed we know that: all of the subjects were aged 18 to 23 years old; 73% of the subjects were Computer Science students; 58% were intermediate Internet users, 38% experts, and 3% beginners; and 57% had beginning Olympics knowledge, 30% intermediate, and 9% expert knowledge. As for Internet experience, more knowledgeable users in this field might have had an advantage, allowing faster task completion. We made no analysis based on the demographic data.
One analysis of the data was conducted for subjects who worked with the set of adaptations: Both, Color, and None. Another analysis was done for: Both, Layout, and None. A one-way repeated measures analysis of variance was conducted for time and for number of clicks. Results were significant at p < 0.0005 levels. These results indicate that there are significant differences between the effects of each adaptation.
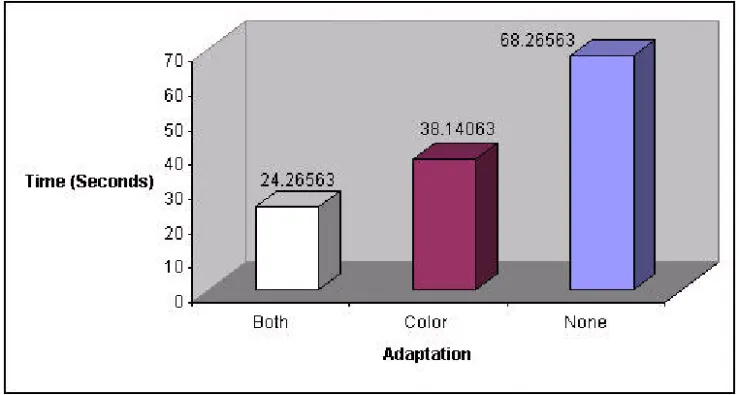
First, we analyzed the overall effects of the two Both-Color-None groups (BCN and NCB) and how each adaptation affected users' performance with respect to time (Figure 2).
Figure 2: Mean overall task time for B, C, and N.
http://www.cs.wpi.edu/~dcb/MQPs/MinskiBurbano/mqp_files/image029.gif
The adaptation was graphed as a function of its mean time value. Sixty-four subjects account for the data. The Both adaptation has reduced task completion time to slightly less than half that of None, and is a significant reduction compared to Color alone. The p-level in this analysis was less than 0.0000001, making these results strongly significant.
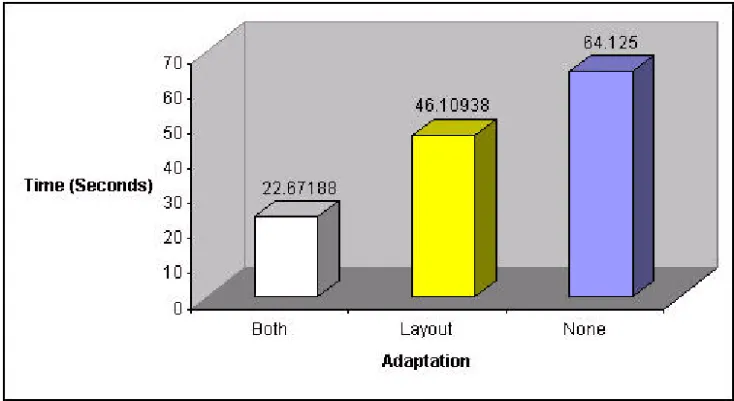
Analysis of the Both-Layout-None group (BLN and NLB) of 64 subjects also shows how each adaptation affected users' performance with respect to time (Figure 3).
Figure 3: Mean overall task time for B, L, and N.
http://www.cs.wpi.edu/~dcb/MQPs/MinskiBurbano/mqp_files/image031.gif
The Both adaptation again correlated with a speedier task completion, being slightly twice as fast as Layout, and nearly three times faster than None. The p-level here was less than 0.000006, again greatly significant.
We also analyzed the behavior of the users in terms of number of clicks, with similar, significant results. The strongest adaptation continued to be Both, yielding half as many clicks compared to Color, and nearly one third of the clicks in the None case.
A “planned comparisons analysis” was used to identify significant differences between individual adaptations. For the Both-Color-None subjects, Both was faster than Color with a significance of 0.00038. It was faster than None with a p-level of zero. For Both-Layout-None, Both was faster than Layout with a p-level of 0.0017, while being better than None with a p-level of 0.00011.
As no single user was exposed to both Color and Layout adaptation alone. It would have been inaccurate to compare these adaptations since the data used did not correspond to the same context or users. However, it can be seen in the graphs that the Color adaptation generated faster task completion than the Layout adaptation. However, this might have been caused by the complexity of the tasks or the degree of adaptation used.
6. Conclusion
We conclude that there is significant support from the experimental data for the hypothesis that adaptations allow users to complete tasks in a shorter time, and that this effect occurs whether the adaptations are used individually or together.
Users achieved their task goals faster when adaptations were present. Color or layout adaptations by themselves reduced average times and number of clicks compared to when there was no adaptation. Even faster task completion occurred when color and layout adaptations were combined. The study suggests that changes in color or layout tend to be more effective when the previous task was completed with no adaptation.
Future studies should categorize both layout and color adaptations, and more systematically vary them in experimental situations, correlating the results with the type of task, and with user preferences/characteristics. In addition, these categories of adaptations should be matched with techniques for accomplishing the adaptations dynamically.
Our results extend basic Human-Computer Interaction results and place them in the context of adaptive systems. They strongly suggest that in addition to the larger scale adaptations currently being experimented with [1], there is an important role for small-scale adaptations in the development of effective and efficient adaptive web sites.
References
1. Brusilovsky, P. (1998). Methods and Techniques of Adaptive Hypermedia. In: Adaptive
Hypertext and Hypermedia. (Eds.) P. Brusilovsky, A. Kobsa & J. Vassileva, Kluwer, pp.
1-43.
2. E. Burbano & J. Minski (April 2001) Qualitative Analysis of Web Site Color and Layout
Adaptations. Major Qualifying Project, <http://www.cs.wpi.edu/~dcb/MQPs/
MinskiBurbano/>, Computer Science Department, WPI, Worcester, MA, USA.
3. Shneiderman, B. (1998). Strategies for Effective Human-Computer Interaction, 3rd edition. Addison Wesley Longman.
4. Durrett, H.J. (1987). Color and the Computer. Academic Press, Inc.
5. Mullet, K. & Sano, D. (1995). Designing Visual Interfaces: Communication Oriented
Techniques. SunSoft Press.
6. M. H. Birnbaum (Ed.) (2000) Psychological Experiments on the Internet. Academic Press. 7. G. Keppel, W.H. Saufley & H. Tokunaga (1992) Introduction to Design and Analysis, 2nd
edition. W. H. Freeman & Co.
___________________________