Abstract
—
The isodensity maps are an useful and potential tool for use in both planning and operation of electrical systems. Using this sort of tools makes possible to optimal trace new transmission lines preventing these lines to pass through areas with high lightning density (LD). In this paper, we show the generation of these isodensity maps. These maps have been obtained through real-time lightning detection using two methods: a statistical and a probabilistic analysis. In order to measure the lighting, we use a commercial antenna that detects the interference originated by lighting using a sweep of the electromagnetic spectrum. The events are captured, stored, and displayed in real time by a computer graphical interface (GUI). We have historical data of at least 4 years. The objective of these studies is to identify within the geographical area covered by the Division Centro Occidente (DCO) de la Comisión Federal de Electricidad (CFE-México) the zones with higher incidence of lightning. This allows DCO to take preventive and corrective actions in planning and operation of high and medium voltage power grid. In order to display the data we used three methods: firstly, a lightning display in real time; secondly a statistic counter displaying lightning density (Number of events/year); and, finally, we made a probabilistic analysis of lightning density using the methodology of Parzen Windows.Index Terms—Lightning, atmospheric discharges, isodensity maps, planning, operation.
I. INTRODUCTION
common issue that electricity companies have to deal daily is the failures produced by lightning in power grids. Furthermore, in many cases, the over voltage are generated by electromagnetic induction which is originated by lightning close to the transmission lines. Because of, this is a natural phenomenon, the behavior is stochastic and it is currently impossible to avoid. Therefore, it has been proposed to use preventive methods such as lightning arresters and guard line placement on transmission lines, to protect them; however, these methods do not always meet the goal.
Manuscript received July 23, 2012; revised July 23, 2012.
Uriel F. Sandoval is a student from the Electrical Engineering Department of the Universidad Michoacana de San Nicolás de Hidalgo, Morelia, México.(mail: [email protected])
J. Alberto Avalos is with the Electrical Engineering Department of the Universidad Michoacana de San Nicolás de Hidalgo, Morelia, México. (mail: [email protected])
Mario Graff is with the Electrical Engineering Department of the Universidad Michoacana de San Nicolás de Hidalgo, Morelia, México. (mail: [email protected])
Alfredo Guzmán is an Engineer of the Comisión Federal de Electricidad,
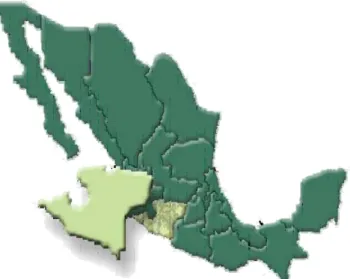
The identification of zones with higher incidence of lightning provides to the electric utilities the opportunity to have an assistant tool for planning and operation of power grids. In planning, this one would allow prevent the placement of transmission lines and electrical substations in high lightning density zones, and the possible relocation of existing infrastructure in areas of lower risk. In operation, this tool would allow to detect zones with opportunity for improvement identifying areas with high incidence of lightning to appropriately locate devices that reduce the negative effects that these have such as: lightning arrestors. The use of statistical methods for data analysis allows decision making with greater certainty; however, this requires the existence of sufficient samples to validate the study. We used a commercial antenna with a radio of 250 km that encloses the geographical area governed by DCO. This are covers completely two states from Mexico: Michoacan and Colima; and a small portion of the state of Jalisco (see Figure 1).
Fig. 1 Geographic area covered by the DCO in Mexico
The antenna has been monitoring for a period of four years. In this paper, we use two methods for analyzing data: statistic counter and Parzen Windows. Both methods generate maps that show graphically the points of highest incidence of lightning. These maps will be contrasted with the facilities of the power grid showing the degree of impact on them.
Which is proposed by analyzing the location of lightning is to have an alternative prevention method. We call it preventive method because through the location of lightning it is possible to generate maps that graphically indicate the density of occurrence of such events. In other words helps us to identify “hot points” that should be averted, or if
A
Isodensity Map Generation by Lightning Detection
facilities already exist in those points, try to mitigate their effects optimally.
The results shown in this paper are the preliminaries from the first phase of the entire project, the second phase is being developed to validate the data so that these data can be trusted to take actions in control and/or operation, avoiding actions that under contingency could damage more the power system. Currently we have installed two antennas that are located geographically at a distance of 200Kms each other, the above in order to verify the information given by each antenna so we can validate the data and have certainty in decision-making. These antennas could cover 100% of the facilities of the DCO.
The rest of this manuscript is organized as follows: The second section explains how it has been engaging the commercial software that was purchased to obtain the data, our storage platform (database), and the data displaying. The third part shows the procedure to validate the data. In the fourth section, we show the different method used for data analysis and the advantages and disadvantages of each one. We show some sober examples of isodensity maps generated by each method. In the fifth and final section we give some conclusions proposing some actions of operation, planning and control that can be carried out by using isodensity maps and real-time lightning sampling.
II. OBTAINING AND HANDLING DATA
For lightning detection we drew up to the material already in the DCO. These are an antenna LD-250, an antenna StormTracker, and its respective Software for data representation. However, the hardware/software did not satisfy all the functions required to study lightning density. As an example the stored data were in a proprietary file format, which was very difficult to manipulate. Moreover, the information given is only an angle (azimuth) and a radius or distance. Figure 2, shows part of the hardware that is currently available for data acquisition.
Fig. 2 Hardware required for the detection of lightning.
The issues mentioned above force us to obtain the data from the manufacturer software and then convert it into georeferenced points using the Vincenty transformation [1]. By making a low-level application we can interact with the manufacturer software, because of we are able to obtain and store the data in real time. The data we have is from 2009 to date. This is a total of 10 million records. This amount of information is extensive in terms of memory and as consequence data manipulation becomes complicated and slow.
Fig. 3 Medium voltage lines in Zitacuaro
For data representation, we decided to add a layer in the georeferenced analysis software “Google Earth®”, because of its versatility and easy handling. To achieve this, we make use of KML and KMZ ("Keyhole Markup Language") [2]. Likewise, DCO has the information of the electrical lines in KML so it is very easy to superimpose layers to do analysis on specific facilities. For example, Figure 3 shows the electrical facilities of Zitacuaro zone, each color represents a circuit of the medium voltage circuit.
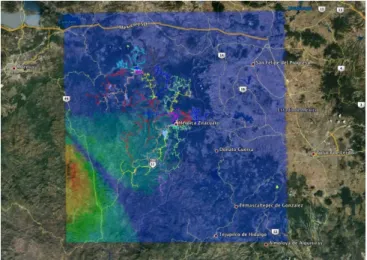
Fig. 4 Statistical representation and lines of MV in Zitacuaro zone
The graphic representation of lightning phenomena is made by degradation of colors as shown in Figure 4, where yellow and red tones indicate high lighting density meanwhile blue and purple tones indicate a low density. We can see from the same figure two layers superimposed in Google Earth. The first on depicts the lines of Medium Voltage in Zitacuaro Zone and the second layer is a statistical density map which shows areas where have been more events from 2009 through 2012.
An additional advantage of using KMZ files is to have the ability to create an embedded application mounted on a web server where the data are displayed, as they would appear on Google Earth.
Fig. 5 Representation of lightning location using proprietary software.
Figure 5 shows the Nexstorm software and their representation of lightning detection that does not meet our expectatives.
III. DATA VALIDATION
Currently, there are two antennas to detect lightning and different electronic equipment to compute the position of the lightning. To perform a validation and a matching of the data, both antennas were installed relatively close to each other. With this we will be waiting that data obtained from both stations to be very similar.
In order to validate the data we display the information of both stations. Figure 6 shows the location of lightning individually. Each symbol has a different color according to the station where the lightning was detected. As can be seen, there is not a parity in detect of lightning between the two stations. Which suggest as a first step one of the two antennas was damaged or the algorithm implemented for the location is very different between them. We are still working in order to obtain more consistent data that allow us to validate the information.
Fig. 6 Data comparison from both stations.
IV. LIGHTNING REPRESENTATION
Previous work [3] has done studies of the lightning information that we have. They performed an analysis using the method of Parzen Windows. Their algorithm was modified to work with the new database and it was included within the system being developed. Furthermore, we propose another method that allows us to count the lightning in a zone without the inclusion of a probabilistic element. Finally, we implemented a scheme where lightning are displayed in real time through a web page.
The method of Parzen Windows obtains from a set of N samples (or events) an estimate of a probability density function. Uses the methodology of Knn (K nearest neighbors) to calculate the probability that a point falls with a region.
For the following images is considered a time range for events given by: "05/01/2012" - "5/14/2012".
The Figure 7 shows an isodensity map generated by the methodology of Parzen windows, again in the Zitacuaro zone. Clearly, we can see some areas that can be considered as “hot points” and should be avoided in constructing a new transmission line.
Fig. 7 Isodensity map using Parzen windows.
Moreover, the statistical method developed makes a grid of sections of approximately one square kilometer. It is swept and counts the number of lightning that fell in each section. This grid colored with reference to the region with the highest number of recorded events.
Figure 8 shows the statistical density of the same events that were shown with Parzen method. But we can see clearly that is a more discreet representation compared with that obtained using Parzen windows, but has the advantage of being a faster algorithm.
Finally, we developed a query system of lightning events in real time. The delay may be a few seconds or a minute depending on the speed of remote data transmission.
Fig. 8 Isodensity map using statistical analysis.
The scheme that we present is a representation of events in a georeferenced way using a gadget of Google Earth embedded in a webpage.
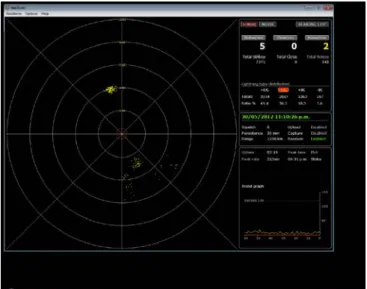
Fig. 9 Lightning representation in real-time.
Figure 9 shows an image taken from the system of real-time data sampling. Which gives the information of the lightning event individually; from its approximate location, type of discharge and the date and time recorded. Such information can be used for real-time monitoring of the evolution of the electrical storms and we can prepare the personal for any eventuality.
V. ISODENSITY MAP OF THE DCO
For the generation of maps and in all the queries we are delimiting the location of the events to a square that covers all the territory where the DCO operates. Figures 11 and 12 show the isodensity maps generated from the data that were recorded during 2012.
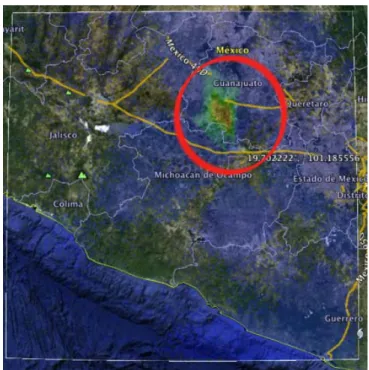
Figure 10 shows the numbers of lightning that have been taken in the DCO during 2012. We can clearly see how storms have concentrated on the boundaries with the state of Guanajuato, and other recorded in the Region of Zitacuaro.
Fig. 11 Isodensity map using Parzen windows.
By using the method of Parzen windows (Figure 11) it is easier to identify areas of high density of lightning. Also, we note some areas that are slightly more dispersed and were not easily noticed by counting statistics.
VI. CONCLUSIONS
In this paper, we have shown preliminary results of what we believe it is an important tool for the detection of areas of high incidence of lightning.
The generation of isodensity maps allows the CFE-DCO’s engineers, in planning and operation areas reduce the risk caused by the bad location of electrical infrastructure in zones with high lightning density. As well as, identifying the portions of facilities that are most affected by these natural phenomena with the location of protective equipment such as arresters to minimize the risk of failure produced by these phenomena.
The lightning records store so far represent a significant number; however, each year must be updated and due to the effects of global climate change actions may be taken into account.
The possibility offered by this tool by comparing failures in power grid against lightning records allows us to take corrective actions in the operation of the grid in terms of opportunities to improve maintenance and in the adjustments of their own electrical protections.
REFERENCES
[1] T. Vincenty. Direct and inverse solutios of geodesics on the ellipsoid wih application of nested equations.Survey Review XXII. 176, 1975.
[2] Documentación KML.
https://developers.google.com/kml/documentation/?hl=es [3] Feliz Calderón, Luis García, J. Alberto Avalos. Estimación de la
Función de Densidad de Probabilidad para el Estudio de Descargas Atmosféricas. Reunión de Otoño de Potencia, Electrónica y Computación ROPEC 2010.